Smart Support and Resistance Trading System
- 지표
- Issam Kassas
- 버전: 1.10
- 업데이트됨: 9 11월 2023
- 활성화: 20
우선적으로 이 거래 시스템은 다시 그리지 않고, 다시 그리지 않으며, 지연되지 않는 것을 강조할 가치가 있습니다. 이는 전문적인 거래에 이상적입니다.
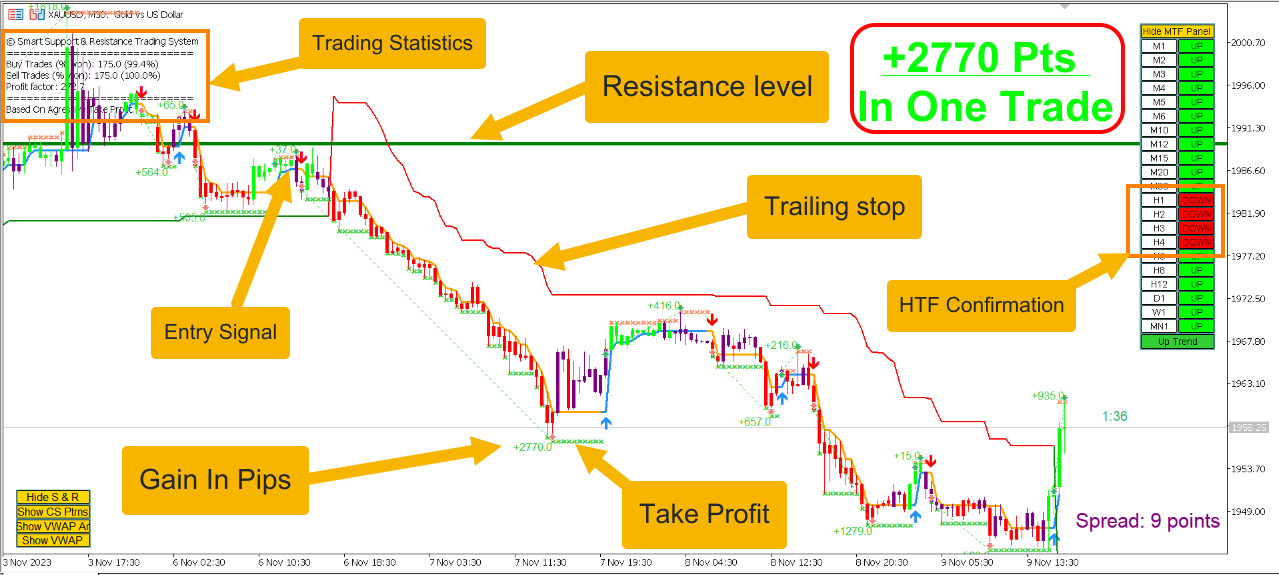
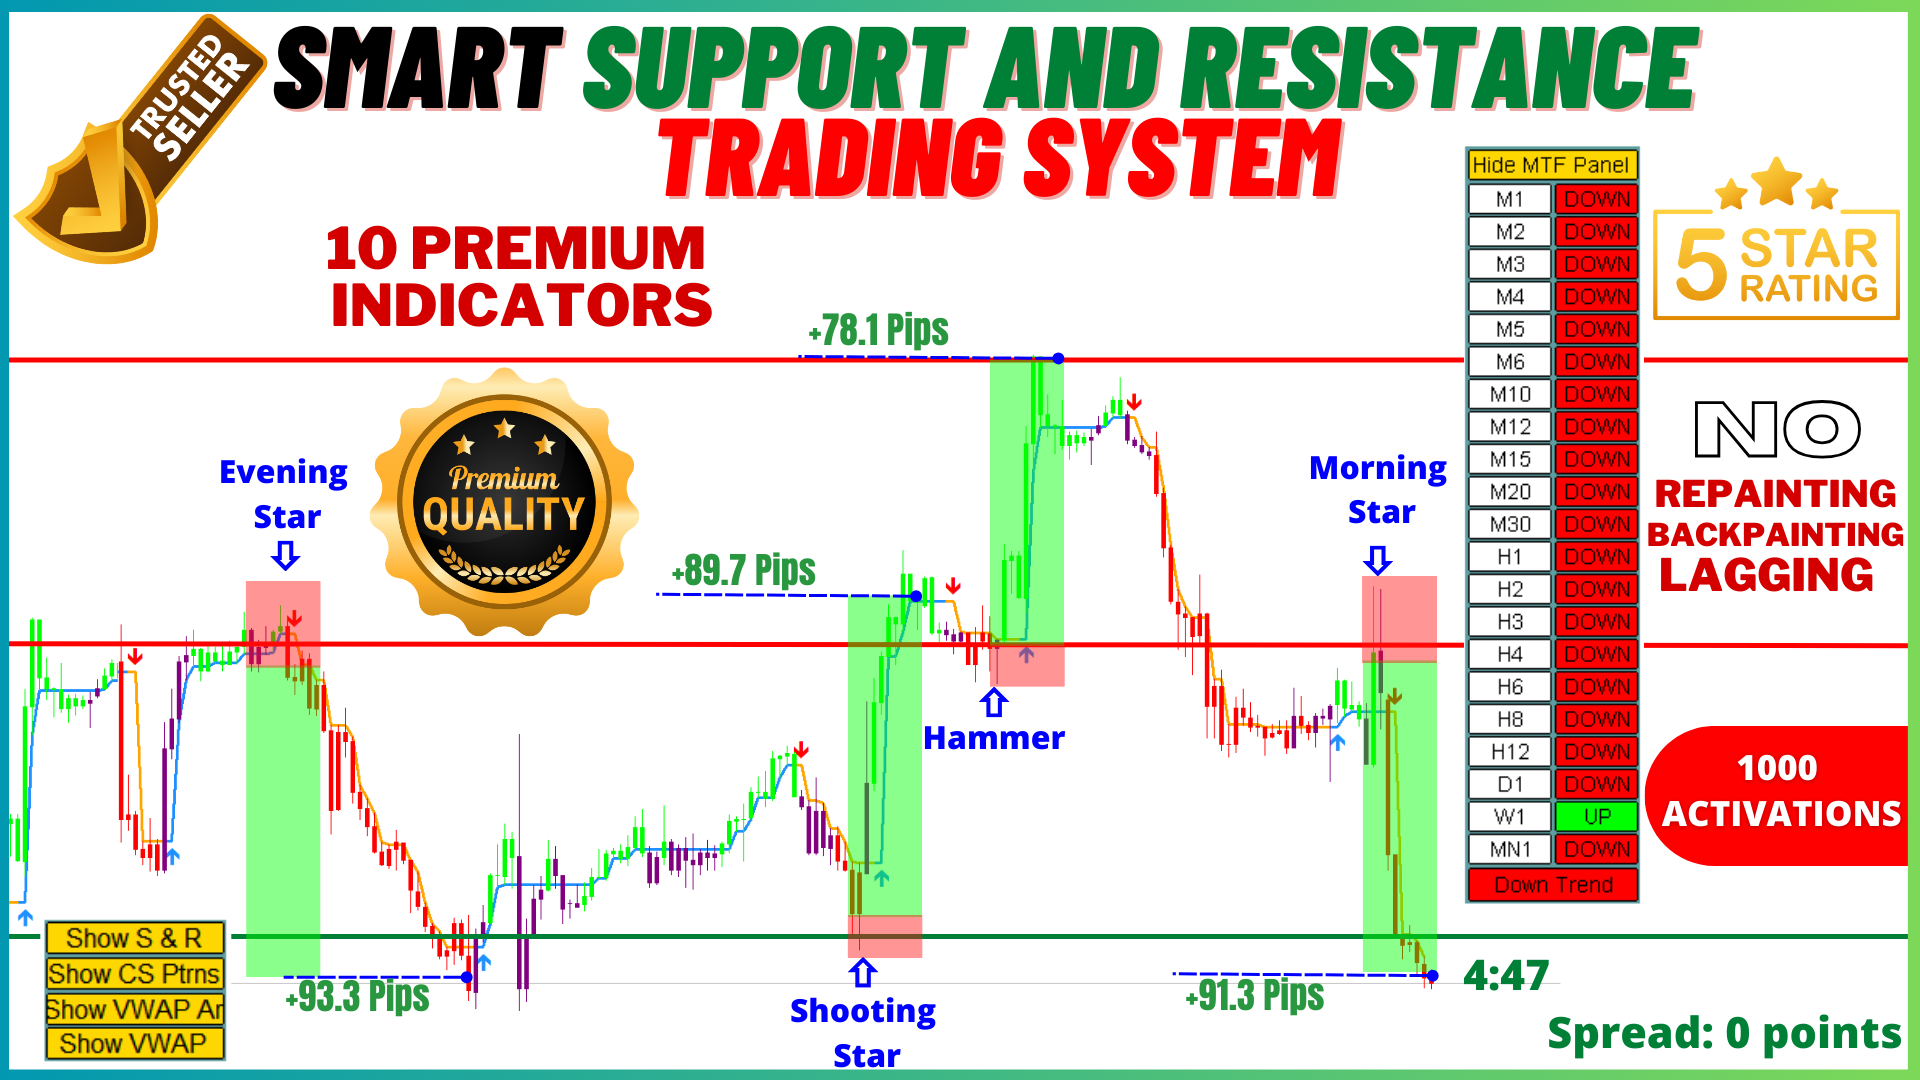
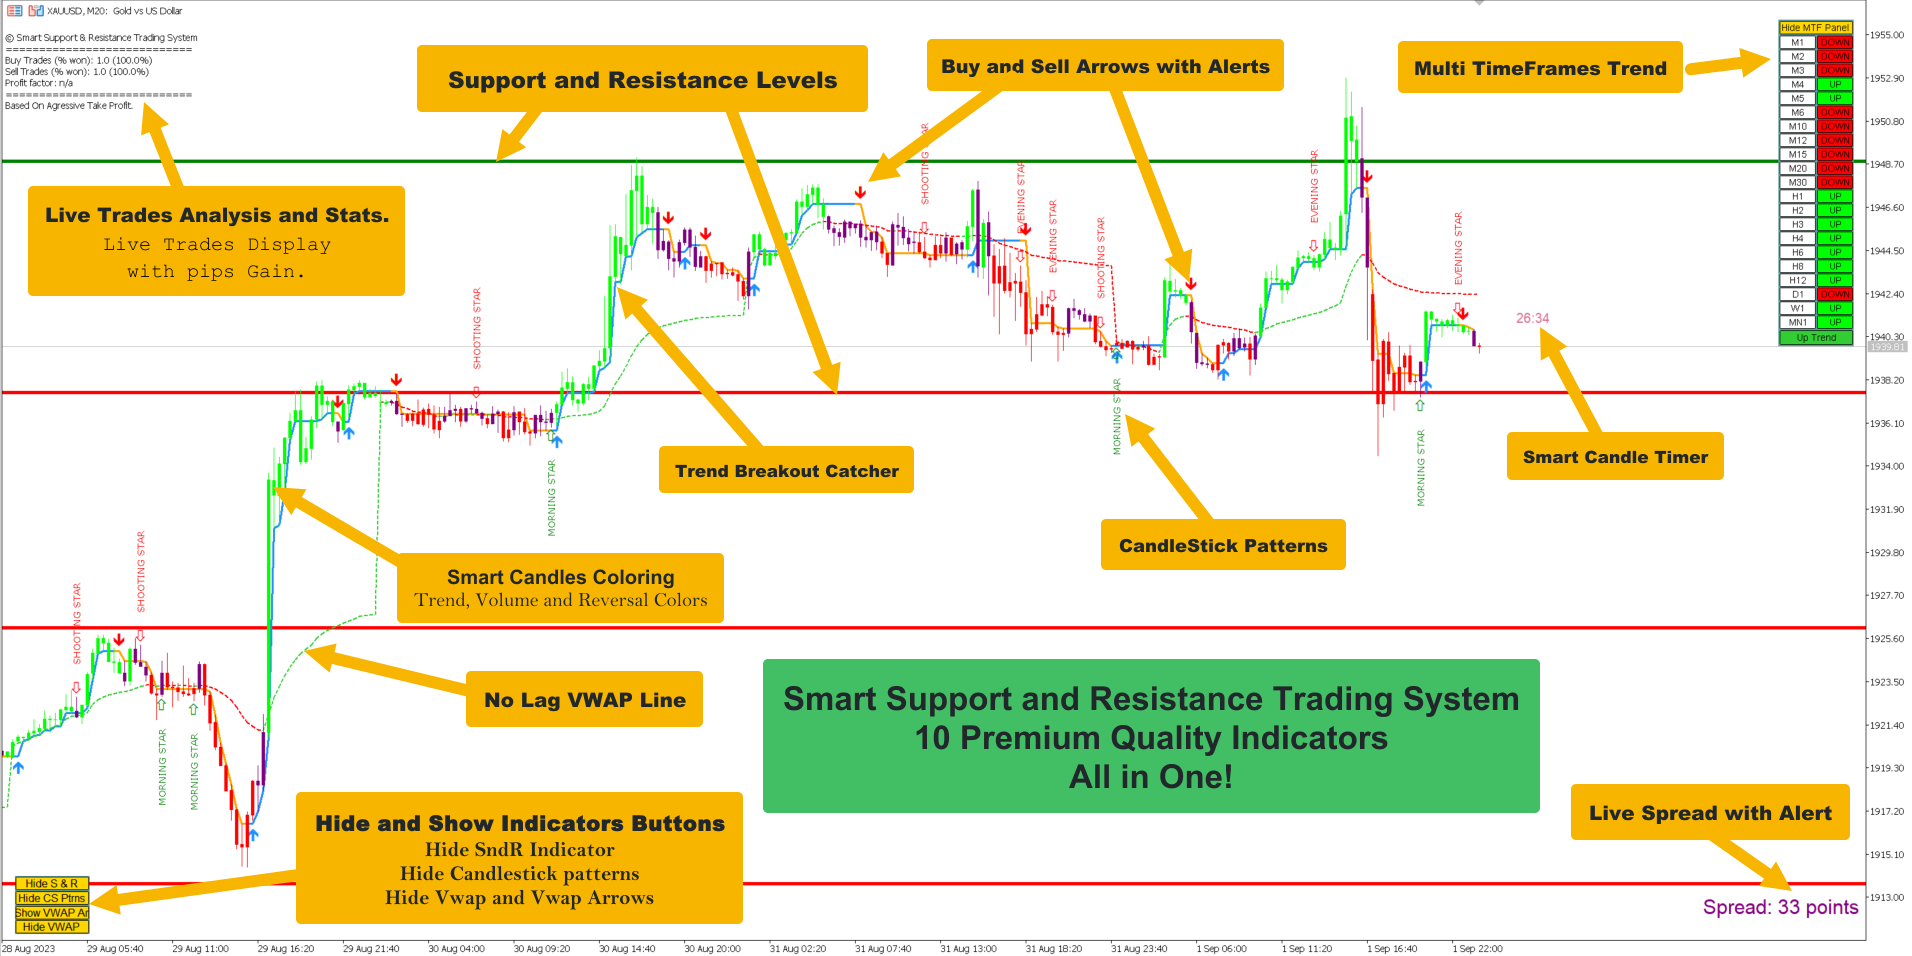
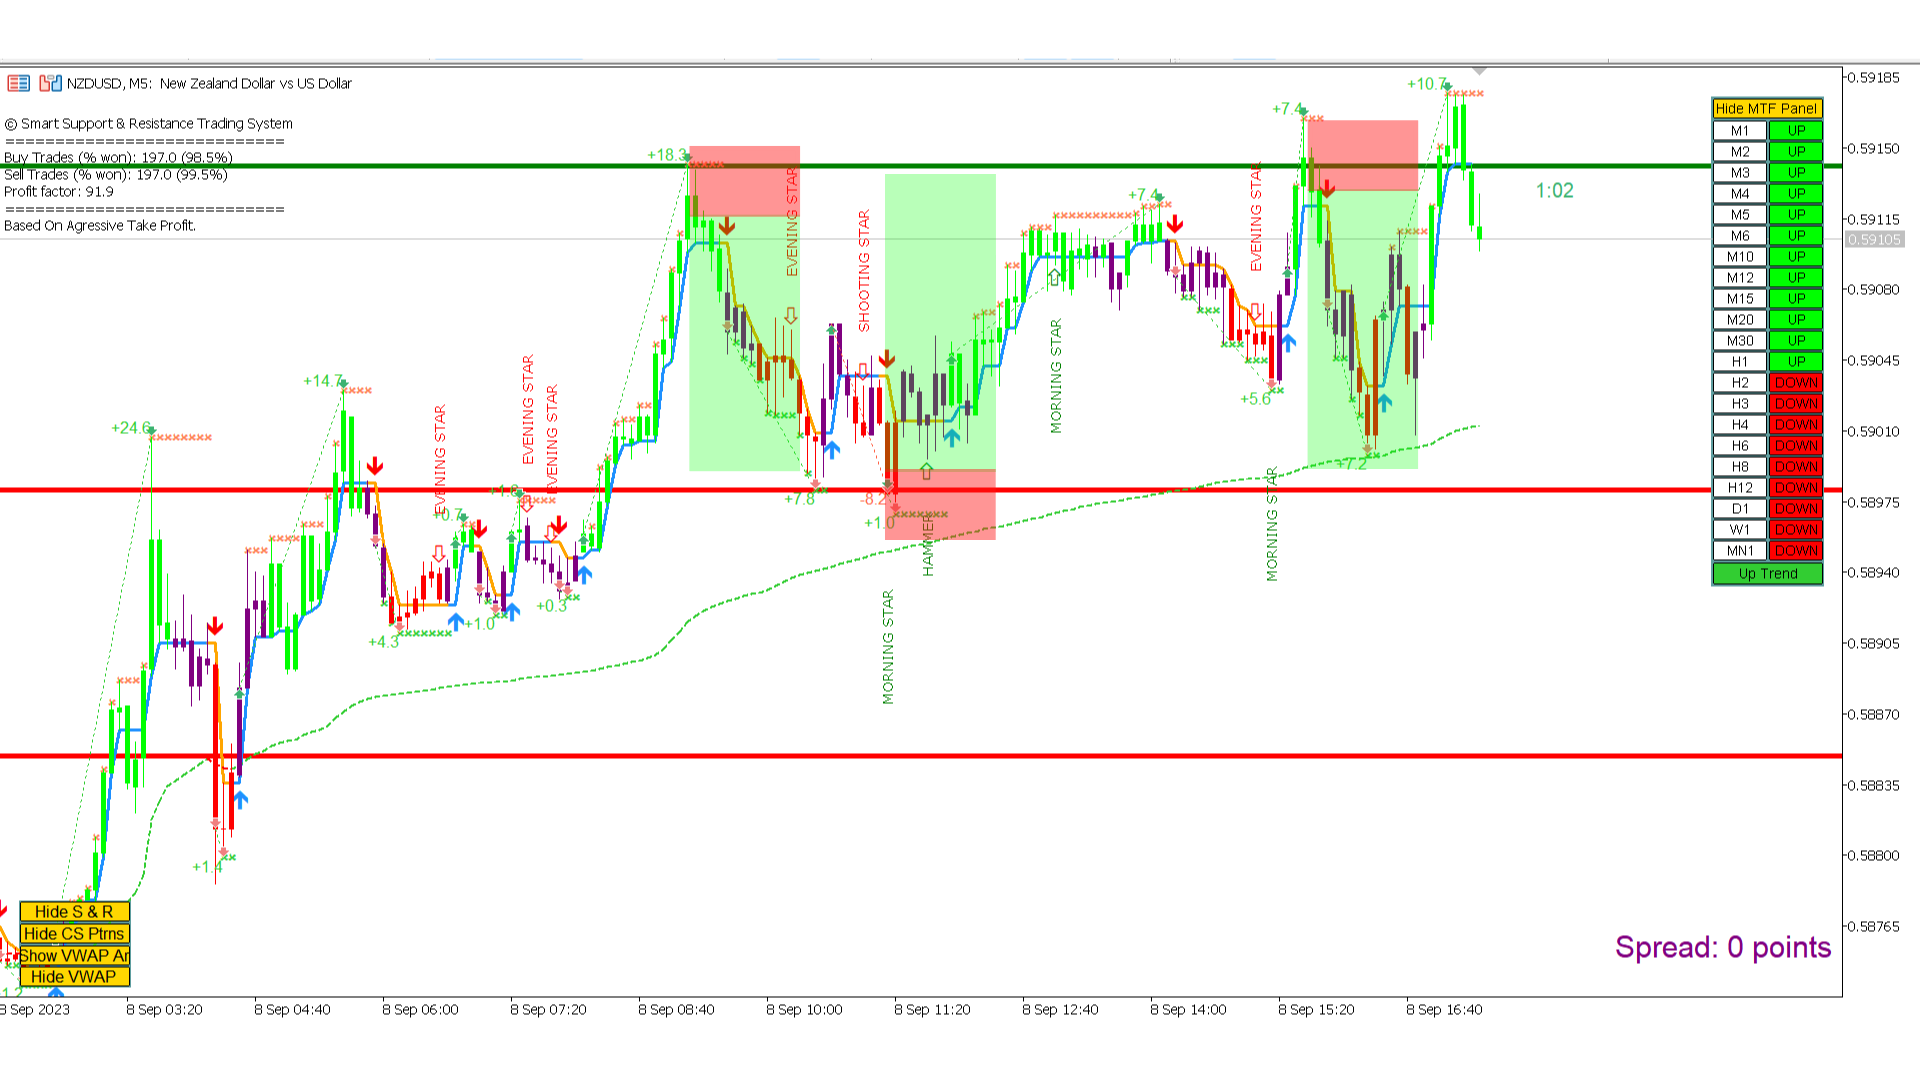
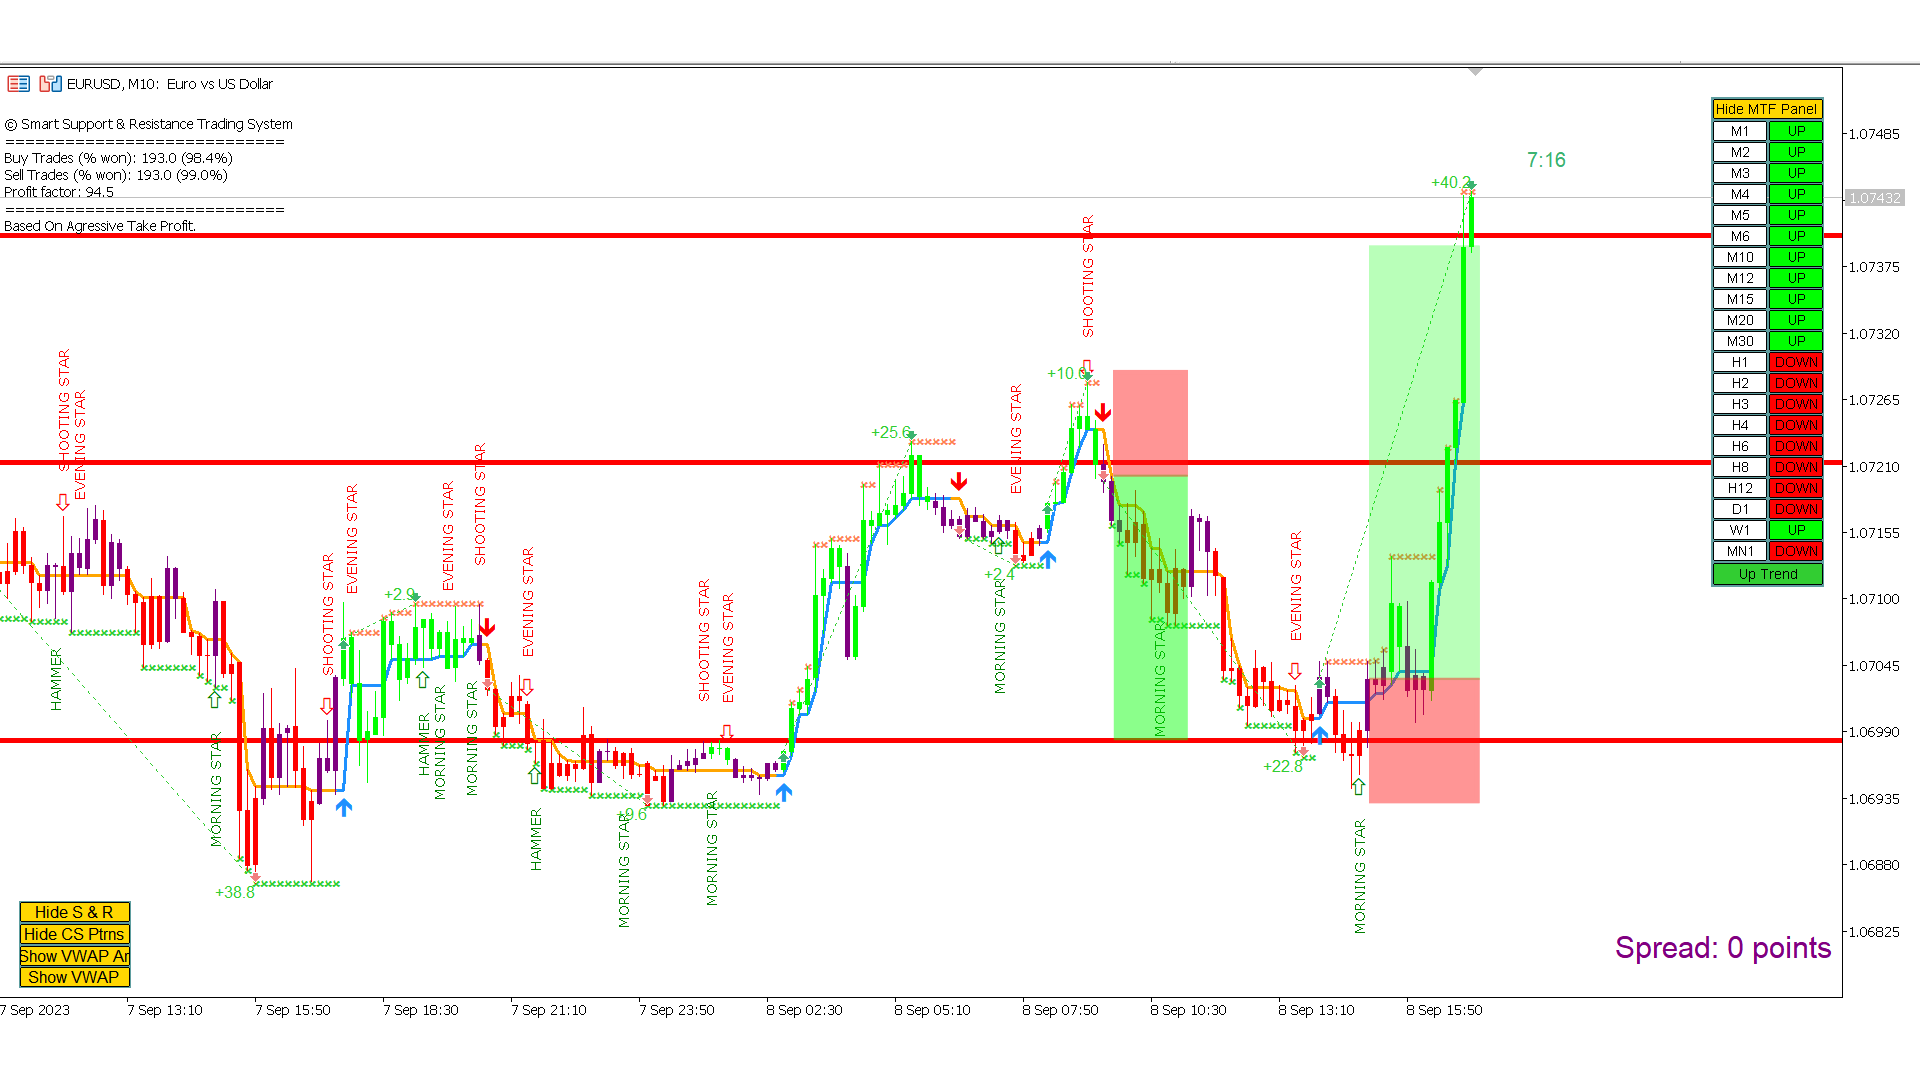
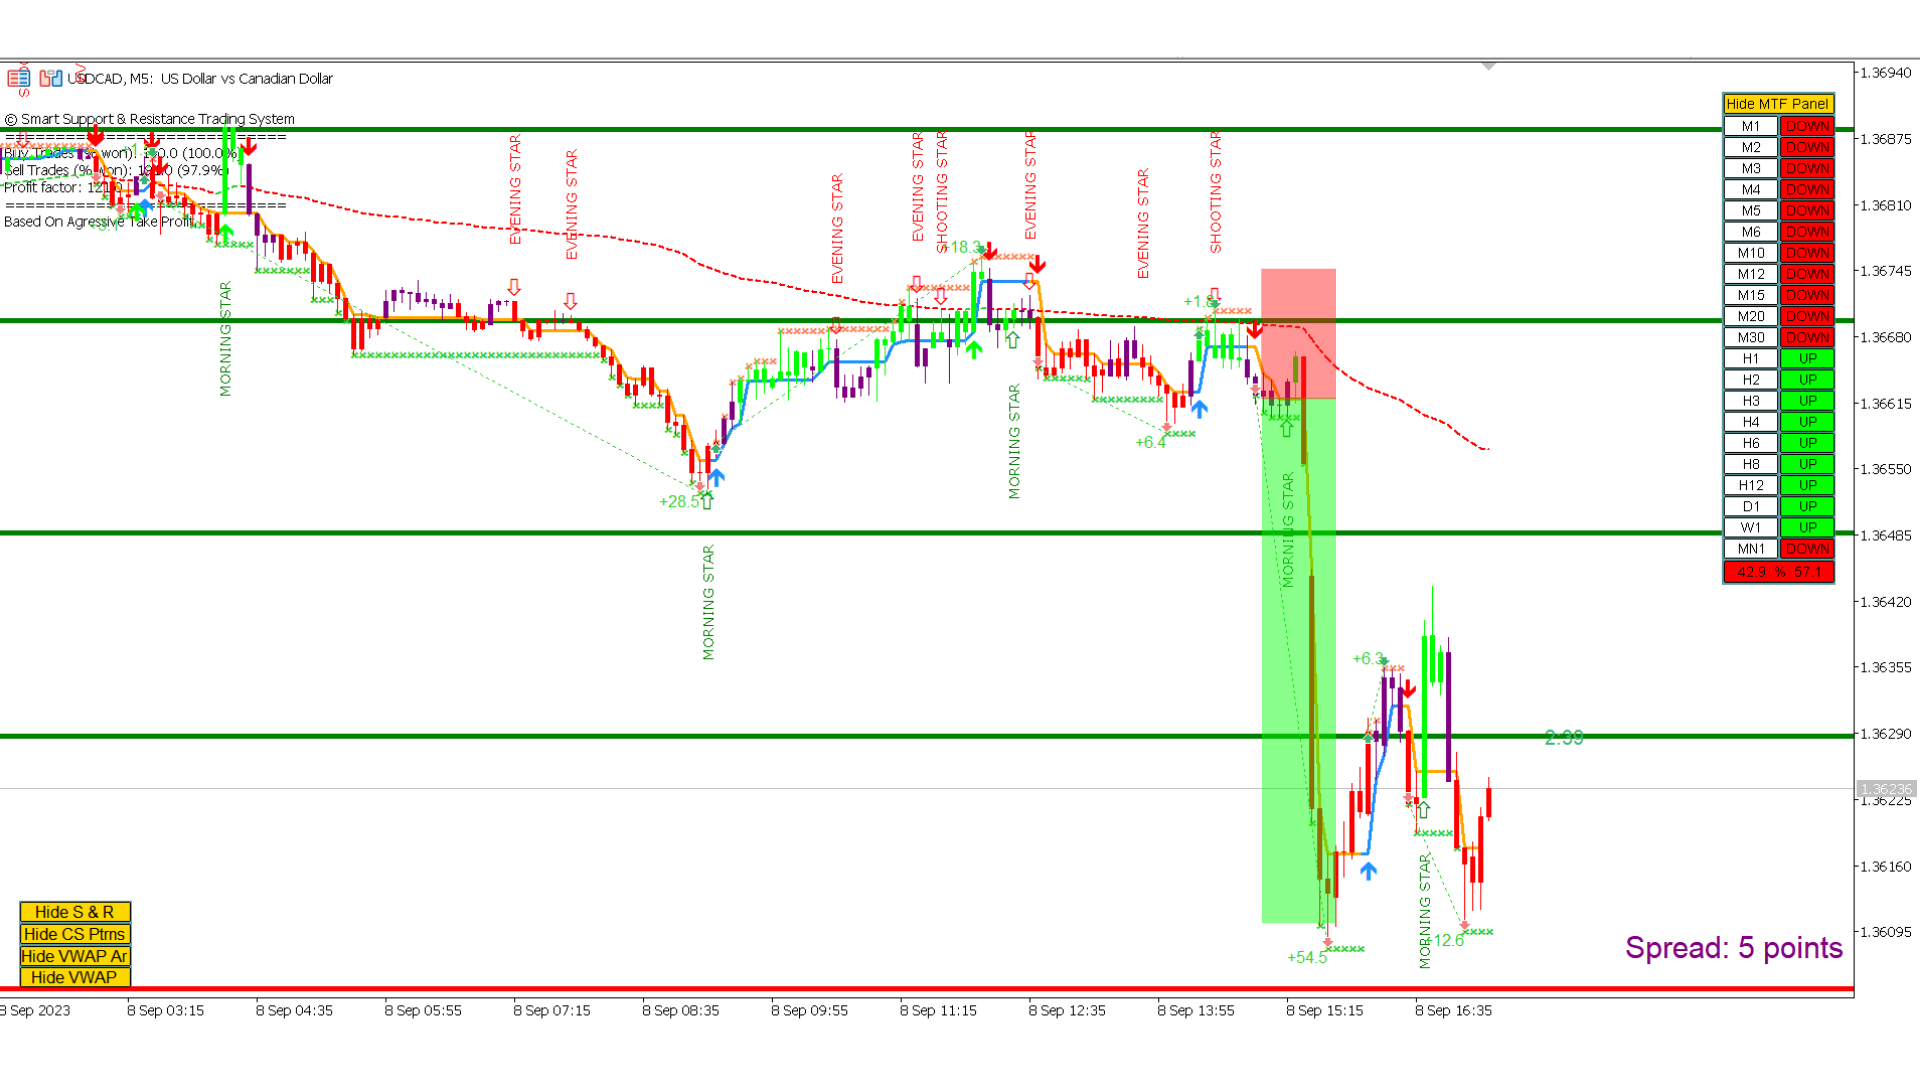
"스마트 서포트 앤 레지스턴스 트레이딩 시스템"은 새로운 및 경험 많은 트레이더를 위해 개발된 고급 지표입니다. 이 시스템은 외환 시장에서 정밀도와 신뢰감을 제공합니다. 이 포괄적인 시스템은 일일 거래 전략, 스윙 거래 전략, 지원 및 저항 전략, 캔들스틱 패턴 전략, VWAP 전략, 다중 시간대 추세 전략 등을 포함한 7개 이상의 전략, 10개의 지표 및 다양한 거래 방식을 결합합니다. 이 시스템은 화살표 신호, 진입 및 출구 지점, 거래 경보, 높은 시간대 추세 분석, 실시간 거래 모니터링 및 트렌드 및 볼륨 캔들 색상 제공합니다. 자동 지원 및 저항 감지로 다양한 시장 상황에서 신중한 결정을 돕는 다면적 인 지표입니다.
스마트 서포트 앤 레지스턴스 트레이딩 시스템은 프리미엄 및 강력한 지표 및 도구 모음을 통합한 견고한 기술 분석 접근 방식입니다. 핵심은 잠재적인 시장 반전 또는 지속을 위한 중요한 서포트 및 레지스턴스 수준을 식별하는 것입니다. 이 시스템은 다중 시간대 트렌드 패널을 원활하게 통합하여 다양한 시간대에서 우세한 트렌드 방향을 평가하는 트레이더의 능력을 향상시킵니다. 또한 캔들스틱 패턴 디텍터는 주요 캔들스틱 패턴을 찾아 잠재적인 시장 움직임에 대한 유용한 통찰력을 제공합니다. 또한 VWAP(거래량 가중 평균 가격)의 포함은 트레이더가 시장 심리 및 인트라데이 트렌드를 평가하는 데 도움이되며, 이는 일일 거래에 이상적입니다.
스마트 서포트 앤 레지스턴스 트레이딩 시스템은 트렌드 브레이크아웃 캐처를 제공하여 트렌드 브레이크아웃을 식별하고 확인하여 트레이더가 적시에 진입하고 체크아웃하는 데 도움을줍니다. 또한 트렌드 및 볼륨 캔들 색상을 사용하여 트렌드 강도 및 볼륨 특성에 따라 캔들을 동적으로 색칠하여 시각화를 향상시킵니다. 실시간 정보를 제공하기 위해 이 시스템에는 실시간 스프레드 인디케이터가 포함되어 있으며, 시장 조건의 변경에 대한 트레이더에게 알립니다. 스마트 캔들 타이머는 캔들 스틱 종료 시간을 인식하고 의사 결정을 돕습니다.
마지막으로 라이브 거래 분석 기능은 트레이더의 거래 성과에 대한 실행 가능한 통찰력을 제공하기 위해 차트에 필수 거래 통계를 직접 인쇄합니다. 이러한 고급 지표 및 도구를 통합함으로써 스마트 서포트 앤 레지스턴스 트레이딩 시스템은 효과적으로 자신감을 가지고 시장을 탐색하려는 트레이더들에게 포괄적인 솔루션을 제공합니다.
특징:
- 리페인팅되지 않음, 다시 그리지 않음, 지연되지 않음 인디케이터
- 7개 이상의 전략
- 모두 10개의 인디케이터
- 일일 및 스윙 거래 전략
- 트렌드 추종, 반전 및 스캘핑 전략
- 사용자 정의 전략
- 프로프 회사 전략
- 진입 및 출구 포인트 및 화살표
- 전화 및 이메일 알림
- 다중 시간대 분석
- 자동 서포트 및 저항
- 모든 종류의 캔들스틱 패턴
- 반전 지역
- 트레일링 스톱
- 볼륨, 트렌드 및 반전 캔들 색칠
- 캔들 타이머 및 스프레드 한도 인디케이터
- 라이브 거래 분석


Hi, I just bougt it. But how come my show panel botton is not working same as Show SnDR? Could you help me to solve it?