• 미리보기
  • 리뷰
  • 코멘트
  • 새 소식

Breakout Box Non Repaint

**MT4용 브레이크아웃 박스 지표 - 효율적인 거래 기회 발견하기**

안녕하세요, 소중한 트레이더 여러분,

저희는 KPRO에서 개발한 강력하고 정확한 거래 도구인 브레이크아웃 박스 지표 버전 2.0을 여러분께 소개해드립니다. 이는 외환 시장에서 거래 기회를 포착하고 수익을 극대화하면서도 위험을 최소화하는 데 도움이 되는 가치 있는 자산입니다.

**주요 특징:**

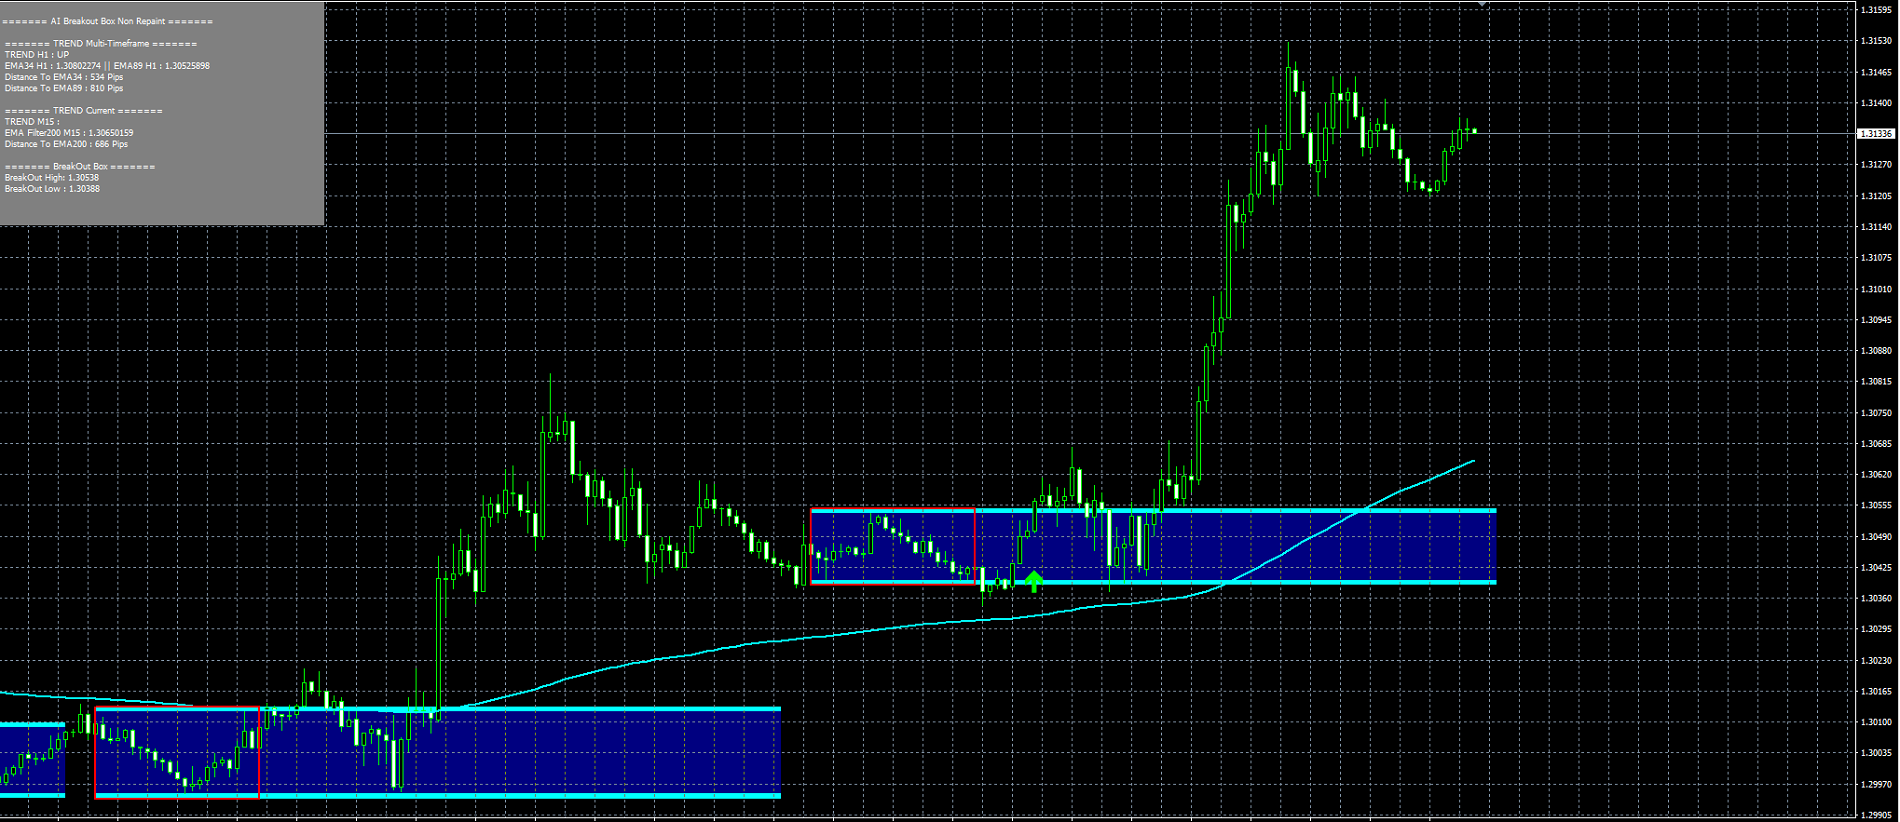
1. **효율적인 브레이크아웃 거래:** 브레이크아웃 박스 지표는 특정 차트의 중요한 브레이크아웃 포인트를 식별하기 위해 특별히 설계되었습니다. 이를 통해 강한 가격 움직임을 포착하고 최상의 거래 기회를 활용할 수 있습니다.

2. **재그림 없는 신호:** 이 지표의 독특한 특징 중 하나는 재그림 없는 신호 능력입니다. 이는 지표가 제공하는 매수 및 매도 신호에 의존할 수 있도록하여 거래 결정에 신뢰할 수 있는 기반이 마련됩니다.

3. **멀티 타임프레임 (MTF) 및 EMA 통합:** 다양한 타임프레임에서 작동할 수 있는 능력으로 여러 타임프레임의 정보를 활용하여 보다 정보를 풍부하게 거래 결정을 내릴 수 있습니다. 이 지표는 또한 시장 트렌드를 효과적으로 식별하는 데 도움이 되는 EMA 라인을 통합합니다.

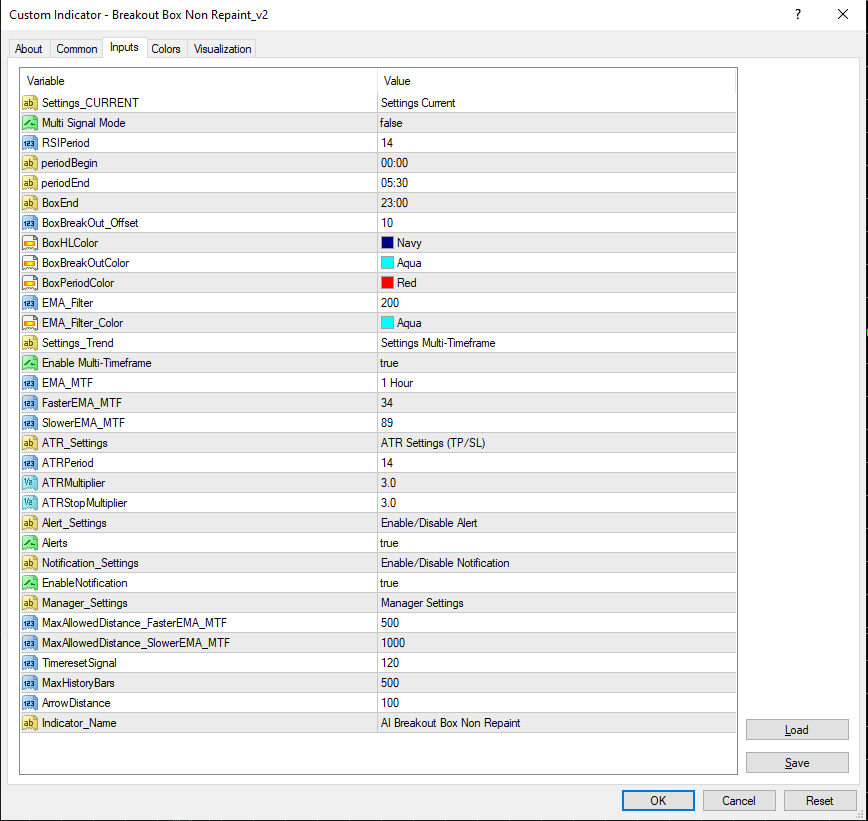
4. **유연한 설정:** 브레이크아웃 박스 지표는 거래 스타일과 전략에 맞게 사용자 정의 가능한 매개 변수를 제공합니다. 브레이크아웃 시간 기간, 오프셋, 색상 등을 조정할 수 있습니다.

5. **알림 및 통지 기능:** 이 지표는 MT4 플랫폼을 통해 알림 및 통지 기능을 지원하여 중요한 거래 기회를 놓치지 않도록 합니다.

**사용 방법:**

브레이크아웃 박스 지표는 사용이 간편하며 초보자와 경험 있는 트레이더 모두에게 적합합니다. MT4 차트에 지표를 적용하고 선호하는 설정에 맞게 조정하기만 하면 됩니다. 그런 다음 매수 및 매도 신호와 중요한 브레이크아웃 포인트를 모니터하여 성공적인 거래를 실행할 수 있습니다.

**결론:**

브레이크아웃 박스 지표를 사용하여 외환 시장에서 거래 기회를 포착할 수 있는 강력한 도구를 보유하게 됩니다. 수익을 극대화하고 위험을 최소화하려면 이 지표를 오늘부터 거래 전략에 통합하는 것을 고려해보십시오.

MQL5 마켓을 방문하여 "AI Breakout Box Non Repaint"를 검색하여 자세한 내용을 확인하고 이 지표를 구매할 수 있습니다. 브레이크아웃 박스 지표로 최상의 거래 기회를 활용하세요!

최선의 인사,
KPRO 개발 팀
추천 제품
Black series MT4
Dmitriy Kashevich
1 (1)
Black series MT4 - The indicator is designed for trading on binary options with Timeframe M1-M5-M15 Multicurrency (Works on cryptocurrency and currency pairs) The signal appears when the candle opens Up to 90% correct signals There is no signal redrawing at all Can be used with other indicators. Good for scalping! In Settings there is: -Indicator working methods -I Allert Arrow color Red signal down Blue signal up Also watch the video how the indicator works and signals
Infinity Trend Pro
Yaroslav Varankin
1 (1)
This is a trend indicator without redrawing Developed instead of the binary options strategy (by the color of the Martingale candlestick) Also works well in forex trading When to open trades (binary options) A signal will appear in the place with a candle signaling the current candle It is recommended to open a deal for one candle of the current timeframe M1 and M5 When a blue dot appears, open a deal up When a red dot appears, open a trade down. How to open trades on Forex. When a signal is rec
VR Cub
Vladimir Pastushak
VR Cub 은 고품질 진입점을 얻는 지표입니다. 이 지표는 수학적 계산을 용이하게 하고 포지션 진입점 검색을 단순화하기 위해 개발되었습니다. 지표가 작성된 거래 전략은 수년 동안 그 효율성을 입증해 왔습니다. 거래 전략의 단순성은 초보 거래자라도 성공적으로 거래할 수 있다는 큰 장점입니다. VR Cub은 포지션 개시 지점과 이익 실현 및 손절매 목표 수준을 계산하여 효율성과 사용 편의성을 크게 높입니다. 간단한 거래 규칙을 이해하려면 아래 전략을 사용한 거래 스크린샷을 살펴보세요. 설정, 세트 파일, 데모 버전, 지침, 문제 해결 등은 다음에서 얻을 수 있습니다. [블로그] 다음에서 리뷰를 읽거나 작성할 수 있습니다. [링크] 버전 [MetaTrader 5] 진입점 계산 규칙 포지션 개설 진입점을 계산하려면 VR Cub 도구를 마지막 최고점에서 마지막 최저점까지 늘려야 합니다. 첫 번째 지점이 두 번째 지점보다 빠른 경우, 거래자는 막대가 중간선 위에서 마감될 때까지 기다립
Owl smart levels
Sergey Ermolov
4.63 (54)
MT5 버전  |   FAQ Owl Smart Levels Indicator 는   Bill Williams 의 고급 프랙탈, 시장의 올바른 파동 구조를 구축하는 Valable ZigZag, 정확한 진입 수준을 표시하는 피보나치 수준과 같은 인기 있는 시장 분석 도구를 포함하는 하나의 지표 내에서 완전한 거래 시스템입니다. 시장과 이익을 취하는 장소로. 전략에 대한 자세한 설명 표시기 작업에 대한 지침 고문-거래 올빼미 도우미의 조수 개인 사용자 채팅 ->구입 후 나에게 쓰기,나는 개인 채팅에 당신을 추가하고 거기에 모든 보너스를 다운로드 할 수 있습니다 힘은 단순함에 있습니다! Owl Smart Levels   거래 시스템은 사용하기 매우 쉽기 때문에 전문가와 이제 막 시장을 연구하고 스스로 거래 전략을 선택하기 시작한 사람들 모두에게 적합합니다. 전략 및 지표에는 눈에 보이지 않는 비밀 공식 및 계산 방법이 없으며 모든 전략 지표는 공개되어 있습니다. Owl Smart Lev
Blahtech Market Profile
Blahtech Limited
4.61 (18)
Was: $249  Now: $99   Market Profile defines a number of day types that can help the trader to determine market behaviour. A key feature is the Value Area, representing the range of price action where 70% of trading took place. Understanding the Value Area can give traders valuable insight into market direction and establish the higher odds trade. It is an excellent addition to any system you may be using. Blahtech Limited presents their Market Profile indicator for the MetaTrader community. Ins
Strong Retracement Points Pro demo edition! SRP (Strong Retracement/Reversal Points) is a powerful and unique support and resistance indicator. It displays the closest important levels which we expect the price retracement/reversal! If all level are broken from one side, it recalculates and draws new support and resistance levels, so the levels might be valid for several days depending on the market! If you are still hesitating to start using this wonderful tool, you can check this link to see h
This indicator is another variant of the famous powerful indicator Fibonacci-SS https://www.mql5.com/en/market/product/10136 but has different behaviour in placing Pending Order and TP Line. Automatically places Fibonacci retracement lines from the last highest and lowest visible bars on the chart with: An auto Pending Order (Buy/Sell). Taking Profit 1, Taking Profit 2 is pivot point and Taking Profit 3 for extended reward opportunity. The best risk and reward ratio. Simple and powerful indica
캔들의 종가를 예측하는 지표입니다. 지표는 주로 D1 차트에서 사용하기 위한 것이. 이 지표는 전통적인 외환 거래와 바이너리 옵션 거래 모두에 적합합니다. 지표는 독립형 거래 시스템으로 사용하거나 기존 거래 시스템에 추가로 사용할 수 있습니다. 이 표시기는 현재 양초를 분석하여 양초 본체 내부의 특정 강도 요인과 이전 양초의 매개변수를 계산합니다. 따라서 지표는 시장 움직임의 추가 방향과 현재 양초의 종가를 예측합니다. 이 방법 덕분에 지표는 단기 및 중장기 거래 모두에 적합합니다. 지표를 사용하면 시장 상황을 분석하는 동안 지표가 생성할 잠재적 신호의 수를 설정할 수 있습니다. 표시기 설정에는 이를 위한 특별한 매개변수가 있습니다. 또한 인디케이터는 새로운 신호에 대해 차트의 메시지 형태, 이메일 및 PUSH 알림 형태로 알릴 수 있습니다. 구매 후 저에게 꼭 써주세요! 나는 당신에게 지표와 거래에 대한 나의 추천을 줄 것입니다! 또한 보너스를 받으세요!
Cosmic Diviner X Planet
Olena Kondratenko
4 (2)
This unique multi-currency strategy simultaneously determines the strength of trends and market entry points, visualizing this using histograms on the chart. The indicator is optimally adapted for trading on the timeframes М5, М15, М30, Н1. For the convenience of users, the indicator renders the entry point (in the form of an arrow), recommended take profit levels (TP1, TP2 with text labels) and the recommended Stop Loss level. The take profit levels (TP1, TP2) are automatically calculated for
이 표시기는 시장 분석을 위한 가장 효과적인 도구 중 하나인 피보나치 지원 및 저항 수준을 자동으로 계산하고 표시합니다. 계산은 선택한 기간 및 기간 동안의 평균 가격 데이터를 사용합니다. 이 기간의 최소값과 최대값은 이동의 시작과 끝으로 간주됩니다. 피보나치 수준을 사용하면 가격 움직임이 느려지거나 역전될 수 있는 잠재적인 기준점을 볼 수 있습니다. 즉, 추가 움직임을 예측하고 정지 및 지정가 주문을 하는 데 사용됩니다. 매개변수: PartsShow - 현재 막대에서 표시된 과거 레벨의 수 CalcPeriod - 가격 평균화 기간 SmoothingMethod - 가격 평균화 방법(26개 옵션) TF - 계산에 사용되는 기간 LevelColor - 레벨 라인의 색상 ZeroLevelColor - 제로 레벨 색상 ShowVerticalLine - 레벨 사이의 수직선 표시 활성화/비활성화 VLineStyle - 수직선의 스타일 VLineColor - 수직선의 색상 ShowInfo - 레
This is an indicator with real-time reminder function, which can realize real-time monitoring of four harmonic patterns of multiple cycles (30 minute chart, 1 hour chart, 4 hour chart, 1 day chart), and help traders to have insight into market reversal opportunities. Gartly Bat Butterfly Cypher Before loading into the chart, you need to manually input the switch parameters, which are the harmonic patterns   and time period you want to monitor: M30 / H1 / H4 / D1. It is on  when the corresponding
Line Magnit
Aleksey Trenin
The LineMagnit Indicator for MT4 is a highly precise tool that builds support and resistance levels which magnetically attract prices. This feature allows traders to easily determine the most probable entry and exit points in the market, as well as identify the market's directional forces, as levels are based on capital inflows into the instrument. Equipped with an intuitively understandable graphical interface, the LineMagnit Indicator enables users to quickly locate and analyze support and res
The Th3Eng PipFinite indicator is based on a very excellent analysis of the right trend direction with perfect custom algorithms. It show the true direction and the best point to start trading. With StopLoss point and Three Take Profit points. Also it show the right pivot of the price and small points to order to replace the dynamic support and resistance channel, Which surrounds the price. And Finally it draws a very helpful Box on the left side on the chart includes (take profits and Stop loss
For sure, this indicator has become very popular amongst traders. Through coding this indicator will give you the most accurate levels possible for your trading analysis. We have also added in the ability for you to receive alerts when the price breaks above or below a Support or Resistance lines! HOW TO USE The red rectangles represent your resistance/supply zone. The green rectangles represent your support/demand zone.  BONUS FEATURES We coded this indicator with the ability to switch between
Gioteen Volatility Index (GVI)   - your ultimate solution to overcoming market unpredictability and maximizing trading opportunities. This revolutionary indicator helps you in lowering your losing trades due to choppy market movements. The GVI is designed to measure market volatility, providing you with valuable insights to identify the most favorable trading prospects. Its intuitive interface consists of a dynamic red line representing the volatility index, accompanied by blue line that indicat
Super Gator
Agustinus Biotamalo Lumbantoruan
This indi shows the following 1. Supertrend 2. Alligator (Not a regular alligator) 3. ZigZag 4. Moving Average 5. Trend Continuation/Mini correction Signal (plotted in X) (See screenshots in green background color 6. Early Signal Detection (See screenshots in green background color) You may treat Alligator as the lagging indicator The leading indicator is the supertrend. The zig zag is based on the leading indicator where it gets plotted when the leading indicator got broken to the opposite.
Trendiness Index
Libertas LLC
5 (3)
"The trend is your friend" is one of the best known sayings in investing, because capturing large trendy price movements can be extremely profitable. However, trading with the trend is often easier said than done, because many indicators are based on price reversals not trends. These aren't very effective at identifying trendy periods, or predicting whether trends will continue. We developed the Trendiness Index to help address this problem by indicating the strength and direction of price trend
ASR Indicator
Arash Nikniazi
ASR (Accurate Support Resistance) Indicator Uniqe formula behind this indicator makes it one the world's best support resistance indicator. watch the tutorial video It is user-friendly and here are some key features : -- different calculations for swing traders and scalpers. -- the lower the accuracy number the further the lines distance is. --easily applicable on all charts. ( try to find the best accuracy number ) recommended accuracy number for Gold is 5or 6, for eurusd 6 or 7. other instru
Szia! Egy indikátorral. Több idő gyertyájának kirajzoltatása egy charton. Különböző színek rendelhetők a long és short gyertyákhoz. Vonal vastagsága állítható. A gyertya kitöltése engedélyezhető. Hello! With an indicator. Drawing multiple time candles on a chart. Different colors can be ordered for long and short candles. Line thickness can be adjusted. Filling the candle can be allowed. Videó: https://www.youtube.com/watch?v=-9bequnAw-g&amp ;ab_channel=GyulaKlein
PABT Pattern Indicator - it's classical system one of the signal patterns. Indicator logic - the Hi & Lo of the bar is fully within the range of the preceding bar, look to trade them as pullback in trend. In the way if indicator found PABT pattern it's drawing two lines and arrow what showing trend way.  - First line - it's entry point and drawing at: 1. On the high of signal bar or on middle of the signal bar (depending from indicator mode) for buy; 2. On the low of signal bar or on middle of t
Buy and sell zones
Evgeniy Zhdan
5 (3)
평면 및 추세를 결정하기 위한 표시기. 가격이 2개의 히스토그램과 2개의 선(빨간색 및 파란색) 중 하나보다 낮으면 판매 영역입니다. 이 버전의 표시기를 구매할 때 하나의 실제 계정과 하나의 데모 계정에 대한 MT4 버전 - 선물로(수신하려면 개인 메시지를 작성하세요)! 가격이 2개의 히스토그램과 2개의 선(빨간색 및 파란색) 중 하나보다 높으면 구매 영역입니다. MT4 버전:   https://www.mql5.com/en/market/product/3793 가격이 두 라인 사이 또는 히스토그램 영역에 있으면 시장에 명확한 추세가 없습니다. 간단히 말해서 시장은 평평합니다. 표시기의 작업은 스크린샷에 더 명확하게 표시됩니다. 지표는 선행 데이터를 얻는 데 사용할 수 있습니다. 또는 현재 추세의 상태를 확인합니다.
Fibonacci retracement and extension line drawing tool Fibonacci retracement and extended line drawing tool for MT4 platform is suitable for traders who use  golden section trading Advantages: There is no extra line, no too long line, and it is easy to observe and find trading opportunities Trial version: https://www.mql5.com/zh/market/product/35884 Main functions: 1. Multiple groups of Fibonacci turns can be drawn directly, and the relationship between important turning points
Night ghost
Dmitriy Kashevich
Night Ghost - Arrow indicator for binary options. This is a reliable assistant to you in the future! - No redrawing on the chart -Works great on EUR/USD currency pairs! -Indicator accuracy up to 90% (Especially at night) -No long setup required (Perfectly set up for Binary Options) - Not late signals - The appearance of a signal on the current candle -Perfect for M1 period (No More!) - Eye-friendly candle color (Red and Blue) -Installed Alert Working with it: - Blue arrow
Atomic Analyst
Issam Kassas
5 (3)
우선적으로 언급할 점은이 거래 지표가 다시 그리지 않고 지연되지 않으며 이를 통해 수동 및 로봇 거래 모두에 이상적이라는 점입니다. Atomic Analyst는 가격의 강도와 모멘텀을 활용하여 시장에서 더 나은 이점을 찾는 PA Price Action Indicator입니다. 고급 필터를 장착하여 잡음과 거짓 신호를 제거하고 거래 잠재력을 높이는 데 도움이 됩니다. 복잡한 지표의 다중 레이어를 사용하여 Atomic Analyst는 차트를 스캔하고 복잡한 수학적 계산을 간단한 신호와 색상으로 변환하여 초보 트레이더가 이해하고 일관된 거래 결정을 내릴 수 있도록합니다. "Atomic Analyst"는 새로운 및 경험이 풍부한 트레이더를위한 종합적인 거래 솔루션입니다. 프리미엄 지표와 최고 수준의 기능을 하나의 거래 전략에 결합하여 모든 종류의 트레이더에 대한 다재다능한 선택지가되었습니다. 인트라데이 거래 및 스캘핑 전략 : 빠르고 정확한 일일 거래 및 단기 거래를 위해 설계
M W Pattern Pro
Nesimeye Oswald
4.14 (7)
M & W Pattern Pro is an advanced scanner for M and W patters , it uses extra filters to ensure scanned patterns are profitable. The indicator can be used with all symbols and time frames. The indicator is a non repaint indicator with accurate statistics calculations. To use , simply scan the most profitable pair using the statistics dashboard accuracy , then enter trades on signal arrow and exit at the TP and SL levels. STATISTICS : Accuracy 1 : This is the percentage of the times price hit
Awesome Oscillator by Bill Williams with the ability to fine-tune and replace the averaging algorithms of the indicator, which significantly expands the possibilities of using this oscillator in algorithmic trading and brings it closer in its properties to such an indicator as the MACD. To reduce price noise, the final indicator is processed with an additional Smooth averaging. The indicator has the ability to give alerts, send mail messages and push signals when the direction of movement of th
BPSPanel
Remi Passanello
BPS Panel Breakout Pro Scalper Solution Panel This indicator is part of the   RPTrade Pro Solutions  systems. BPS Panel   is a daily trend indicator using Price Action, Dynamic Support and Resistances. It's designed to be used by anyone, even the absolute beginner in trading can use it. NEVER repaints . Indications are given   from close to close . Designed to   be used alone , no other indicators are required. Gives you the trend and potential Take Profit at the beginning of the day. How
Delta Pairs
Anatolii Zainchkovskii
1 (1)
Delta Pairs is an indicator for pair trading, it displays the divergence of two currency pairs. Does not redraw. A useful tool for the analysis of the behavior of two currency pairs relative to each other. Purpose The Delta Pairs indicator is designed for determining the divergences in the movements of two currency pairs. This indicator is displayed as two line charts and the difference (delta) between these charts in the form of a histogram. The Delta Pairs indicator will be useful for those
Trend Ray
Andriy Sydoruk
The indicator shows the potential trend direction by cyclical-wave dependence. Thus, all the rays of the intersection will be optimal rays, in the direction of which the price is expected to move, taking into account the indicator period. Rays can be used as a direction for potential market movement. But we must not forget that the approach must be comprehensive, the indicator signals require additional information to enter the market.
Master scalping M1
Nataliia Marchuk
Master Scalping M1 is an innovative indicator that uses an algorithm to quickly and accurately determine the trend.The indicator calculates the time of opening and closing positions, the indicator's algorithms allow you to find the ideal moments to enter a deal (buy or sell an asset), which increase the success of transactions for most traders. Benefits of the indicator: Easy to assemble, does not overload the chart with unnecessary information. Can be used as a filter for any strategy. Works on
이 제품의 구매자들이 또한 구매함
기적적인 외환 지표 소개: 정확한 트레이딩의 힘을 발휘하세요 모든 시간대에서 뛰어난 결과를 제공하는 최고의 외환 지표를 찾는데 지친 적이 있나요? 더 이상 찾을 필요가 없습니다! 기적적인 외환 지표가 도래하여 귀하의 트레이딩 경험을 혁신하고 수익을 새로운 고도로 끌어올립니다. 최첨단 기술과 수년간의 정성스런 개발을 토대로 기적적인 외환 지표는 외환 시장에서의 힘과 정확성의 정점으로 떠오릅니다. 이 탁월한 도구는 모든 수준의 트레이더의 요구를 충족시키고 지속적인 수익을 추구하는 데에서 비길 데 없는 우위를 제공하기 위해 설계되었습니다. 기적적인 외환 지표의 가장 큰 장점은 그 뛰어난 적응성에 있습니다. 당신이 데이 트레이더, 스윙 트레이더이든 장기 포지션을 선호하든, 이 지표는 모든 시간대에서 뛰어난 결과를 제공하기 위해 최적화되었습니다. 그러나 그 정확성과 시장의 복잡한 움직임을 포착하는 능력이 참으로 빛을 발하는 것은 1시간 기간대에서 사용할 때입니다. 기적적인 외환 지표의 정확성
How to use Pair Trading Station Pair Trading Station is recommended for H1 time frame and you can use it for any currency pairs. To generate buy and sell signal, follow few steps below to apply Pair Trading Station to your MetaTrader terminal. When you load Pair Trading Station on your chart, Pair Trading station will assess available historical data in your MetaTrader platforms for each currency pair. On your chart, the amount of historical data available will be displayed for each currency pai
The BB Reversal Arrows technical trading system has been developed to predict reverse points for making retail decisions. The current market situation is analyzed by the indicator and structured for several criteria: the expectation of reversal moments, potential turning points, purchase and sale signals. The indicator does not contain excess information, has a visual understandable interface, allowing traders to make reasonable decisions. All arrows appear to close the candle, without redr
TrendMaestro
Stefano Frisetti
5 (2)
note: this indicator is for METATRADER4, if you want the version for METATRADER5 this is the link:  https://www.mql5.com/it/market/product/108106 TRENDMAESTRO ver 2.4 TRENDMAESTRO recognizes a new TREND in the bud, he never makes mistakes. The certainty of identifying a new TREND is priceless. DESCRIPTION TRENDMAESTRO identifies a new TREND in the bud, this indicator examines the volatility, volumes and momentum to identify the moment in which there is an explosion of one or more of these data a
Connect Indicator
Sukunthakan Ngernbamrung
Connect Indicator is a tool used for connecting indicators between the MQL market and MT4. The connected indicators are made by our group and can be used for other applications, such as sending messages to the Line application or Telegram application. If you have any questions, please don't hesitate to ask us to receive support. Function and indicator buffer Buffer one is the high price of the previous candle. Buffer two is the high price of the previous candle. Usage To connect indicators to fu
The "Easy Ichimoku Wave Meter" indicator is a basic tool to automatically determine Waves according to Ichimoku! The indicator gives the possibility to simultaneously apply the Wave Theory, Time Theory and Target Price Theory according to the "Little Ichimoku" strategy developed by Sense Hosoda on the MT4 platform.  The use of this tool allows not only novice traders to instantly (fully automatic) determine the waves and their rapid interpretation, it also allows to automatically measure the p
PZ Harmonacci Patterns
PZ TRADING SLU
3.43 (7)
This is arguably the most complete harmonic price formation auto-recognition indicator you can find for the MetaTrader Platform. It detects 19 different patterns, takes fibonacci projections as seriously as you do, displays the Potential Reversal Zone (PRZ) and finds suitable stop-loss and take-profit levels. [ Installation Guide | Update Guide | Troubleshooting | FAQ | All Products ] It detects 19 different harmonic price formations It plots primary, derived and complementary Fibonacci pro
Indicator : RealValueIndicator Description : RealValueIndicator is a powerful tool designed specifically for trading on the EURUSD pair. This indicator analyzes all EUR and USD pairs, calculates their real currency strength values, and displays them as a single realistic value to give you a head start on price. This indicator will tell you moves before they happen if you use it right. RealValueIndicator allows you to get a quick and accurate overview of the EURUSD currency pair tops and bottoms,
Gann Signal
Kirill Borovskii
Gann Signal is a very simple indicator at first glance, but hidden inside is many years of experience in studying W.D.Ganna methods. The indicator gives accurate BUY/SELL signals, without redrawing. The indicator is very easy to use. All you need to do is attach it to your chart and follow its recommendations. The indicator constantly analyzes the market for entry opportunities. When such an opportunity appears, the indicator gives a signal in the form of an arrow. I repeat, all signals are NOT
Gold Channel XAUUSD
Paulo Rocha
5 (2)
Gold Channel is a volatility-based indicator, developed with a specific timing algorithm for the XAUUSD pair, which consists of finding possible corrections in the market. This indicator shows two outer lines, an inner line (retracement line) and an arrow sign, where the theory of the channel is to help identify overbought and oversold conditions in the market. The market price will generally fall between the boundaries of the channel. If prices touch or move outside the channel it is a tra
ON Trade Optuma Astro
Abdullah Alrai
5 (4)
물론입니다. 아래는 제공해주신 텍스트의 한국어 번역입니다: MT4용 천문학 지표 소개: 귀하의 최상급 하늘 트레이딩 동반자 트레이딩 경험을 천체의 높이로 끌어올리기 준비가 되셨나요? MT4용 천문학 지표를 소개합니다. 이 혁신적인 도구는 복잡한 알고리즘의 힘을 활용하여 탁월한 천문학적 통찰과 정밀한 계산을 제공합니다. 정보의 우주를 손에 담다: 천문학적 데이터의 보물함을 드러내는 포괄적인 패널을 살펴보세요. 행성의 지오/헬리오센트릭 좌표, 태양/지구 거리, 크기, 길이, 별자리, 황도 좌표 및 적도 좌표, 심지어 수평 좌표 등 각각이 정밀하게 계산되고 아름답게 제시됩니다. 지표에 의해 생성된 수직선은 시간 값에 해당하여 트레이딩 여정에 우주적인 시각을 부여합니다. 행성 라인과 관계: 수정 가능한 스케일과 각도로 차트를 장식하는 행성 라인의 마법을 경험해보세요. 직관적인 컨트롤 패널을 통해 각 행성의 라인의 가시성을 손쉽게 전환할 수 있습니다. 쥰션이나 섹스타일, 사분각, 삼분각, 트
A percent graphic is a type of graph or chart used to represent data as a percentage of a whole. Percent graphics are often used to illustrate how a given set of data is distributed between different categories or how certain trends have changed over time. Percent graphics can be used to show the composition of a dow jones , or the performance of a company over a given period of time   d1 percet  w1 perncet  m1 percent  y1 percenty
Weis Wave with Alert
Trade The Volume Waves Single Member P.C.
4.79 (19)
Rental/Lifetime Package Options and Privileges' * For optimum results the yearly or lifetime package is suggested due to live training and Discord  channel trading with the  creator! Rent Monthly Six Months   Yearly/Lifetime Weis Wave with Speed with Alert+Speed Index x x x Manual  x x x Quick Set up Video x x x Blog x x x Lifetime Updates x x x Setup and Training Material x x Free Rectangle Break Alert Tool      x Discord Access Channel "The SI traders" x 2-hour live methodology traini
Alqannas
Mouhcine Haddad
ALQANNAS (Sniper) Indicator Overview: Welcome to ALQANNAS, your ultimate sniper in the forex market! ALQANNAS is a powerful and versatile trading indicator designed to enhance your trading experience. Whether you're a beginner or an experienced trader, ALQANNAS provides you with accurate non repainting signals, trend direction and strength, and advanced features to elevate your trading strategy.   Key Features: Buy and Sell Signals: ALQANNAS is equipped with a sophisticated algorithm that genera
Full STO
Roman Smoroda
전체 STO 표시기 (프리미엄, 골드, 실버의 세 가지 STO 표시기의 모든 버전 포함)-안정적인 거래 옵션은 자동 바이너리 옵션 거래를 위해 설계되었습니다.  주의 깊게 읽기!!!!! 중요 하나의 터미널에서 만기가 다른 두 개의 템플릿, 즉 18:01, 18:02의 만기가 1 분에서 15 분인 템플릿과 10 분에서 20 분의 만기가 22:00 인 템플릿을 만듭니다. 승률: 지난 5년간 71% 자금 관리: 예치금에서 0.3 이 버전의 지표는 모스크바 시간 18:01, 18:02, 22:00 거래 전용으로 설정되며 실버 및 금의 경우 1에서 15까지, 프리미엄 버전의 경우 10에서 20 분까지 만료됩니다. 신호는 양초 내부에 나타나고 커넥터를 사용하면 양초 내부에 마크 개구부를 넣으면 즉시 거래를 시작합니다. 표시기가 완전히 구성되었으므로 직접 변경할 필요가 없습니다. 설치 및 거래 !!! 확인 및 테스트없이 지표를 구입하지 마십시오. 실제 계정에서
PZ Day Trading
PZ TRADING SLU
3.67 (3)
This indicator detects price reversals in a zig-zag fashion, using only price action analysis and a donchian channel. It has been specifically designed for short-term trading, without repainting or backpainting at all. It is a fantastic tool for shrewd traders aiming to increase the timing of their operations. [ Installation Guide | Update Guide | Troubleshooting | FAQ | All Products ] Amazingly easy to trade It provides value on every timeframe It provides suitable SL and TP levels It impl
Chaos Indicator
Stefano Frisetti
DESCRIPTION The CHAOS INDICATOR has been developed to be used for the TRADING STRATEGY OF CHAOS, as described in the book. The book is in italian language only and can be obtained only on my website indicated below. DATAS COLLECTED AND SHOWN ON GRAPHS The CHAOS INDICATOR apply easily to any graph and any asset, and it is a TRADING FACILITATOR, as it identify immediately the following items on any graph: - The GP (= RIGHT PRICE) i.e. the price to which the asset should be attracted within 24
Gann Swing Structure
Kirill Borovskii
5 (1)
This indicator is based on the mathematics of the great trader W.D. Ganna. With its help, you can easily find strong levels by analyzing swings to find the optimal entry point. The indicator works on all instruments and all timeframes. The indicator is fully manual and has control buttons. All you need to do is press the NEW button, a segment will appear, which you can place on any movement, swing or even 1 candle that you want to analyze. By placing the segment, press the OK button. A grid (th
PZ Swing Trading
PZ TRADING SLU
5 (4)
Swing Trading is the first indicator designed to detect swings in the direction of the trend and possible reversal swings. It uses the baseline swing trading approach, widely described in trading literature. The indicator studies several price and time vectors to track the aggregate trend direction and detects situations in which the market is oversold or overbought and ready to correct. [ Installation Guide | Update Guide | Troubleshooting | FAQ | All Products ] Profit for market swings with
Please send me Direct message on MQL5 CHAT after purchasing the Indicator for Training and Installation Support There are some additional files that is important to use with the Indicator . So be sure to contact me after purchasing the Indicator So that I can add you for training and support . If you find any difficulty with installation then send me Direct message here So that I can connect with you via Anydesk or Teamview for the product installation. " Smart Order Block Indicator " to find
Binary FX Ideal
Yaroslav Varankin
3.5 (2)
great tool for any trader for both Forex and binary options suitable for any trader no need to configure anything, everything has been perfected by time and experience The tool combines 5 indicators and 3 proprietary strategies works great during flats and trends It indicates a trend reversal at its very beginning, it works well with the trend Trading Recommendations The signal is formulated on the current candle You should enter the trade at the next Possible recount (rare)
Gann Zone Pro
Kirill Borovskii
This indicator identifies and displays zones, as it were areas of strength, where the price will unfold. The indicator can work on any chart, any instrument, at any timeframe. The indicator has two modes. The indicator is equipped with a control panel with buttons for convenience and split into two modes. Manual mode: To work with manual mode, you need to press the NEW button, a segment will appear. This segment is stretched over the movement and the LVL button is pressed. The level is displayed
Order Block Indicator MT4
Diego Arribas Lopez
5 (3)
[ MT5 Version ] Order Block Indicator MT4 Order Block Indicator MT4  is currently the most accurate and customizable indicator in the market. It has been developed to facilitate the analysis of operations based on Order Blocks and Supply and Demand Zones. These zones are possible reversal points of a movement. Order Blocks indicate a possible accumulation of orders in one area. The price usually gets to reach and react strongly to those areas. The most relevant levels for this reaction are the c
Full Forex Market View Dashboard
Opengates Success International
5 (2)
전체 외환 시장 보기 대시보드 표시기 이것은 거래자에게 시장에서 일어나는 일에 대한 전체 보기를 제공하기 위해 만들어진 사용자 지정 지표입니다. 실시간 데이터를 사용하여 시장에 액세스하고 성공적인 거래에 필요한 모든 정보를 표시합니다. 설치: 이 지표를 창 차트에 첨부하기 전에 MT4의 Market Watch 패널로 이동하여 필요하지 않거나 거래하지 않는 모든 통화 쌍을 숨기고 나머지는 그대로 두십시오. 그 이유는 FFMV 대시보드가 MT4의 Market Watch에 나타나는 모든 통화 쌍을 표시하기 때문입니다. 최대 30개 이하의 통화 쌍을 표시할 수 있습니다. MT4의 Market Watch에서 그 이상이면 FFMV 대시보드의 글꼴과 이미지가 흐려지고 변형됩니다! 제대로 표시되지 않습니다. 용법:      솔로 트레이딩      바구니 거래의 경우(방법에 대한 스크린샷 참조)      다중 주문 거래에도 사용할 수 있습니다.      자신의 거래
Gann Price Level
Kirill Borovskii
The indicator is designed to work on any trading platform. The program is based on proprietary algorithms and W.D.Ganna's mathematics, allowing you to calculate target levels of price movement based on three points with the highest degree of certainty. It is a great tool for stock trading. The indicator has three buttons: NEW - call up a triangle for calculation. DEL - delete the selected triangle. DELS - completely remove all constructions. The probability of achieving the goals is more than 80
IA Trendx3 PRO
Marco Aurelio Santos Costa
What if God Created a Trade System? No miracles... Just see how mathematics can be effective in the market. We managed to combine technical analysis / price action into indicators, creating the best setup for trading, be it in Forex, Indices, or stocks. It took us 2 years to create something that really works, and now it's time for you to discover it. TrendX3 is a revolution in trend analysis. Based on advanced algorithms and real-time data, it provides valuable insights so that you can make inf
Target 5X Indicator
Ihab Salloum
5 (1)
The 5X target indicator is an indicator that plots the optimal entry zone and the target for the trading day. It also plots a level where the stoploss can be moved to breakeven for a risk free trade which is 2X. This indicator has time window inputs. The default settings are from 02:00 to 19:00 CET+1 time zone. This indicator is based used with a direction bias for the day. I post the direction bias for several pairs in the comments section. Added a new feature Time Zone to help trade the highes
Ferox Breakout
Tat Dat Nguyen
The breakout algorithm is a technique based on price, price features, to shape a breakout strategy. The strategy in this indicator will not be redrawn (none-repaint indicator), it is suitable for short or long term traders In the screenshot is the EURUSD pair, these currency pairs, commodities or stocks, it have similar strength *Non-Repainting (not redrawn) *For Metatrader4 Only *Great For Scalping *Great For Swing Trading *Arrow Entry, Green is Long, Red is Short *Works On Any Timeframe *Work
The Nihilist 5.0 Indicator includes Forexalien and Nihilist Easy Trend trading strategies and systems. It is composed of an MTF Dashboard where you can analyze the different input possibilities of each strategy at a glance. It has an alert system with different types of configurable filters. You can also configure which TF you want to be notified on your Metatrader 4 platform and Mobile application The indicator has the option to view how could be a TP and SL by using ATR or fixed points, even
SMT Divergences MT4
Diego Arribas Lopez
5 (2)
MT5 Version SMT Divergences MT4 SMT Divergences is one of the most innovative indicators in the market. It offers the possibility of analyzing price divergences between 2 pairs. These divergences highlight and help to foresee what banks and institutions are planning to do. SMT divergences also provides you with a kill zones indicator and the possibility of filtering divergences occurring during these kill zones.  The strategy tester is limited in MT4. Contact the author to get your Demo Version
제작자의 제품 더 보기
**Introducing Supply Demand Zones Indicator for MT4** Hello, esteemed traders in the financial markets! Today, we are pleased to introduce to you a powerful tool called the "Supply Demand Zones Indicator" - a valuable utility designed for the MetaTrader 4 (MT4) platform, aimed at helping you identify key supply and demand areas on your trading charts. **Brief Introduction:** The Supply Demand Zones Indicator is a unique technical analysis tool that assists in pinpointing significant price l
FREE
ZigZag Fibo Retracement
Dang Khoa Nguyen
5 (1)
ZigZag Fibo Retracement Indicator Optimize Your Trading Strategy! Are you seeking to optimize your trading strategy in the financial markets? Explore the unique features of the ZigZag Fibo Retracement Indicator, a powerful tool designed to help you identify potential support and resistance levels based on the combination of ZigZag patterns and Fibonacci ratios. Integration of ZigZag Patterns and Fibonacci: The ZigZag Fibo Retracement Indicator combines the effectiveness of ZigZag patterns, helpi
FREE
Enhanced Volume
Dang Khoa Nguyen
Sure, here's the introduction for the "Enhanced Volume" indicator designed for MetaTrader 4 (MT4): --- ## "Enhanced Volume" Indicator for MetaTrader 4 (MT4) Greetings MT4 Traders! The "Enhanced Volume" indicator is a powerful tool designed to help you track and analyze trading volume alongside signals of changing market trends.  ### Key Features: 1. **Separate Window Display:** The "Enhanced Volume" indicator can be displayed on a separate window, making it easy to observe and analyze
FREE
Bollinger Bands Stops Indicator for MT4 The Bollinger Bands Stops Indicator is a versatile tool designed to help traders make informed decisions in the financial markets. Developed for the MetaTrader 4 (MT4) platform, this indicator provides valuable insights by visually representing the Bollinger Bands along with stops and signals. Key Features: Bollinger Bands Analysis: The indicator incorporates Bollinger Bands, a widely used technical analysis tool. These bands help traders identify potentia
FREE
Pivotal Moments
Dang Khoa Nguyen
Dear everyone, Today, I would like to introduce you to an amazing tool on the MetaTrader 4 platform - "Pivotal Moments." This indicator will be a reliable companion on your trading journey in the financial market. "Pivotal Moments" is not just an ordinary indicator, but an intelligent tool that helps you better understand significant fluctuations on the chart. With a variety of customization options, it provides valuable information and deep insights into the market. The key features of "Pivotal
FREE
"얼티밋 논리페인트 스마트" 지표 - 리페인트 없는 스마트한 트레이딩 시스템. 제품 개요: "얼티밋 논리페인트 스마트" 지표는 MT4 플랫폼의 트레이더를 위해 설계된 강력한 도구로, 시장 분석과 거래 결정을 최적화하는 데 도움을 줍니다. 다양한 지표와 스마트 시스템의 결합으로 이 지표는 잠재적인 매수와 매도 포인트를 파악하는 데 도움을 주며 신뢰할 수 있는 거래 신호를 제공합니다. 주요 특징: 논리페인트 없는 시스템: 이 지표의 주요 장점 중 하나는 논리페인트 기능이며, 차트에 표시된 거래 신호가 나타난 후 변경되지 않도록 보장합니다. 이는 신호에 대한 신뢰성을 높이고 정확한 거래 결정을 가능하게 합니다. 다양한 기술적 지표: "얼티밋 논리페인트 스마트" 지표는 이동 평균, RSI, 볼린저 밴드, 불스 파워, 베어스 파워 등 다양한 주요 기술적 지표들을 결합합니다. 이러한 지표들의 스마트한 결합으로 시장의 종합적인 전망을 제공하며 성공적인 거래 기회를 높입니다.
**"Support and Resistance Breakout" Indicator for MetaTrader 4 (MT4)** Hello traders and investors on the MetaTrader 4 (MT4) platform, We are excited to introduce to you the "Support and Resistance Breakout" indicator - a powerful tool designed for MT4 that helps you capitalize on trading opportunities involving support and resistance breakouts effectively and confidently. **Overview:** The "Support and Resistance Breakout" indicator is a custom tool built on the MetaTrader 4 platform,
Welcome to the "Keltner Amplified Breakout" Indicator Are you searching for a powerful and effective trading tool on the MT4 platform? Let us introduce you to the "Keltner Amplified Breakout" Indicator. Designed to help you capture potential trading opportunities, this indicator offers the perfect blend of high performance and user-friendliness. Key Advantages: Identify Strong Trends: This indicator utilizes Keltner channels and fractal signals to identify robust upward or downward trends in
안녕하세요, MetaTrader 4 (MT4) 플랫폼에서 금융 시장에서 수익을 창출하는 최적의 솔루션을 찾고 계신가요? "Sonic R Non Repaint Smart"를 소개합니다 - 정확성과 효율성을 트레이더에게 제공하는 스마트한 거래 시스템입니다. "Sonic R Non Repaint Smart" 소개: "Sonic R Non Repaint Smart"는 높이 평가받는 Sonic R 거래 전략을 기반으로 한 견고한 거래 지표입니다. 우리는 시장 트렌드를 정확하게 식별하는 데 도움을 주는데 그치지 않고 거래 과정을 자동화하는 솔루션을 자랑스럽게 제공합니다. 주요 기능: 재페인 없음, 높은 정확도: "Sonic R Non Repaint Smart"를 사용하면 결코 변경되지 않는 정확한 거래 신호를 받게 됩니다. 이로써 거래 결정에 대한 신뢰감을 높일 수 있습니다. 자동 거래: 시스템은 자동으로 시장을 분석하고 Sonic R 전략을 기반으로 매수 및 매도 신호
EA MT4 제품 - AI PowerTrend Intelligence 소중한 고객 여러분께, MT4 플랫폼을 위한 강력한 도구인 EA (Expert Advisor) "AI PowerTrend Intelligence" 제품을 소개합니다. 이 EA는 금융 시장에서 지능적인 결정과 뛰어난 성능을 제공하기 위해 개발되었습니다. 주요 특징: 지능적인 지표: 본 제품은 Exponential Moving Averages (EMA), Relative Strength Index (RSI), Bollinger Bands, Bulls Power, Bears Power 등 다양한 기술적 지표를 활용하여 지능적인 거래 결정을 내립니다. 자동 거래: 제품은 손절 매도, 이익 실현, 자금 비율과 같은 거래 매개 변수를 설정하여 EA가 자동으로 매수 및 매도 주문을 실행할 수 있도록 합니다. 리스크 관리: EA는 Fixed Lot 또는 계정 잔액을 기반으로 한 리스크 비율과 같은 리스크
AI Sonic R Trader
Dang Khoa Nguyen
AI Sonic R Trader - MT4용 스마트 자동 거래 제품 소중한 고객 여러분께, 우리는 AI Sonic R Trader를 소개하게 되어 대단히 자랑스럽게 생각합니다. 이 제품은 MT4 플랫폼용으로 개발된 스마트하고 효율적인 전문가 컨설턴트(EA)로 KPRO 팀이 개발했습니다. 이 제품은 금융 시장에서 최고 품질의 자동 거래 기능을 제공하기 위해 만들어졌습니다. Sonic R Trader 전략과 인공 지능의 발전이 이 제품의 성공의 기반을 마련했습니다. AI Sonic R Trader의 주요 특징: 스마트한 자동 거래: EA는 지수 이동 평균(EMA)을 포함한 기술적 지표를 결합하는 스마트한 알고리즘을 사용하여 Sonic R 전략에 따라 EMA34 및 EMA89과 같은 지표를 사용하여 차트에서 최적의 진입 및 청산 포인트를 식별합니다. 유연한 위험 관리 및 ATR 활용: ATR(평균 진정 범위)를 기반으로 거래의 위험 관리를 사용자 정의할 수 있는 기능을
TradeMatic EA
Dang Khoa Nguyen
**Introduction to TradeMatic EA for MT4 - Adjust Trading Strategy and Risk Management** TradeMatic EA is a versatile indicator created with version 1.1 by KPRO for MetaTrader 4 (MT4). Designed to assist traders in automating their trading processes, this indicator provides multiple settings and options to fine-tune your trading strategy along with strict risk management. **Key Features:** 1. **Diverse Risk Management:** TradeMatic EA offers various risk management options, allowing you to
AI Breakout Box
Dang Khoa Nguyen
안녕하세요, 금융 시장과 MT4 플랫폼에서 거래에 열정을 가진 동료 트레이더 여러분, 우리는 독특하고 강력한 EA (전문가 어드바이저)인 AI Breakout Box를 자랑스럽게 소개합니다. 이는 특히 브레이크아웃 전략 내에서 거래 결과를 최적화하기 위한 신뢰할 수 있는 자동 거래 도구를 찾는 분들에게 완벽한 솔루션입니다. AI Breakout Box에 대하여 AI Breakout Box는 브레이크아웃 시장 조건 내에서 거래 기회를 감지하고 활용하기 위해 특별히 설계된 전문가 어드바이저입니다. 간단히 말하면, 브레이크아웃은 가격이 범위 내 가격 수준을 뚫으려고 할 때 발생하는 현상을 의미합니다. 이는 트렌드 변화의 가능성이나 중요한 시장 움직임을 나타내는 결정적인 순간입니다. 브레이크아웃 전략의 특징과 장점 자동 브레이크아웃 감지: AI Breakout Box는 RSI, EMA, ATR 등의 기술적 지표를 기반으로 브레이크아웃 신호를 자동으로 식별합니다. 이를 통해 차트에서 중요한
**기존 기술적 지표를 활용한 자동 거래의 힘을 발휘 - MT4용 IndicatorTrader Pro 소개** 안녕하세요! 때때로 귀중히 설정한 기술적 지표를 기반으로 거래 신호를 찾아 차트에 물들어보신 적이 있나요? 거래 결정에 소비되는 스트레스와 시간을 줄이는 방법을 찾고 계시진 않나요? 바로 IndicatorTrader Pro를 만나보세요. 여기에는 모든 트레이더를 위한 완벽한 파트너가 있습니다. ### 기존 기술적 지표를 활용한 자동화 왜 기술적 지표가 시그널을 생성할 때마다 주문 실행에 고민하십니까? IndicatorTrader Pro는 이러한 딜레마를 해결하기 위한 최종 솔루션입니다. 선택한 기술적 지표에 기반하여 자동으로 매수 및 매도 주문을 감지하고 실행하도록 설계되었습니다. ### 기술적 지표의 힘을 이용 IndicatorTrader Pro를 사용하여 RSI, MA, ADX와 같은 기술적 지표의 힘을 최대한 활용할 수 있습니다. 이 EA는 시장
Introducing the "Zone of Supply and Demand Pro" Indicator - Redefining Precision with Multi-Time Frame (MTF) Technology and Non-Repaint Capability In the intricate world of financial markets, understanding supply and demand can be the key to success. We are excited to present the "Zone of Supply and Demand Pro" - a powerful analytical tool designed not only to help you seize trading opportunities but also to ensure unparalleled accuracy through groundbreaking technology. **The Significance
Order Block Pro
Dang Khoa Nguyen
**신제품 출시: 오더 블록 프로 - MT4 거래의 비밀 무기!** 금융 시장에서 당신의 잠재력을 최대한 발휘할 수 있는 새로운 거래 도구를 찾고 계신가요? 그렇다면, 저희가 자랑스럽게 소개하는 것은 "오더 블록 프로"입니다. 이 강력한 도구는 다양한 기능을 제공할 뿐만 아니라 기존의 지표 제약을 극복합니다. **오더 블록 프로의 주요 기능** **1. 정확한 진입 신호:** 차트와 상호작용할 때, 오더 블록 프로는 단순히 진입 화살표를 보여주는데 그치지 않습니다. 이러한 화살표가 "리페인트"되지 않도록 보장하여 불확실성을 제거하고 독특한 진입 신호를 제공합니다. **2. 적시에 발생하는 알림:** 오더 블록 프로는 중요한 주문 블록 지역을 식별하는데 그치지 않고, 가격이 이러한 지역에 접근했을 때 알림을 발생시키는 기능도 제공합니다. 이로써 신속하고 정확한 거래 기회를 포착할 수 있습니다. **3. 유연하고 맞춤 설정 가능:** 오더 블록 프로는 선호에 맞게 맞
TrendLine ProX
Dang Khoa Nguyen
**TrendLine ProX - The Ultimate Non-Repaint Indicator for MT4 Trading** **Product Introduction:** We are delighted to introduce TrendLine ProX - an optimized and reliable trading tool for the MT4 platform. With its accurate trend detection and non-repainting feature, TrendLine ProX will be your trustworthy companion to support intelligent trading decisions. **The Power of TrendLine ProX:** TrendLine ProX is more than just a trading tool; it is a harmonious blend of technology and market ana
Introducing Market Structure AIO: The Smart Money Concepts Mastermind Tired of chasing false signals and battling market confusion?   Introducing Market Structure AIO, the all-in-one indicator powered by Smart Money Concepts, designed to   unravel market structure, identify high-probability trade opportunities, and empower you to trade with confidence. What is Market Structure AIO? A comprehensive Smart Money Concepts toolkit:   Analyze market structure, identify imbalances, and anticipate price
필터:
리뷰 없음
리뷰 답변
버전 2.2 2023.08.23
More filters MA RSI ADX VOLUME
Add BoxBreakout StopLoss
버전 2.1 2023.08.17
increase processing efficiency