• 미리보기
  • 리뷰
  • 코멘트 (6)
  • 새 소식

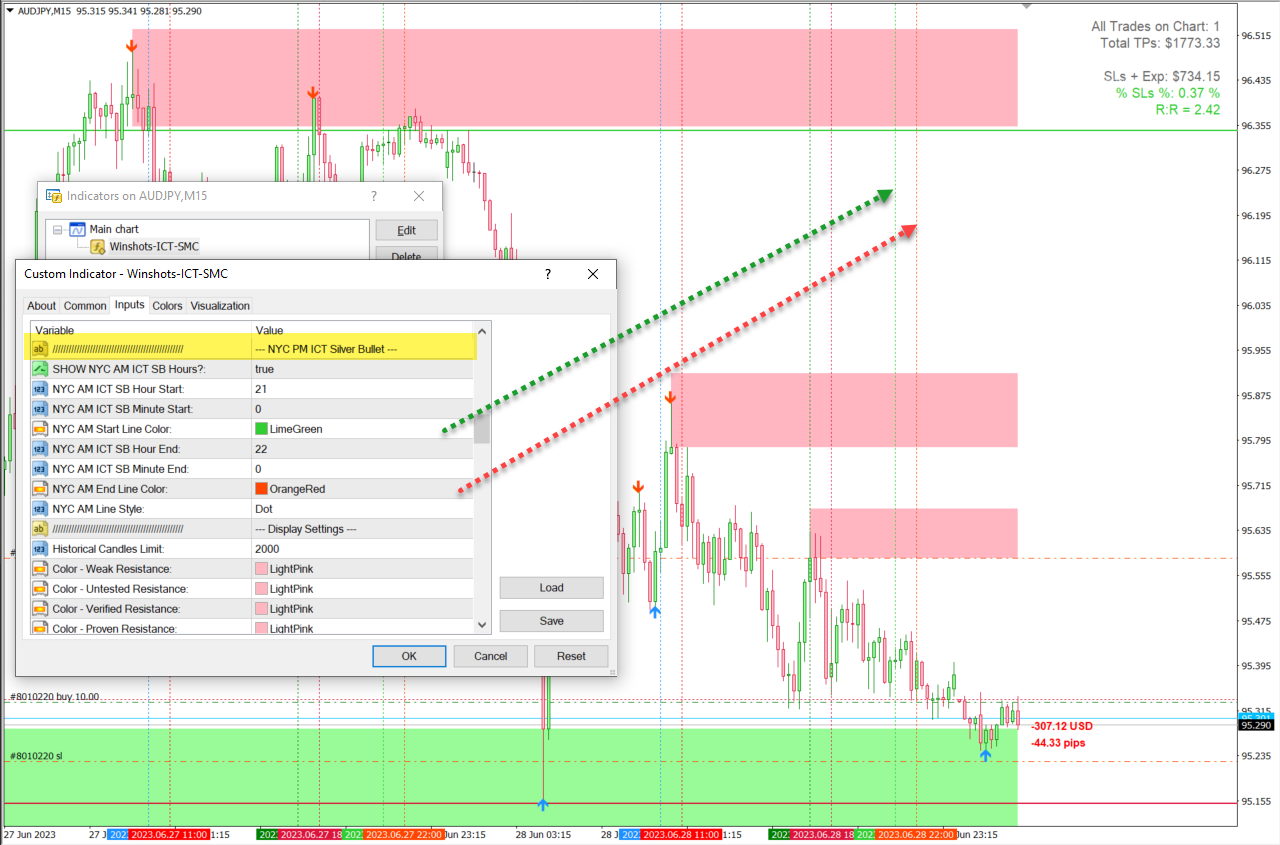
Winshots ICT Silver Bullet SMC System

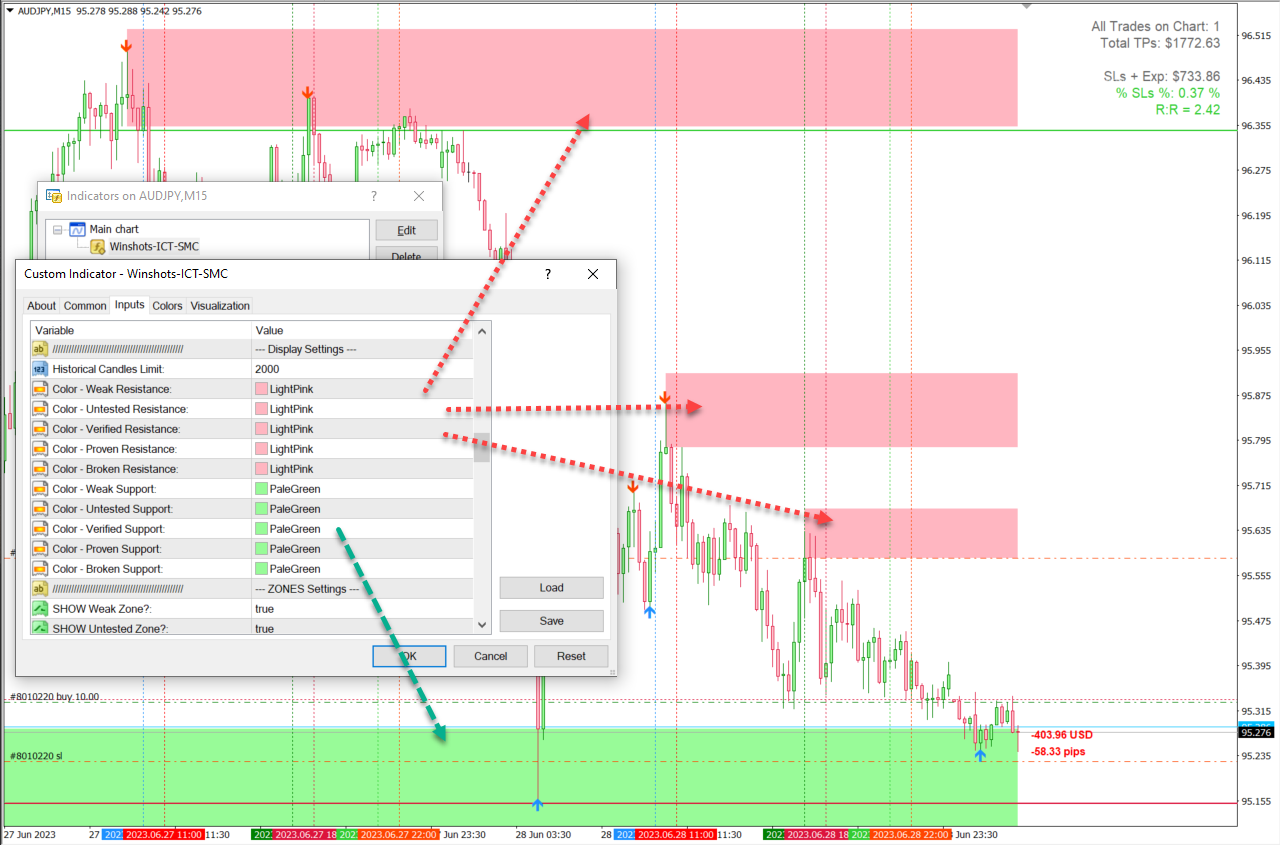
This indicator will help you identify the key zones needed for The Silver Bullet Strategy which are:

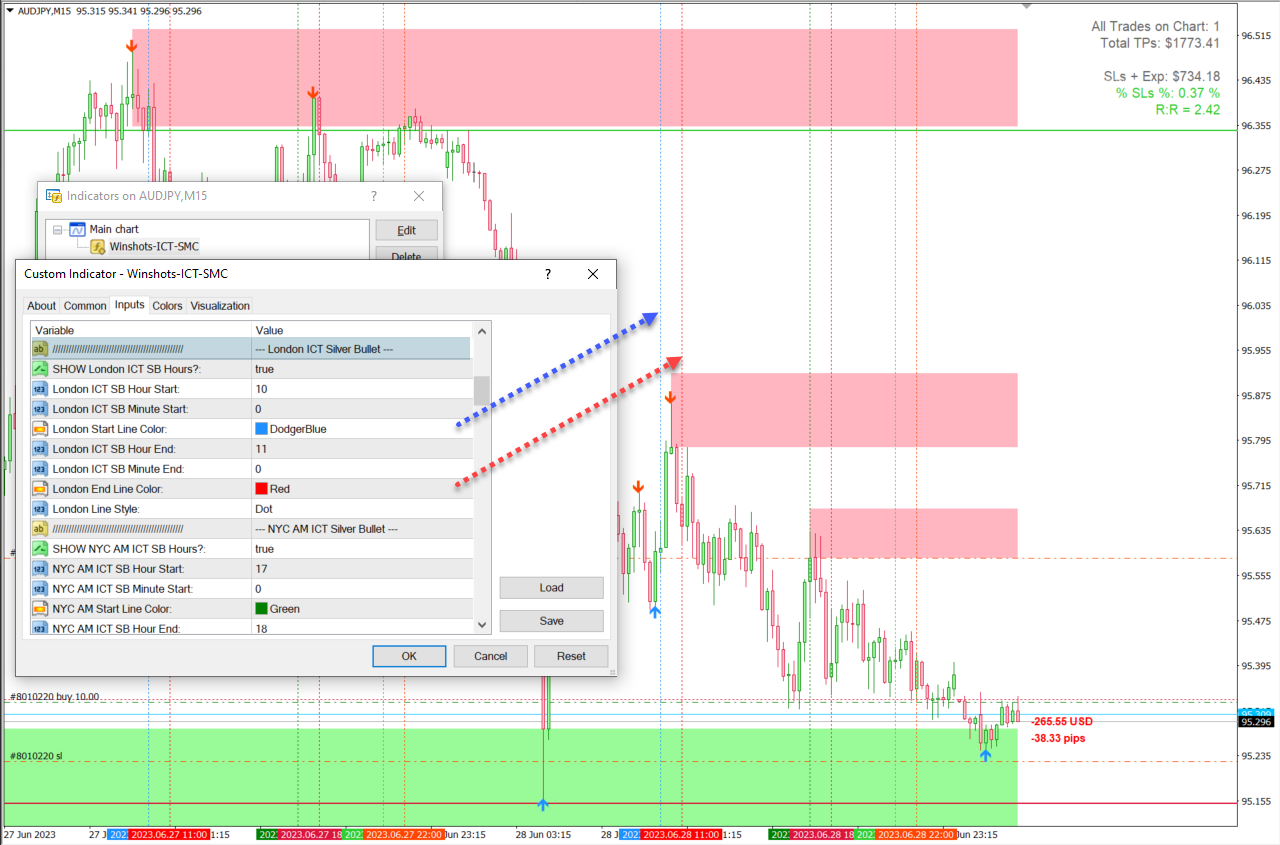
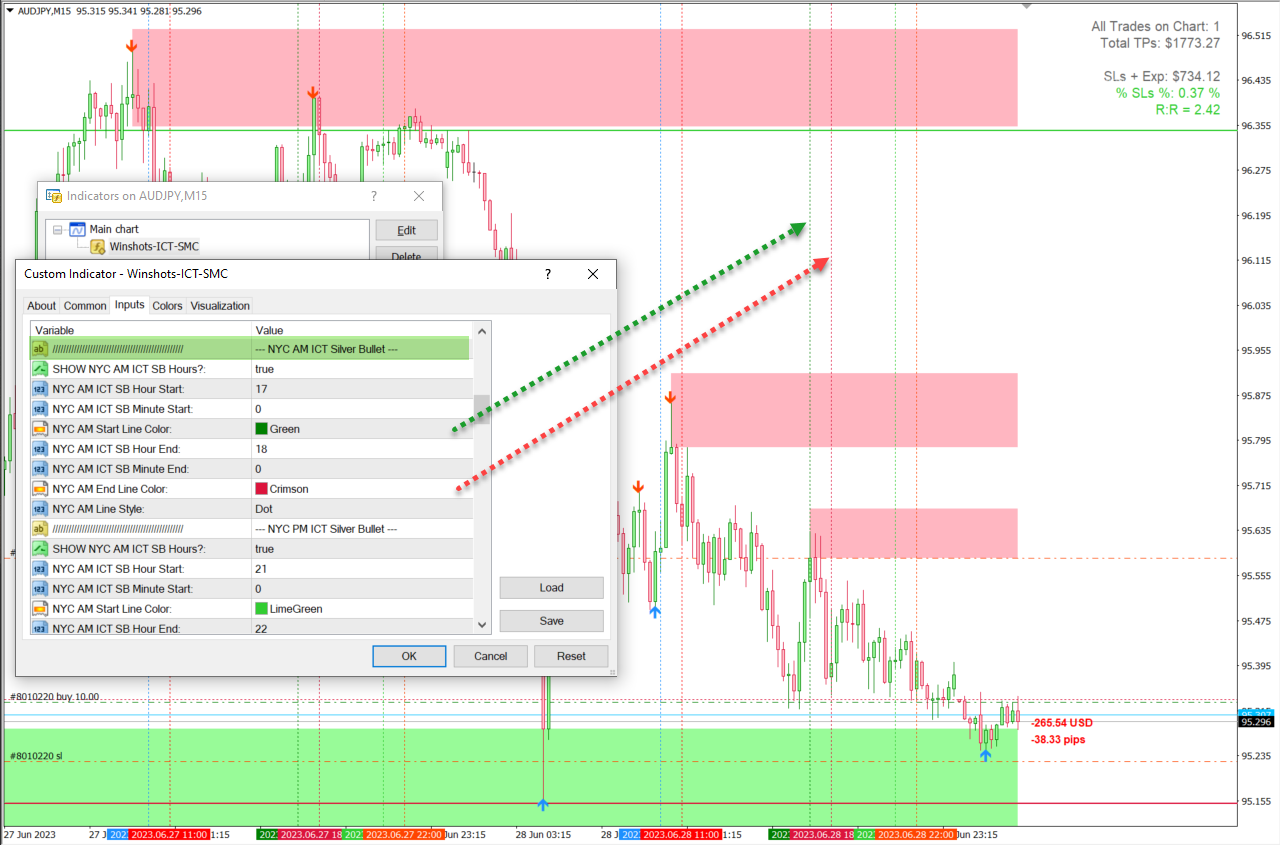
  •  The three time-windows the ICT mentioned in the strategy
    • Window 1: 3 AM and 4 AM New York time
    • Window 2: 10 AM and 11 AM New York Time
    • Window 3: 2 PM to 3 PM New York Time
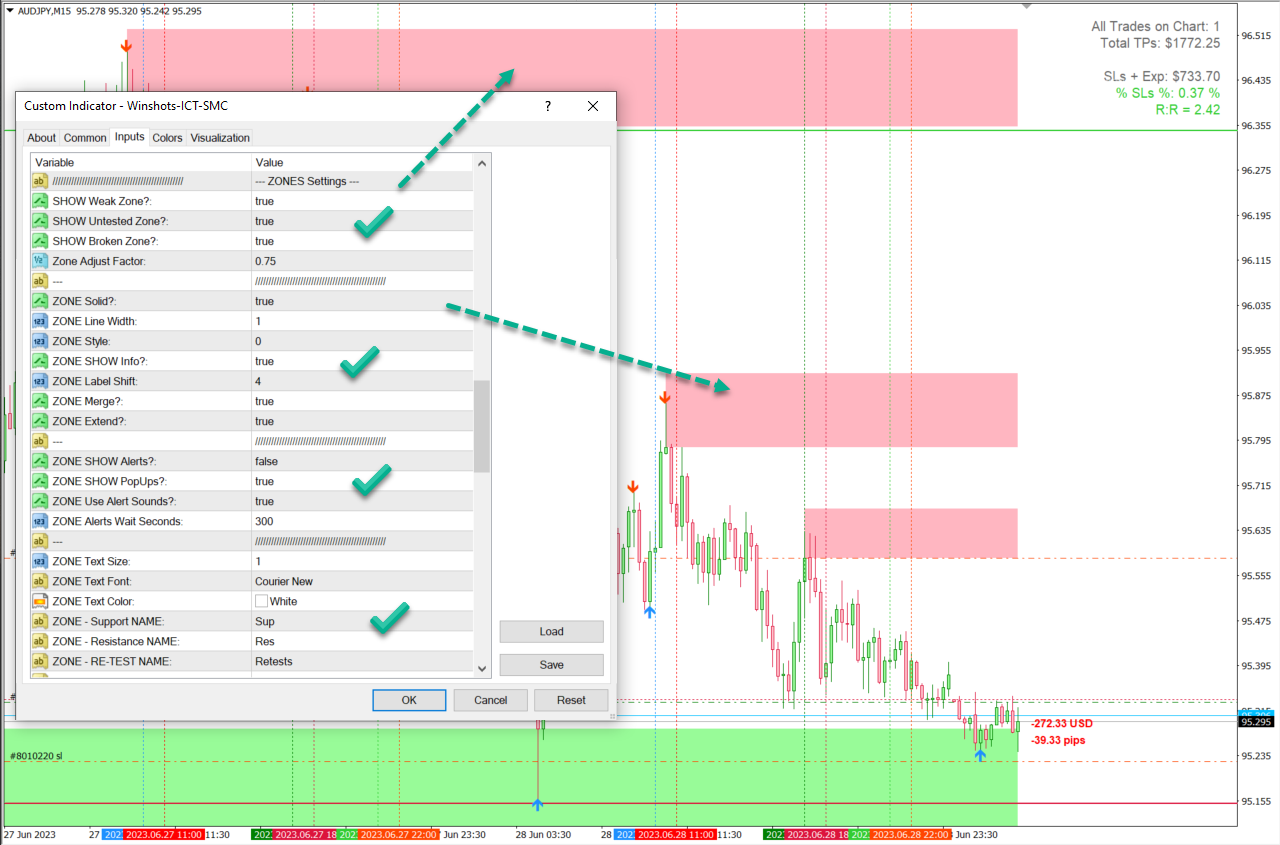
  • Bullish and bearish supply and demand zones which will help you identify FVG inside those time windows
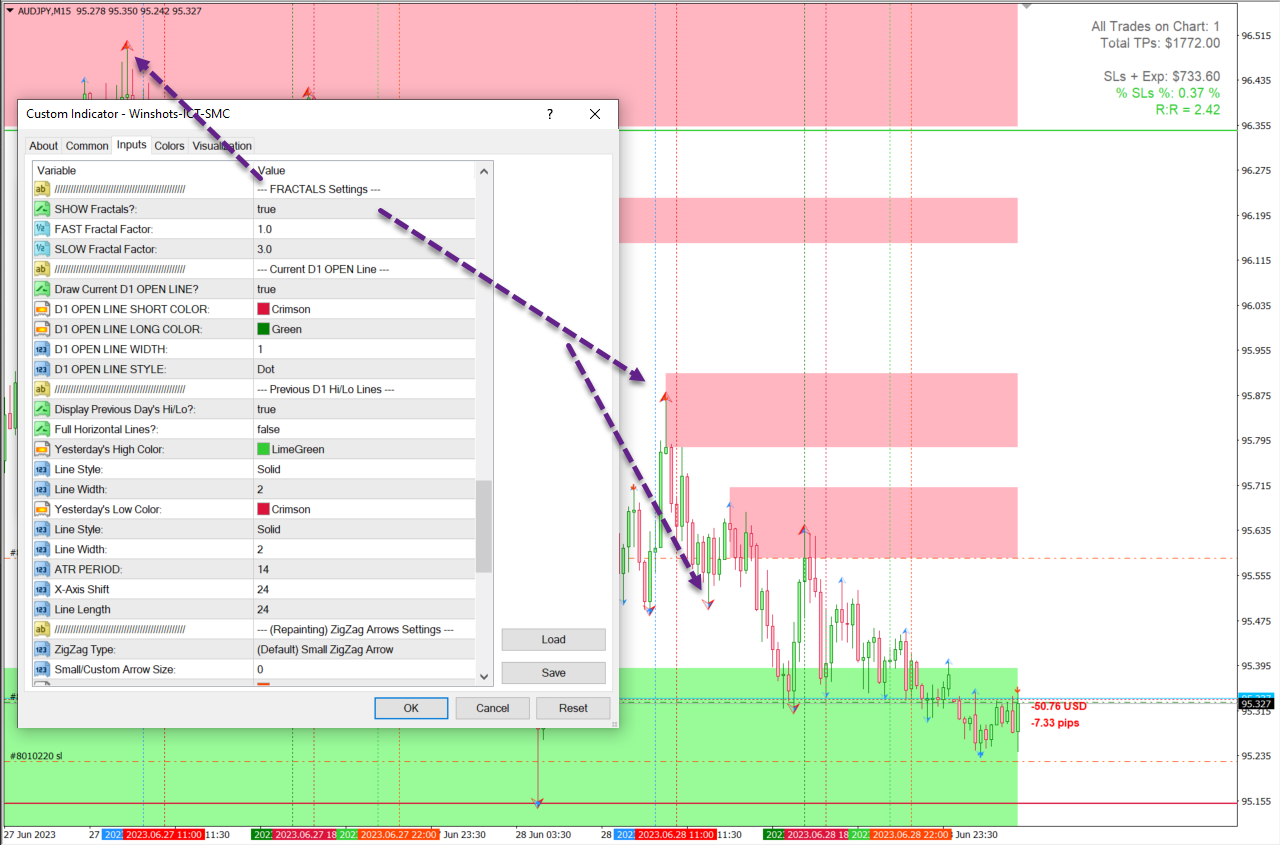
  • The previous day's high and low, draw on liquidity
  • The indicator does not plot the FVGs to avoid cluttering the chart 
  • Existing supply and demand zones will help you concentrate on what's important
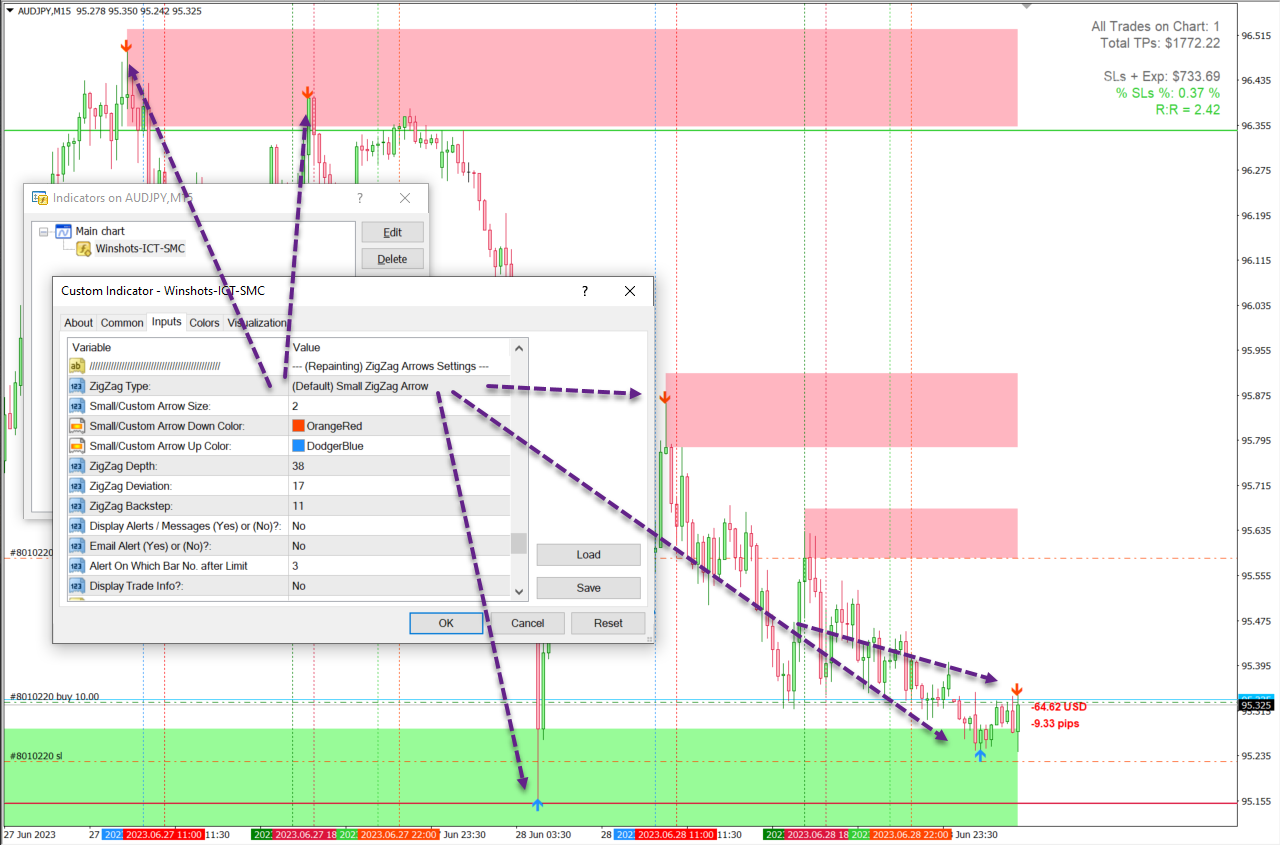
  • Repainting Zig-Zag arrows inside the silver bullet windows will give you suggestions when to go short or long but you still have to make the final determination yourself
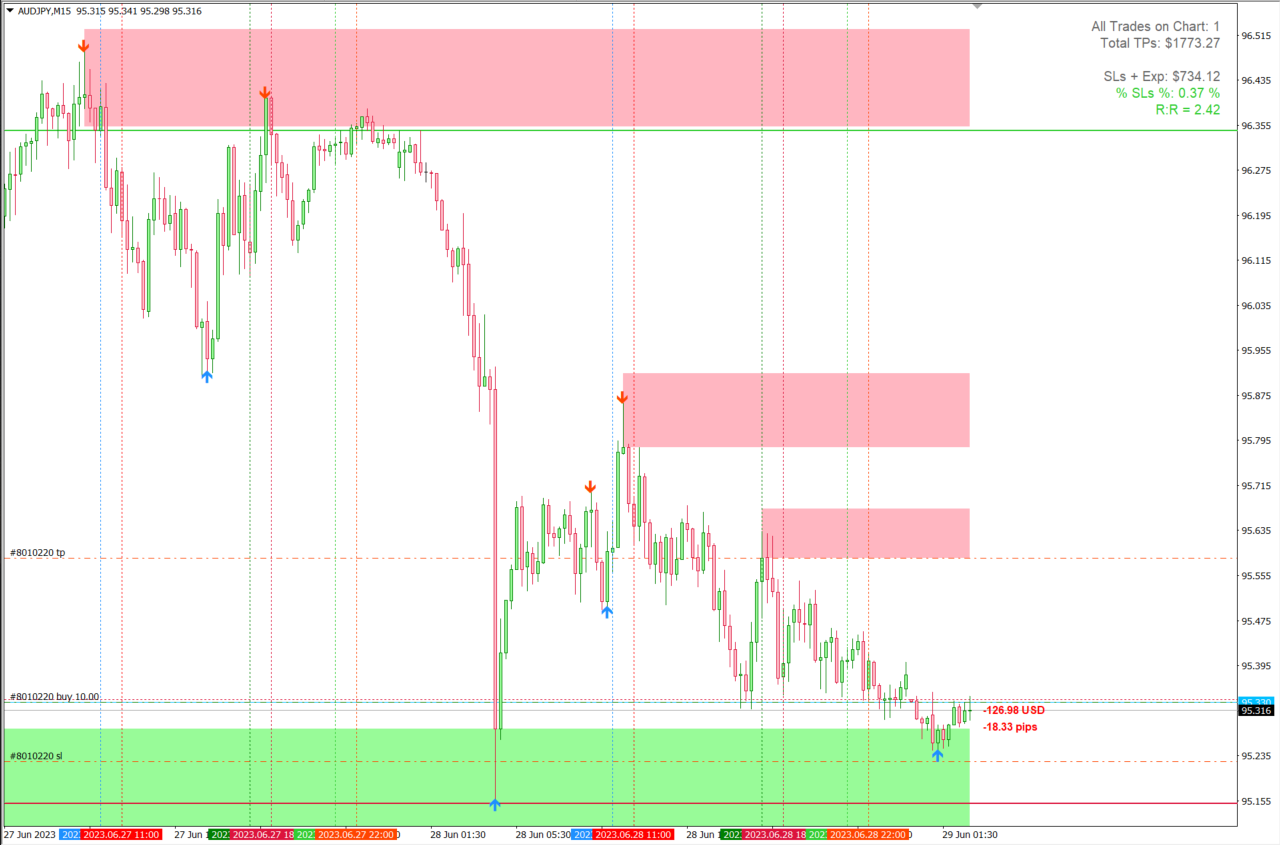
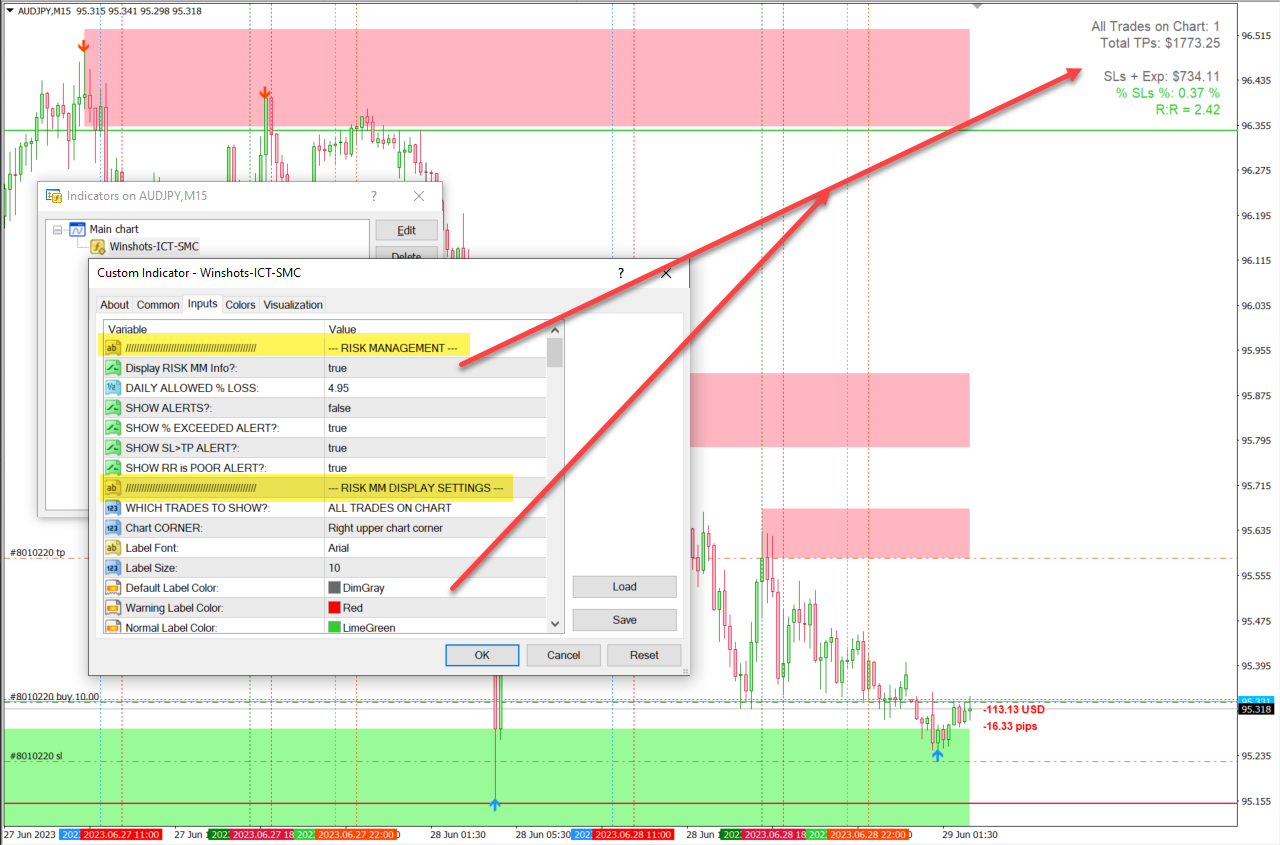
  • Built-in RISK MANAGEMENT feature will display your Risk to Reward (RRR) info based on the size of the trades you execute to ensure you're not over leveraging your account and that you're taking trades with a favourable RR
  • Optional large and small fractals can give you a heads up about potential price reversals or pullbacks
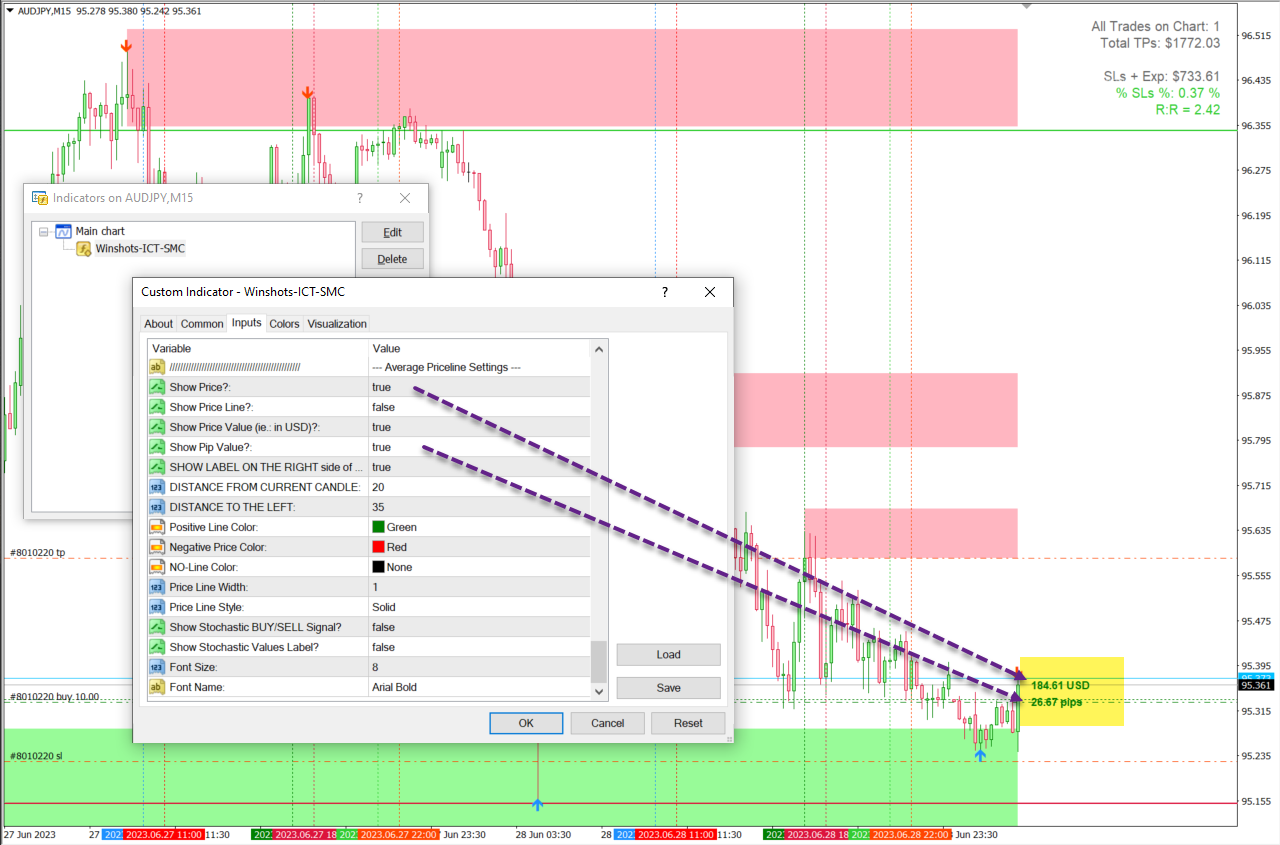
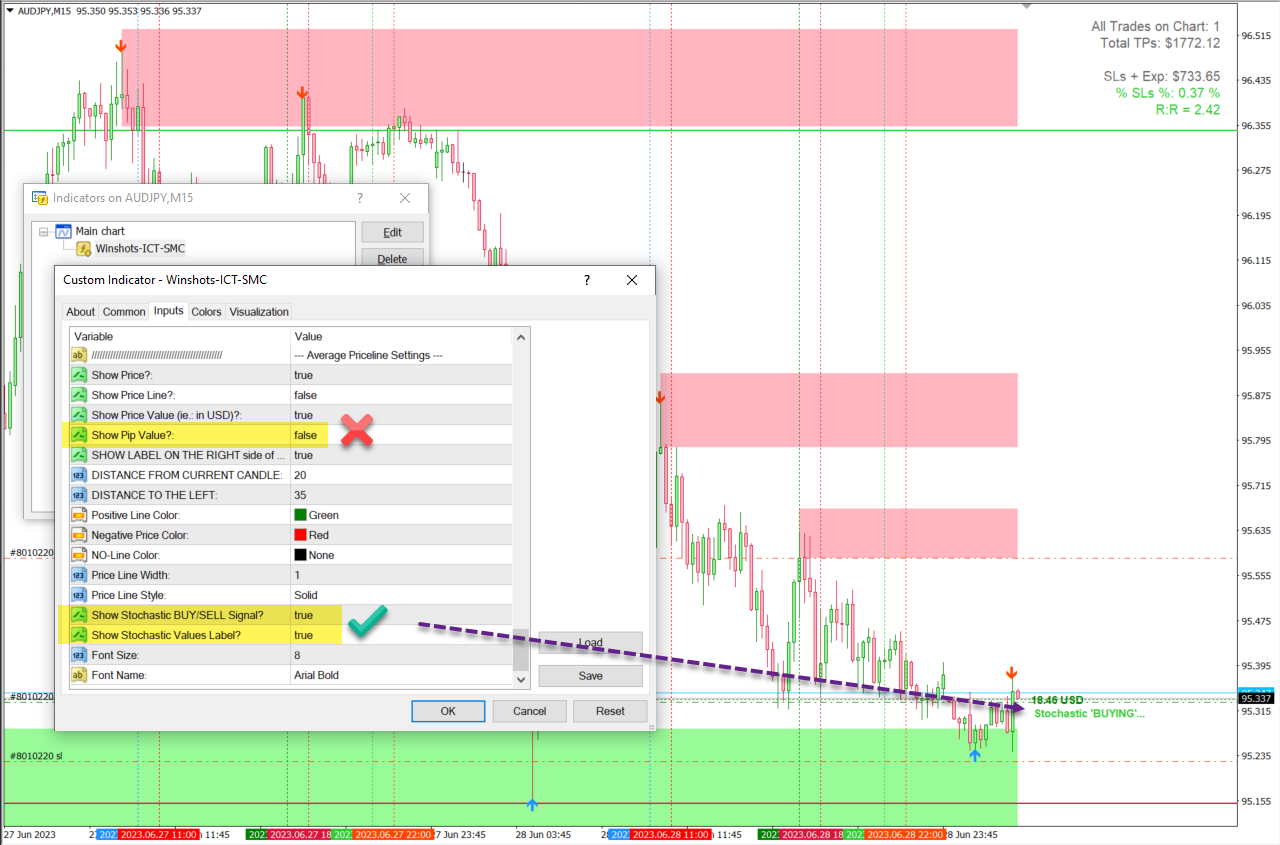
  • Optional display of the active trade(s) P-and-L helps you better monitor all your combined opened trades and their combined / current P&L (profit and loss; this relates to all open trades on the same chart)

Once the indicator is loaded, it will track all silver bullet window so that you can review previous sessions and practice your ICT SB strategy.

The indicator will plot all the supply and demand zones data on the current active window but you can choose to hide or disable the ones that do not interest you.

The indicator will post buy or sell signal in the form of Zig Zag based arrows however you have to keep in mind that those arrows do repaint so the final decision to take a trade rests with you. 

추천 제품
History Pattern Search
Yevhenii Levchenko
표시기는 현재 시세를 작성하여 과거 시세와 비교할 수 있으며 이를 바탕으로 가격 변동을 예측합니다. 표시기에는 원하는 날짜로 빠르게 이동할 수 있는 텍스트 필드가 있습니다. 옵션: 기호 - 표시기가 표시할 기호 선택. SymbolPeriod - 지표가 데이터를 가져올 기간 선택. IndicatorColor - 표시기 색상. HorisontalShift - 지시자가 그린 따옴표를 지정된 막대 수만큼 이동합니다. Inverse - true는 인용 부호를 반대로, false - 원래 보기를 반전합니다. ChartVerticalShiftStep - 차트를 수직으로 이동합니다(키보드의 위/아래 화살표). 다음은 날짜를 입력할 수 있는 텍스트 필드의 설정으로, '엔터'를 누르면 즉시 이동할 수 있습니다.
Noize Absorption Index MT4
Ekaterina Saltykova
5 (1)
Noize Absorption Index - is the manual trading system that measures the difference of pressure between bears forces and bulls forces. Green line - is a noize free index that showing curent situation. Zero value of index shows totally choppy/flat market.Values above zero level shows how powerfull bullish wave is and values below zero measures bearish forces.Up arrow appears on bearish market when it's ready to reverse, dn arrow appears on weak bullish market, as a result of reverse expectation. S
Owl smart levels
Sergey Ermolov
4.63 (54)
MT5 버전  |   FAQ Owl Smart Levels Indicator 는   Bill Williams 의 고급 프랙탈, 시장의 올바른 파동 구조를 구축하는 Valable ZigZag, 정확한 진입 수준을 표시하는 피보나치 수준과 같은 인기 있는 시장 분석 도구를 포함하는 하나의 지표 내에서 완전한 거래 시스템입니다. 시장과 이익을 취하는 장소로. 전략에 대한 자세한 설명 표시기 작업에 대한 지침 고문-거래 올빼미 도우미의 조수 개인 사용자 채팅 ->구입 후 나에게 쓰기,나는 개인 채팅에 당신을 추가하고 거기에 모든 보너스를 다운로드 할 수 있습니다 힘은 단순함에 있습니다! Owl Smart Levels   거래 시스템은 사용하기 매우 쉽기 때문에 전문가와 이제 막 시장을 연구하고 스스로 거래 전략을 선택하기 시작한 사람들 모두에게 적합합니다. 전략 및 지표에는 눈에 보이지 않는 비밀 공식 및 계산 방법이 없으며 모든 전략 지표는 공개되어 있습니다. Owl Smart Lev
Power Renko MT4
Pierce Vallieres
Power Renko is an indicator which plots Renko bricks underneath the chart using a histogram. You can select the brick size and the timeframe of the Renko bricks as well as whether or not to use the close price or the high/low price of the candles. Renko bricks are based on price alone, not time, therefor the Renko bricks will not be aligned with the chart's time. They are extremely useful for trend trading and many different strategies can be formed from them. Buffers are provided allowing you t
VR Cub
Vladimir Pastushak
VR Cub 은 고품질 진입점을 얻는 지표입니다. 이 지표는 수학적 계산을 용이하게 하고 포지션 진입점 검색을 단순화하기 위해 개발되었습니다. 지표가 작성된 거래 전략은 수년 동안 그 효율성을 입증해 왔습니다. 거래 전략의 단순성은 초보 거래자라도 성공적으로 거래할 수 있다는 큰 장점입니다. VR Cub은 포지션 개시 지점과 이익 실현 및 손절매 목표 수준을 계산하여 효율성과 사용 편의성을 크게 높입니다. 간단한 거래 규칙을 이해하려면 아래 전략을 사용한 거래 스크린샷을 살펴보세요. 설정, 세트 파일, 데모 버전, 지침, 문제 해결 등은 다음에서 얻을 수 있습니다. [블로그] 다음에서 리뷰를 읽거나 작성할 수 있습니다. [링크] 버전 [MetaTrader 5] 진입점 계산 규칙 포지션 개설 진입점을 계산하려면 VR Cub 도구를 마지막 최고점에서 마지막 최저점까지 늘려야 합니다. 첫 번째 지점이 두 번째 지점보다 빠른 경우, 거래자는 막대가 중간선 위에서 마감될 때까지 기다립
Blahtech Market Profile
Blahtech Limited
4.61 (18)
Was: $249  Now: $99   Market Profile defines a number of day types that can help the trader to determine market behaviour. A key feature is the Value Area, representing the range of price action where 70% of trading took place. Understanding the Value Area can give traders valuable insight into market direction and establish the higher odds trade. It is an excellent addition to any system you may be using. Blahtech Limited presents their Market Profile indicator for the MetaTrader community. Ins
KopierMaschine - локальный копировщик сделок между различными счетами MetaTrader 4 и MetaTrader 5 в любом направлении расположенных на одном компьютере с интуитивно понятным интерфейсом. Направления копирования: MT4 --> MT5 MT4 --> MT4 MT5 --> MT5 MT5 --> MT4 для копирования между терминалами MetaTrader 4 и MetaTrader   5 необходимо приобрести версию продукта KopierMaschine  для  MetaTrader   5 Особенности Программа работает в двух режимах Master и Slave На один подчиненный счет можно копирова
Forex Gump
Andrey Kozak
2.83 (6)
Forex Gump is a fully finished semi-automatic trading system. In the form of arrows, signals are displayed on the screen for opening and closing deals. All you need is to follow the instructions of the indicator. When the indicator shows a blue arrow, you need to open a buy order. When the indicator shows a red arrow, you need to open a sell order. Close orders when the indicator draws a yellow cross. In order to get the most effective result, we recommend using the timeframes H1, H4, D1. There
캔들의 종가를 예측하는 지표입니다. 지표는 주로 D1 차트에서 사용하기 위한 것이. 이 지표는 전통적인 외환 거래와 바이너리 옵션 거래 모두에 적합합니다. 지표는 독립형 거래 시스템으로 사용하거나 기존 거래 시스템에 추가로 사용할 수 있습니다. 이 표시기는 현재 양초를 분석하여 양초 본체 내부의 특정 강도 요인과 이전 양초의 매개변수를 계산합니다. 따라서 지표는 시장 움직임의 추가 방향과 현재 양초의 종가를 예측합니다. 이 방법 덕분에 지표는 단기 및 중장기 거래 모두에 적합합니다. 지표를 사용하면 시장 상황을 분석하는 동안 지표가 생성할 잠재적 신호의 수를 설정할 수 있습니다. 표시기 설정에는 이를 위한 특별한 매개변수가 있습니다. 또한 인디케이터는 새로운 신호에 대해 차트의 메시지 형태, 이메일 및 PUSH 알림 형태로 알릴 수 있습니다. 구매 후 저에게 꼭 써주세요! 나는 당신에게 지표와 거래에 대한 나의 추천을 줄 것입니다! 또한 보너스를 받으세요!
Trendiness Index
Libertas LLC
5 (3)
"The trend is your friend" is one of the best known sayings in investing, because capturing large trendy price movements can be extremely profitable. However, trading with the trend is often easier said than done, because many indicators are based on price reversals not trends. These aren't very effective at identifying trendy periods, or predicting whether trends will continue. We developed the Trendiness Index to help address this problem by indicating the strength and direction of price trend
Title : Market Bias Indicator - Oscillator-Based Trading Tool Introduction : Discover the potential of the "Market Bias Indicator," a revolutionary oscillator-based trading tool designed for precise market analysis. If you're in search of a robust alternative to traditional bias indicators, your quest ends here. Market Bias Indicator offers unparalleled accuracy in identifying market sentiment and is your gateway to confident trading decisions. Recommended Trading Pairs : Market Bias Indicator i
The Chaikin Oscillator is a technical indicator developed by Marc Chaikin that combines price and volume data to measure the accumulation and distribution of a financial instrument. It aims to identify potential buying and selling opportunities in the market. The Chaikin Oscillator is calculated by subtracting a 10-day exponential moving average of the Accumulation Distribution Line (ADL) from a 3-day exponential moving average of the ADL. Here's how to use the Chaikin Oscillator indicator in tr
Trend Catcher with Alert
Issam Kassas
4.8 (49)
트렌드 캐쳐: 알림 인디케이터와 함께 하는 트렌드 캐쳐 전략은 시장 트렌드와 잠재적인 진입 및 체크 포인트를 식별하는 데 도움이 되는 다목적 기술 분석 도구입니다. 이는 시장 상황에 적응하여 트렌드 방향을 명확하게 시각적으로 표현하는 동적 트렌드 캐쳐 전략을 제공합니다. 트레이더는 선호도와 위험 허용도에 맞게 매개변수를 사용자 정의할 수 있습니다. 이 인디케이터는 트렌드 식별을 지원하고 잠재적인 반전을 신호로 제공하며 트레일링 스탑 메커니즘으로 작동하며 실시간 경고를 제공하여 신속한 시장 대응을 돕습니다. 특징: - 트렌드 식별: 상승 트렌드와 하락 트렌드를 신호합니다. - 트렌드 반전: 양봉 색상이 상승에서 하락으로 변경되거나 그 반대의 경우 잠재적인 반전을 경고합니다. - 실시간 경고: 새로운 트렌드 식별을 위한 경고를 생성합니다. 추천사항: - 통화 및 페어: EURUSD, AUDUSD, XAUUSD 등... - 시간 프레임: H1. - 계정 유형: 모든 E
FREE
Quantum Currency Array Indicator
QUANTUM TRADING SOFTWARE LIMITED
This indicator has been developed to identify and display these trends quickly and easily, allowing you to see instantly, those currency pairs which are trending, and those which are not – and in all timeframes, with just one click. The 28 currency pairs are displayed as a fan as they sweep from strong to weak and back again, and this is why we call it the ‘currency array’. All 28 pairs are arrayed before you, giving an instant visual description of those pairs that are trending strongly, those
TWO PAIRS SQUARE HEDGE METER INDICATOR Try this brilliant 2 pairs square indicator It draws a square wave of the relation between your two inputs symbols when square wave indicates -1 then it is very great opportunity to SELL pair1 and BUY Pair2 when square wave indicates +1 then it is very great opportunity to BUY pair1 and SELL Pair2 the inputs are : 2 pairs of symbols         then index value : i use 20 for M30 charts ( you can try other values : 40/50 for M15 , : 30 for M30 , : 10 for H1 ,
Point61 Indicator
Evgeniy Machok
5 (1)
The Point61 indicator is the result of many years of monitoring of price behavior of currency pairs and metals. It is not a secret, that in times of uncertainty, traders are looking for possible levels of support and resistance - the point, where price should stop its movement. There are 2 possible scenarios at these points: 1. Reverse (correction) to the opposite direction; 2. Breakthrough to continue movement. Very often these points are used to set stop orders - TakeProfit or
Market Profile 3
Hussien Abdeltwab Hussien Ryad
4 (4)
Market Profile 3 MetaTrader 4 indicator  — is a classic Market Profile implementation that can show the price density over time, outlining the most important price levels, value area, and control value of a given trading session. This indicator can be attached to timeframes between M1 and D1 and will show the Market Profile for daily, weekly, monthly, or even intraday sessions. Lower timeframes offer higher precision. Higher timeframes are recommended for better visibility. It is also possible t
FREE
Matrixs
Andriy Sydoruk
Matrix is a Forex arrow indicator. Displays signals simply and clearly! The arrows show the direction of the transaction, and are colored accordingly, which can be seen in the screenshots. As you can see, trading with such an indicator is easy. I waited for an arrow to appear in the desired direction - I opened a deal. An arrow formed in the opposite direction - closed the deal. The indicator also displays the lines with the help of which the arrow signals are formed, taking into account the int
It will be the best tool for you to make a profit! Through unique algorithms You're going to see an amazing amount of right trading signals Make huge profits every day and realize more possibilities!   Like the car no money to buy it, the love of the girls dare not to pursue?Or the credit card bill is not paid, the rent does not have the extra money to settle?Or are you fed up with being bossed around by your boss and Hope to get more people's respect?Can't afford to buy the things you want ? wa
Heiken Ashi candle chart is an improved version of The Japanese candle chart, which can effectively filter the market "noise" of the Japanese candle chart. It is favored by many traders for its simplicity and intuition. For trend traders, the HA candle chart is a magic tool. Unlike the traditional Japanese candle chart, Heikenashi does not reflect the opening price, high price, low price and closing price of the market. Instead, Heikenashi calculates the value of a single K line in the dominant
Max LotSize
Luis Alberto Atuncar Sanchez
5 (2)
LotSize Indicator Discover the appropriate lot size to use in your trades based on the available margin. This indicator provides valuable information for risk management. If the indicator shows a value of 0, it means that your balance or available margin is insufficient for trading. It is important to maintain adequate margin levels for safe trading practices. This indicator is exclusively designed for the MT4 platform, a popular and reliable trading platform in the market. With the LotSize Indi
FREE
RiverScope Lite automatically determines the nearest most important price levels and support and resistance zones in history, it also identifies a large number of price action patterns (the lite version is limited to 10, while the full version has 30+). The support and resistance levels are determined based on an algorithm that calculates and filters the historical values of the price, its movement character, volumes, etc. It displays the current situation, therefore the nearest levels change in
Magic Balance
Daniil Evstratenko
The indicator shows which trading pairs, strategies, robots and signals that you use are profitable and which are not. The statistic of trades and balance graph are displayed in the account currency and pips - to switch simply click on the graph. button "$"(top left) - minimize/expand and move the indicator panel button ">"(bottom right) - stretching and resetting to the original size Statistic of trades 1 line - account balance, current profit and lot of open trades; 2 line - the number of al
Trend PA
Mikhail Nazarenko
5 (3)
The Trend PA indicator uses   Price Action   and its own filtering algorithm to determine the trend. This approach helps to accurately determine entry points and the current trend on any timeframe. The indicator uses its own algorithm for analyzing price changes and Price Action. Which gives you the advantage of recognizing, without delay, a new nascent trend with fewer false positives. Trend filtering conditions can be selected in the settings individually for your trading style. The indicator
Magic Filter MTF
Yaroslav Varankin
4 (1)
Magic Filter MTF is perfect for any strategy. you do not need to load the chart with extra indicators like this one indicator will replace all additional filters for you it can also be a great strategy. it combines well with trading at local minima and maximums (resistance levels) multi-timeframe-multi-currency indicator 4 screen system is used 4 rows of arrows UTB indicators adjusted for different periods when two arrows pointing in the same direction on the same timeframe coincide
Laguerre SuperTrend Clouds adds an Adaptive Laguerre averaging algorithm and alerts to the widely popular SuperTrend indicator. As the name suggests, Laguerre SuperTrend Clouds (LSC) is a trending indicator which works best in trendy (not choppy) markets. The SuperTrend is an extremely popular indicator for intraday and daily trading, and can be used on any timeframe. Incorporating Laguerre's equation to this can facilitate more robust trend detection and smoother filters. The LSC uses the impro
Market Shaver
Remi Passanello
시장 면도기   마켓 스캘퍼 이 표시기는 RPTrade Pro 솔루션 시스템의 일부입니다. Market Scalper는 Price Action, Dynamic Support 및 Resistance를 사용하는 일일 추세 지표입니다. 누구나 사용할 수 있도록 설계되었으며 거래의 절대 초보자도 사용할 수 있습니다. 다시 칠하지 마십시오. 표시는 닫기에서 닫기로 제공됩니다. 단독으로 사용하도록 설계되어 다른 표시기가 필요하지 않습니다. 명확하고 간단한 표시를 제공합니다. 어떻게 작동합니까 Market Shaver는 Dual TimeFrames 시스템을 사용하고 있습니다. 주요 추세는 더 높은 TF가 취하는 반면 더 빠른 것은 거래를 마감하는 데 사용됩니다. 거래는 하나씩 표시되며 동시에 두 거래가 없습니다. Market Shaver는 다음을 나타냅니다. 거래를 할 때 그것을 멈출 때, 이익 또는 손실. 무역 보상 올바른 기말 TF를 설정하는 데 도움이 되는 많은 통계 시장
Fibonacci retracement and extension line drawing tool Fibonacci retracement and extended line drawing tool for MT4 platform is suitable for traders who use  golden section trading Advantages: There is no extra line, no too long line, and it is easy to observe and find trading opportunities Trial version: https://www.mql5.com/zh/market/product/35884 Main functions: 1. Multiple groups of Fibonacci turns can be drawn directly, and the relationship between important turning points
This MT4 indicator has been designed to be used on any currency pair and any time frame . It has the scalper and swing trader in mind.  The indicator looks for short-term high-probability reversals in price and will indicate to you to go long (buy) or short (sell) if you see a green or red arrow next to the current candlestick respectively. The indicator provides the best trading opportunities to you during the active trading hours of London and New York, but it will continue to give signals all
The indicator displays the data of the Stochastic oscillator from a higher timeframe on the chart. The main and signal lines are displayed in a separate window. The stepped response is not smoothed. The indicator is useful for practicing "manual" forex trading strategies, which use the data from several screens with different timeframes of a single symbol. The indicator uses the settings that are identical to the standard ones, and a drop-down list for selecting the timeframe. Indicator Parame
이 제품의 구매자들이 또한 구매함
ON Trade Optuma Astro
Abdullah Alrai
5 (4)
물론입니다. 아래는 제공해주신 텍스트의 한국어 번역입니다: MT4용 천문학 지표 소개: 귀하의 최상급 하늘 트레이딩 동반자 트레이딩 경험을 천체의 높이로 끌어올리기 준비가 되셨나요? MT4용 천문학 지표를 소개합니다. 이 혁신적인 도구는 복잡한 알고리즘의 힘을 활용하여 탁월한 천문학적 통찰과 정밀한 계산을 제공합니다. 정보의 우주를 손에 담다: 천문학적 데이터의 보물함을 드러내는 포괄적인 패널을 살펴보세요. 행성의 지오/헬리오센트릭 좌표, 태양/지구 거리, 크기, 길이, 별자리, 황도 좌표 및 적도 좌표, 심지어 수평 좌표 등 각각이 정밀하게 계산되고 아름답게 제시됩니다. 지표에 의해 생성된 수직선은 시간 값에 해당하여 트레이딩 여정에 우주적인 시각을 부여합니다. 행성 라인과 관계: 수정 가능한 스케일과 각도로 차트를 장식하는 행성 라인의 마법을 경험해보세요. 직관적인 컨트롤 패널을 통해 각 행성의 라인의 가시성을 손쉽게 전환할 수 있습니다. 쥰션이나 섹스타일, 사분각, 삼분각, 트
ON Trade Waves Patterns Harmonic Elliot Wolfe를 소개합니다. 이는 수동 및 자동 방법을 사용하여 다양한 시장 패턴을 감지하기 위해 개발된 고급 지표입니다. 다음은 그 작동 방식입니다: 조화적 패턴: 이 지표는 차트에 나타나는 조화적 패턴을 식별할 수 있습니다. 이러한 패턴은 Scott Carney의 "Harmonic Trading vol 1 및 2"에서 설명한 것처럼 조화적 거래 이론을 연습하는 트레이더에게 중요합니다. 수동으로 그리든 자동 감지를 사용하든 ON Trade Waves Patterns가 도움을 줄 것입니다. 컨트롤 패널: 이 지표에는 사용자 친화적인 컨트롤 패널이 있습니다. 차트 및 시간 프레임 설정을 저장하여 다양한 구성 간에 쉽게 전환할 수 있습니다. 차트 공간을 최대화하려면 최소화할 수도 있습니다. 다른 분석 도구를 사용하는 것을 선호하는 경우 닫기 버튼을 클릭하여 모든 지표 데이터를 숨길 수 있습니다. 템플릿 저장: 설정을 사
TrendMaestro
Stefano Frisetti
5 (2)
note: this indicator is for METATRADER4, if you want the version for METATRADER5 this is the link:  https://www.mql5.com/it/market/product/108106 TRENDMAESTRO ver 2.4 TRENDMAESTRO recognizes a new TREND in the bud, he never makes mistakes. The certainty of identifying a new TREND is priceless. DESCRIPTION TRENDMAESTRO identifies a new TREND in the bud, this indicator examines the volatility, volumes and momentum to identify the moment in which there is an explosion of one or more of these data a
How to use Pair Trading Station Pair Trading Station is recommended for H1 time frame and you can use it for any currency pairs. To generate buy and sell signal, follow few steps below to apply Pair Trading Station to your MetaTrader terminal. When you load Pair Trading Station on your chart, Pair Trading station will assess available historical data in your MetaTrader platforms for each currency pair. On your chart, the amount of historical data available will be displayed for each currency pai
Smart Ai Levels
Aditya Jayswal
Smart Ai Levels  Accumulation & Distribution indicator Smart Ai Levels are Ai controlled indicator which is based on Wyckoff Price cycle theory . It automatically scans the Accumulation & Distribution phases on chart and Ai draws the possible areas before Mark up and Mark down which acts as hot zones and can be traded with confirmation to catch those big price movements . It's a great tool for both Reversal and Breakout Trades suitable to all Trading Styles such as Scalping - Intraday - Swing 
Introducing the South African Sniper indicator created by a small group of traders with a few years trading trading the financial market profitably . This is a plug and play indicator that provides you with  BUY and SELL (SNIPER ENTRY) signals with TARGET and trail stops. The indicator Works with all MT4 trading instruments. The indicator uses previous  chart data as receipt to speculate on future market moves.
PZ Harmonacci Patterns
PZ TRADING SLU
3.43 (7)
This is arguably the most complete harmonic price formation auto-recognition indicator you can find for the MetaTrader Platform. It detects 19 different patterns, takes fibonacci projections as seriously as you do, displays the Potential Reversal Zone (PRZ) and finds suitable stop-loss and take-profit levels. [ Installation Guide | Update Guide | Troubleshooting | FAQ | All Products ] It detects 19 different harmonic price formations It plots primary, derived and complementary Fibonacci pro
Shepherd Harmonic Pattern
Abdullah Alrai
4.68 (59)
이 지표는 수동 및 자동 방법으로 차트에 그려진 고조파 패턴을 감지합니다. 사용자 매뉴얼은 다음 링크에서 확인할 수 있습니다. 리뷰를 작성하고 문의하면 무료 버전으로 MT4에서 제품을 시도할 수 있습니다. Gartley 및 Nenstar 패턴을 감지하는 데 사용할 수 있습니다. https://www.mql5.com/en/market/product/30181 전체 MT4 버전을 구입하려면 다음에서 구입할 수 있습니다. https://www.mql5.com/en/market/product/15212 참고 사항 지표에는 제어 패널이 있으며 모든 (차트 및 시간대) 설정을 저장합니다. 차트에서 더 많은 공간을 확보하려면 최소화할 수 있으며, 다른 분석 도구로 작업하는 것이 선호되는 경우 모든 지표 데이터를 숨기려면 닫기 버튼을 누를 수 있습니다. 이 지표를 사용하고 설정을 변경하면 이동 평균 또는 볼린저 밴드와 같은 지표를 추가하면 자동으로 템플릿을 저장하고 필요할 때 언제든지 로드할 수
The BB Reversal Arrows technical trading system has been developed to predict reverse points for making retail decisions. The current market situation is analyzed by the indicator and structured for several criteria: the expectation of reversal moments, potential turning points, purchase and sale signals. The indicator does not contain excess information, has a visual understandable interface, allowing traders to make reasonable decisions. All arrows appear to close the candle, without redr
Indicator : RealValueIndicator Description : RealValueIndicator is a powerful tool designed specifically for trading on the EURUSD pair. This indicator analyzes all EUR and USD pairs, calculates their real currency strength values, and displays them as a single realistic value to give you a head start on price. This indicator will tell you moves before they happen if you use it right. RealValueIndicator allows you to get a quick and accurate overview of the EURUSD currency pair tops and bottoms,
Connect Indicator
Sukunthakan Ngernbamrung
Connect Indicator is a tool used for connecting indicators between the MQL market and MT4. The connected indicators are made by our group and can be used for other applications, such as sending messages to the Line application or Telegram application. If you have any questions, please don't hesitate to ask us to receive support. Function and indicator buffer Buffer one is the high price of the previous candle. Buffer two is the high price of the previous candle. Usage To connect indicators to fu
기적적인 외환 지표 소개: 정확한 트레이딩의 힘을 발휘하세요 모든 시간대에서 뛰어난 결과를 제공하는 최고의 외환 지표를 찾는데 지친 적이 있나요? 더 이상 찾을 필요가 없습니다! 기적적인 외환 지표가 도래하여 귀하의 트레이딩 경험을 혁신하고 수익을 새로운 고도로 끌어올립니다. 최첨단 기술과 수년간의 정성스런 개발을 토대로 기적적인 외환 지표는 외환 시장에서의 힘과 정확성의 정점으로 떠오릅니다. 이 탁월한 도구는 모든 수준의 트레이더의 요구를 충족시키고 지속적인 수익을 추구하는 데에서 비길 데 없는 우위를 제공하기 위해 설계되었습니다. 기적적인 외환 지표의 가장 큰 장점은 그 뛰어난 적응성에 있습니다. 당신이 데이 트레이더, 스윙 트레이더이든 장기 포지션을 선호하든, 이 지표는 모든 시간대에서 뛰어난 결과를 제공하기 위해 최적화되었습니다. 그러나 그 정확성과 시장의 복잡한 움직임을 포착하는 능력이 참으로 빛을 발하는 것은 1시간 기간대에서 사용할 때입니다. 기적적인 외환 지표의 정확성
Order Block Indicator MT4
Diego Arribas Lopez
5 (3)
[ MT5 Version ] Order Block Indicator MT4 Order Block Indicator MT4  is currently the most accurate and customizable indicator in the market. It has been developed to facilitate the analysis of operations based on Order Blocks and Supply and Demand Zones. These zones are possible reversal points of a movement. Order Blocks indicate a possible accumulation of orders in one area. The price usually gets to reach and react strongly to those areas. The most relevant levels for this reaction are the c
Graphic shapes
Alexandr Lapin
Graphic Shapes -using history, it projects four types of graphical shapes at the moment, allowing you to determine the main ranges of price movement in the future, as well as gives an understanding of the main market reversals, while giving entry points by priority!The panel contains three types of figure sizes expressed by timeframes. They allow you to conduct a complete market analysis without using additional tools! The indicator is a powerful tool for forecasting price movements in the forex
Weis Wave with Alert
Trade The Volume Waves Single Member P.C.
4.79 (19)
Rental/Lifetime Package Options and Privileges' * For optimum results the yearly or lifetime package is suggested due to live training and Discord  channel trading with the  creator! Rent Monthly Six Months   Yearly/Lifetime Weis Wave with Speed with Alert+Speed Index x x x Manual  x x x Quick Set up Video x x x Blog x x x Lifetime Updates x x x Setup and Training Material x x Free Rectangle Break Alert Tool      x Discord Access Channel "The SI traders" x 2-hour live methodology traini
Ultimate Sniper Dashboard
Hispraise Chinedum Abraham
4.84 (25)
299달러로 할인! 추후 가격이 인상될 수 있습니다! 아래 설명을 읽어보세요! Ultimate Sniper Dashboard를 위한 최고의 엔트리 시스템: ULTIMATE DYNAMIC LEVELS. (내 제품을 확인하십시오) Ultimate Sniper Dashboard는 MT4 다중 통화 테스트 제한으로 인해 라이브 시장에서만 작동합니다. Ultimate-Sniper 대시보드를 소개합니다! HA-Sniper와 MA-Sniper를 모두 포함하는 최고의 제품입니다. 그리고 많은 특수 모드. Ultimate Sniper Dashboard는 절대 야수입니다! 초보자 또는 전문가 트레이더를 위한 최고의 솔루션! 다시 움직임을 놓치지 마세요! 단순함과 핍을 좋아하는 트레이더를 위해 특별한 제품을 준비했습니다. 본질적으로 단순한 대시보드는 여러 사용자 지정 알고리즘을 기반으로 28개의 통화 쌍을 살펴보는 모든 작업을 수행합니다. 단 하나의 차트로 전문가처럼 시장을 읽을 수 있습니다. 움직이기
The "Easy Ichimoku Wave Meter" indicator is a basic tool to automatically determine Waves according to Ichimoku! The indicator gives the possibility to simultaneously apply the Wave Theory, Time Theory and Target Price Theory according to the "Little Ichimoku" strategy developed by Sense Hosoda on the MT4 platform.  The use of this tool allows not only novice traders to instantly (fully automatic) determine the waves and their rapid interpretation, it also allows to automatically measure the p
Volume by Price MT4
Brian Collard
4.71 (14)
The Volume by Price Indicator for MetaTrader 4 features Volume Profile and Market Profile TPO (Time Price Opportunity). Get valuable insights out of currencies, equities and commodities data. Gain an edge trading financial markets. Volume and TPO histogram bar and line charts. Volume Footprint charts. TPO letter and block marker charts including split structures. Versatile segmentation and compositing methods. Static, dynamic and flexible ranges with relative and/or absolute visualizations. Lay
PZ Day Trading
PZ TRADING SLU
3.67 (3)
This indicator detects price reversals in a zig-zag fashion, using only price action analysis and a donchian channel. It has been specifically designed for short-term trading, without repainting or backpainting at all. It is a fantastic tool for shrewd traders aiming to increase the timing of their operations. [ Installation Guide | Update Guide | Troubleshooting | FAQ | All Products ] Amazingly easy to trade It provides value on every timeframe It provides suitable SL and TP levels It impl
Chaos Indicator
Stefano Frisetti
DESCRIPTION The CHAOS INDICATOR has been developed to be used for the TRADING STRATEGY OF CHAOS, as described in the book. The book is in italian language only and can be obtained only on my website indicated below. DATAS COLLECTED AND SHOWN ON GRAPHS The CHAOS INDICATOR apply easily to any graph and any asset, and it is a TRADING FACILITATOR, as it identify immediately the following items on any graph: - The GP (= RIGHT PRICE) i.e. the price to which the asset should be attracted within 24
Gann Swing Structure
Kirill Borovskii
5 (1)
This indicator is based on the mathematics of the great trader W.D. Ganna. With its help, you can easily find strong levels by analyzing swings to find the optimal entry point. The indicator works on all instruments and all timeframes. The indicator is fully manual and has control buttons. All you need to do is press the NEW button, a segment will appear, which you can place on any movement, swing or even 1 candle that you want to analyze. By placing the segment, press the OK button. A grid (th
Please send me Direct message on MQL5 CHAT after purchasing the Indicator for Training and Installation Support There are some additional files that is important to use with the Indicator . So be sure to contact me after purchasing the Indicator So that I can add you for training and support . If you find any difficulty with installation then send me Direct message here So that I can connect with you via Anydesk or Teamview for the product installation. " Smart Order Block Indicator " to find
Gold Channel XAUUSD
Paulo Rocha
5 (2)
Gold Channel is a volatility-based indicator, developed with a specific timing algorithm for the XAUUSD pair, which consists of finding possible corrections in the market. This indicator shows two outer lines, an inner line (retracement line) and an arrow sign, where the theory of the channel is to help identify overbought and oversold conditions in the market. The market price will generally fall between the boundaries of the channel. If prices touch or move outside the channel it is a tra
PZ Swing Trading
PZ TRADING SLU
5 (4)
Swing Trading is the first indicator designed to detect swings in the direction of the trend and possible reversal swings. It uses the baseline swing trading approach, widely described in trading literature. The indicator studies several price and time vectors to track the aggregate trend direction and detects situations in which the market is oversold or overbought and ready to correct. [ Installation Guide | Update Guide | Troubleshooting | FAQ | All Products ] Profit for market swings with
Binary FX Ideal
Yaroslav Varankin
3.5 (2)
great tool for any trader for both Forex and binary options suitable for any trader no need to configure anything, everything has been perfected by time and experience The tool combines 5 indicators and 3 proprietary strategies works great during flats and trends It indicates a trend reversal at its very beginning, it works well with the trend Trading Recommendations The signal is formulated on the current candle You should enter the trade at the next Possible recount (rare)
Gann Zone Pro
Kirill Borovskii
This indicator identifies and displays zones, as it were areas of strength, where the price will unfold. The indicator can work on any chart, any instrument, at any timeframe. The indicator has two modes. The indicator is equipped with a control panel with buttons for convenience and split into two modes. Manual mode: To work with manual mode, you need to press the NEW button, a segment will appear. This segment is stretched over the movement and the LVL button is pressed. The level is displayed
NAM Order Blocks
NAM TECH GROUP, CORP.
5 (1)
MT4 Multi-timeframe Order Blocks detection indicator. Features - Fully customizable on chart control panel, provides complete interaction. - Hide and show control panel wherever you want. - Detect OBs on multiple timeframes. - Select OBs quantity to display. - Different OBs user interface. - Different filters on OBs. - OB proximity alert. - ADR High and Low lines. - Notification service (Screen alerts | Push notifications). Summary Order block is a market behavior that indicates order collection
Gann Price Level
Kirill Borovskii
The indicator is designed to work on any trading platform. The program is based on proprietary algorithms and W.D.Ganna's mathematics, allowing you to calculate target levels of price movement based on three points with the highest degree of certainty. It is a great tool for stock trading. The indicator has three buttons: NEW - call up a triangle for calculation. DEL - delete the selected triangle. DELS - completely remove all constructions. The probability of achieving the goals is more than 80
Full STO
Roman Smoroda
전체 STO 표시기 (프리미엄, 골드, 실버의 세 가지 STO 표시기의 모든 버전 포함)-안정적인 거래 옵션은 자동 바이너리 옵션 거래를 위해 설계되었습니다.  주의 깊게 읽기!!!!! 중요 하나의 터미널에서 만기가 다른 두 개의 템플릿, 즉 18:01, 18:02의 만기가 1 분에서 15 분인 템플릿과 10 분에서 20 분의 만기가 22:00 인 템플릿을 만듭니다. 승률: 지난 5년간 71% 자금 관리: 예치금에서 0.3 이 버전의 지표는 모스크바 시간 18:01, 18:02, 22:00 거래 전용으로 설정되며 실버 및 금의 경우 1에서 15까지, 프리미엄 버전의 경우 10에서 20 분까지 만료됩니다. 신호는 양초 내부에 나타나고 커넥터를 사용하면 양초 내부에 마크 개구부를 넣으면 즉시 거래를 시작합니다. 표시기가 완전히 구성되었으므로 직접 변경할 필요가 없습니다. 설치 및 거래 !!! 확인 및 테스트없이 지표를 구입하지 마십시오. 실제 계정에서
Target 5X Indicator
Ihab Salloum
5 (1)
The 5X target indicator is an indicator that plots the optimal entry zone and the target for the trading day. It also plots a level where the stoploss can be moved to breakeven for a risk free trade which is 2X. This indicator has time window inputs. The default settings are from 02:00 to 19:00 CET+1 time zone. This indicator is based used with a direction bias for the day. I post the direction bias for several pairs in the comments section. Added a new feature Time Zone to help trade the highes
제작자의 제품 더 보기
Stop searching for and trying new indicators! Get Winshots Massive FX Profits indicator and set yourself apart from the crowd.  Years of trading experience led us to the building of this all in one indicator! Trade like the pro with Winshots Massive FX Profits! This indicator uses the following methodologies to help you become a more consistent profitable trader: - MARKET VOLUME PROFILE - DAILY CANDLE OUTLINE  - ATR LEVELS - DAILY PIVOTS LEVELS - PRICE CYCLES ANALYSIS What is VOLUME P
Purpose: The function of this indicator is to draw 3 moving averages (MA's) lines on the main MT4 price chart.   The MA's are from 3 different timeframes specified by the user independent of the chart that is currently displayed. When you toggle your chart view through different time frames, the 3 MA's will continue to display the MA lines for the time frames specified in the properties. Example: The default settings map out three 50 bars MA's for H4, D1 and W1 time frames. During intraday tradi
FREE
Winshots Color PSAR
Pawel Michalowski
The parabolic stop and reverse (PSAR) indicator was developed by J. Welles Wilder, Jr. as a tool to find price reversals which can be utilized as stop-loss levels as well as trade triggers. The notable difference about the PSAR indicator is the utilization of time decay. The PSAR indicator forms a parabola composed of small dots that are either above or below the trading price. When the parabola is below the stock price, it acts as a   support   and trail-stop area, while indicating bullish up t
FREE
Winshots ADX Trend
Pawel Michalowski
5 (1)
Trading in the direction of a strong trend reduces risk and increases profit potential. In general the average directional index (ADX) is used to determine when the price is trending strongly. In many cases, it is the ultimate trend indicator! After all, the trend may be your friend, but it sure helps to know who your friends are.  ADX is used to quantify trend strength. ADX calculations are based on a moving average of price range expansion over a given period of time. The default setting is
What is a Pivot? A pivot is a significant price level known in advance which traders view as important and may make trading decisions around that level. As a technical indicator, a pivot price is similar to a resistance or support level. If the pivot level is exceeded, the price is expected to continue in that direction. Or the price could reverse at or near that level. What does a Pivot Tell You? There are pivots and pivot points. These terms may mean different things to different people
Winshots ADX Trend Scanner
Pawel Michalowski
5 (1)
Trading in the direction of a strong trend reduces risk and increases profit potential. In general the average directional index (ADX) is used to determine when the price is trending strongly. In many cases, it is the ultimate trend indicator! After all, the trend may be your friend, but it sure helps to know who your friends are.  ADX is used to quantify trend strength. ADX calculations are based on a moving average of price range expansion over a given period of time. The default setting is
The Qualitative Quantitative Estimation (QQE) indicator is a technical analysis tool developed for the MetaTrader 4 (MT4) trading platform. It is designed to help traders identify potential trend reversals and to determine the strength of a current trend. The QQE indicator is calculated based on the Relative Strength Index (RSI) and Moving Average (MA) indicators. The RSI is used to determine the momentum of price movements, while the MA is used to smooth out the price data and identify trends.
Winshots Trade Assistant EA decides when to take the the first trade based on the H1 time frame and the Stochastic indicator.  It is there to assist you in deciding in which direction you should trade as well as managing all the trades you open on the same chart (it's very useful in scalping on lower time frames).  The first trade will always be 1 micro lot, and decision always based on the H1 time frame.  Then your job is to open further trades in the same direction as top ups MANUALLY. However
필터:
리뷰 없음
리뷰 답변
버전 1.2 2024.03.18
In this version:
- bug fixes, and finetuning for better performance!
버전 1.1 2023.11.07
* Improved accuracy of the supply and demand zones
* fixed few small refresh issues
* increased the number of bars used for calculations