MetaTrader 5용 유료 기술 지표 - 34
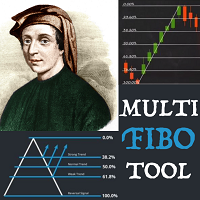
Multi Fibonacci Tool for MT5. User can set up to 5 different Fibonacci Retracements. Save & Load.
Simple settings. Style, line width, colors. Available ray function for all.
Application creates simple and functional panel on the chart (5 buttons for 5 Fibo retracements and DEL button to clear chart from drawn retracements).
Position Point and Range inputs allow to place Fibonacci retracements in the right place on the chart.

You can change the time period of the chart at the touch of a button. You can also change multiple charts at the touch of a button. You can also change multiple charts at the touch of a button, saving you the trouble of changing time periods.
We are live-streaming the actual operation of the system. Please check for yourself if it is usable. Please check it out for yourself. https://www.youtube.com/@ganesha_forex
We do not guarantee your investment results. Investments should be made at y
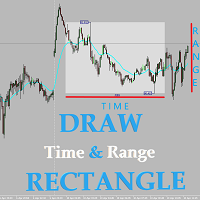
This useful tool helps to draw rectangle - range of price between two points of time for many days. For all trading instruments.
User set start time (Start Hour, Start Min), end time (End Hour, End Min) and number of days to draw a rectangle. Indicator draw a rectangle marking highest and lowest price in set period of time. Below the rectangle it shows range between MAXprice and MINprice in pp.
This tool is almost irreplaceable when you play strategy based on overnight price move (for example
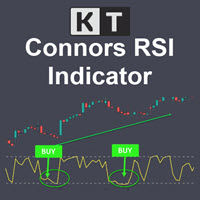
KT Connors RSI is a modified and more advanced version of the original Connors RSI developed by Larry Connors. It was designed to help traders generate trade signals based on short-term price movements.
The Connors combine the standard RSI calculation with two additional elements: a short-term RSI, ROC, and a moving average.
Features Provides more transparent and more actionable buy and sell signals using the overbought/oversold zones. Incorporates short-term RSI and moving average, provid

AutoScroll automatically scrolls the chart by the set width (pips). You can see the next milestone without having to operate the chart yourself. You can concentrate on trading.
We are live-streaming the actual operation of the system. Please check for yourself if it is usable. Please check it out for yourself. https://www.youtube.com/@ganesha_forex
We do not guarantee your investment results. Investments should be made at your own risk. We sharll not be liable for any disadvantage or damage

The time until the end of the bar is counted down. Therefore, you can time your order while watching the chart. You can concentrate on your trading.
We are live-streaming the actual operation of the system. Please check for yourself if it is usable. Please check it out for yourself. https://www.youtube.com/@ganesha_forex
We do not guarantee your investment results. Investments should be made at your own risk. We sharll not be liable for any disadvantage or damage caused by the use of the in

Fibonacci automatically draws Fibonacci retracement, Because Fibonacci automatically draws Fibonacci retracement, you can know at a glance the price to buy at a push or sell back. Therefore, you can trade in favorable conditions in a trending market.
We are live-streaming the actual operation of the system. Please check for yourself if it is usable. Please check it out for yourself. https://www.youtube.com/@ganesha_forex
We do not guarantee your investment results. Investments should be mad

The system automatically draws resistance and support lines, The system automatically draws resistance and support lines, so you can see at a glance the price range where you are most likely to encounter resistance. Therefore, you can trade in price zones where you are less likely to encounter resistance.
We are live-streaming the actual operation of the system. Please check for yourself if it is usable. Please check it out for yourself. https://www.youtube.com/@ganesha_forex
We do not guar

RSIScalperPro를 소개합니다 - 메타트레이더 5용 RSI 기반의 혁신적인 인디케이터로, 1분 차트에서의 스캘핑에 최적화되어 있습니다! RSIScalperPro를 사용하면 정확한 진입 및 청산 신호를 제공하는 강력한 도구를 손에 넣을 수 있습니다. RSIScalperPro는 서로 다른 두 가지 RSI 지표를 사용하여 과매수 및 과매도 레벨에 대한 명확한 신호를 제공합니다. 2개의 RSI의 시간 프레임 및 제한 값을 원하는 대로 조정하여 트레이딩 전략에 최적화된 결과를 얻을 수 있습니다. 차트 상의 개별 화살표는 거래 진입 및 청산 타이밍을 쉽게 파악하는 데 도움이 됩니다. 또한 RSIScalperPro의 특징 중 하나는 사용자 정의 가능한 3개의 이동 평균선입니다. 이를 통해 트렌드의 방향을 판단하고 강력한 거래 신호를 확인하는 데 도움이 됩니다. 이를 통해 조기에 트렌드를 감지하고 수익성 높은 거래에 참여할 수 있습니다. 뿐만 아니라 RSIScalperPro는 새로운 거래

The TrendLinePro indicator for MetaTrader 5 creates a trend line based on the last candle highs and lows. The number of candles to be used to determine the direction can be selected yourself. The trend line can also be used to set an SL. Changes in trend directions can optionally be displayed with an arrow. Input Parameters: Number of Candles for Distance: 3 Display Direction Changes Arrows: false

DYJ 슈퍼 트렌드파는 매우 정확한 봉우리와 파도 밸리 거래 시스템이다.
이 지표는 시장에 진출할 때 촛불선의 최고점과 최저점을 찾는다.
신호의 알림 유형이 dyj supertrend 에 추가되었습니다.
다중 공간 신호를 생성할 때,
Alert mailSend, MobilePush 등의 유형의 알림 신호를 사용할 수 있습니다.
Input InpSignalPeriod = 10
BarDistance = 24
InpIsAlert = true
=============================
DYJ Super Trend Wave ist ein hochpräzises Handelssystem.
Dieser Indikator sucht nach den höchsten und niedrigsten Punkten der Kerzenlinien, wenn sie in den Markt gehen.
Der Benachrichtigungstyp für das

Slopes are an increasingly key concept in Technical Analysis. The most basic type is to calculate them on the prices, but also on technical indicators such as moving averages and the RSI.
In technical analysis, you generally use the RSI to detect imminent reversal moves within a range. In the case of the Blue indicator, we are calculating the slope of the market price and then calculating the RSI of that slope in order to detect instances of reversal.
The Blue indicator is therefore used

If you are using naked eyes to find candlestick patterns on your chart it's a good thing but it requires your time and attention and still you miss some patterns here and there. Don't worry! This indicator will help you to find "Harami Candlestick Pattern" on your chart very easily. *Note: Default inputs are set for EURUSD H1 (1 hour) timeframe. This is an alert system which gives you alerts whenever harami candlestick pattern happens. Types of alerts it can give you are: 1. Audible Alerts - Thi

Intelligent ZigZag indicator.
It has only two settings. The higher the values, the more significant extreme values it shows.
Application area.
To determine the trend. Line drawing direction.
To recognize multiple patterns.
If you put two indicators on one chart with fast and slow values. By changing the color of one of them, you can very well decompose the price movement into waves.
The indicator can be a great helper for marking the chart and identifying the key levels from which t
Add an image or logo on a chart. Parameters: "File name for On mode" - location of image file depending MQL5 folder. "Background object" - set the logo as a background object. “x”, “y” – coordinates on the chart, from which the logo shows. If you want to delete the logo, just remove ea from the chart. The suggested resolution for the image is 200x200 pixels. You can use this ea while recording a video.

Versus USD 계산기는 USD 대비 주요 통화의 가격 변동을 계산하고, 차트의 현재 시간대의 커서 에 의해 인덱싱된 각 기간 또는 바에 대한 성과를 명확하고 비교적인 관점에서 표시합니다. 또한, 다른 통화와 비교하여 해당 통화가 USD 대비 최고 또는 최저 환율 변동을 경험한 바/기간에 화살표 를 표시하여 통화의 성과를 더욱 정확하게 측정합니다. 미국 달러는 국제 거래에서 가장 유동성이 높고 널리 사용되는 통화이므로 외환 시장에서 각 주요 통화의 성과를 측정하는 데 사용되는 기본 통화입니다. 게다가 대부분의 외환 거래는 미국 달러를 기초 또는 견적 통화로 사용하기 때문에 다른 통화의 성과를 비교하고 평가하기가 더욱 쉽습니다. 외환 거래에 대한 경험 수준과 거래 스타일에 관계없이 이미 수익을 창출하는 전략이 있든 없든 이 지표는 단기간 내에 여러분의 기술을 향상시킬 수 있습니다. 또한, 다음과 같은 기능으로 사용하기 쉽습니다: 28개의 주요 통화 쌍 모두와
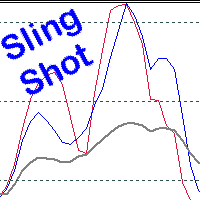
Scalping, Mean reversion or Position trading strategy
Get into an established trend on a pullback in the market. Use the Pinch in the indicator for profit taking. Use the Pinch as a mean reversion strategy, scalping back to a moving average line.
Input Parameters Fast Sling Shot configuration. Slow Sling Shot configuration. Dual Sling Shot configuration. Price line configuration. Trigger zones or levels. Example of Sling Shot trade idea: Price line sets the mood, below the baseline level (5
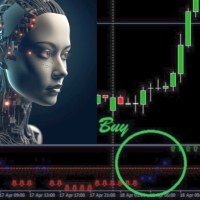
Introducing Trend Fusion 444F, a powerful MQL4 indicator designed to determine market direction using multiple trading indicators. This comprehensive tool offers a unique fusion of technical analysis techniques that help traders make informed decisions in various market conditions. Key Features: Comprehensive Analysis: Trend Fusion 444F combines several widely-used trading indicators to provide a multi-dimensional view of the market. The indicators include Moving Averages, MACD, RSI, DeMarker,

INTRODUCTION The Fib Autotrendline is a basic tool that analysts use to find out when a security's trend is reversing. By determining the support and resistance areas , it helps to identify significant changes in price while filtering out short-term fluctuations, thus eliminating the noise of everyday market conditions. It is an excellent tool for any trader who follows indicators that use swing highs and swing lows . How to Use the fib Auto Trendline Indicator The Fib Auto Trendline

Supply and Demand Indicator + FREE Currency Strength Meter ADD-ON Looking for a powerful tool that can help you identify the most reactive zones in the forex market? Our supply and demand indicator for MetaTrader 4 and 5 is exactly what you need. With its advanced algorithms and real-time analysis, this indicator helps traders of all experience levels make informed trading decisions. The supply and demand indicator is a cutting-edge tool that helps traders identify areas where buyers and sellers
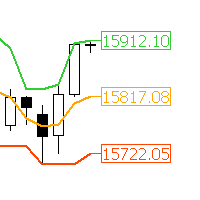
"AV Donchian Channel MT5" is an indicator for MetaTrader 5, which shows the current prices of the donchian channels and the middle line.
Multiple AV Donchian Channel indicators can be placed on one chart. The center line can be used for trailing.
See also Richard Dennis Turtle Trader strategy.
Settings:
- Donchian Channel Period
- Colors and widths of the lines
- Colors and widths of price labels
Please report bugs to me.

A pivot point is an intraday technical indicator used to identify trends and reversals mainly in equities, commodities, and forex markets . Pivot points are calculated to determine levels in which the sentiment of the market could change from bullish to bearish, and vice-versa.
the swing daily is an advanced pivot points indicator that grants the user control over many aspects of the trading levels that you'll get familiar with in the controls section it's used mainly to locate intraday

The best instrument for scalping. It allows you to always be correctly positioned in the price. It's a simple and extraordinarily powerful visual reference. Very suitable for price action. It consists of four components. 1. Fork. There are two levels that surround the price and mark the rebound points. They can be varied independently with 4 associated controls, two for each level. Its amplitude is indicated in pips in the indicator data. The minimum fork is updated with each tick. It has
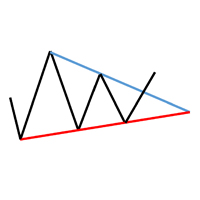
The TrianglesPro indicator for MetaTrader5 draws triangles on the chart based on the local highs and lows. The length of the trendlines can be limited. Optionally, you can display the highs and lows that are used to determine the triangles. It is also possible to determine how far back the identification of triangles should start. Also check out my other indicators.
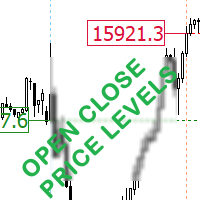
This indicator displays the open and closing price for the selected number of days. Easily identify market open and close Gaps. Select the Day icon to show the open and closing price line. Select the Time icon to show the open and closing hours. Indices and stocks are not a 24hour market as shown on MT5 charts, they open and close at specific times. Marketplace
Time Zone
Trading Hours
New York Stock Exchange (NYSE)
EDT
9:30 a.m. to 4:00 p.m.
Nasdaq Stock Market
EDT
9:30 a.m. to 4
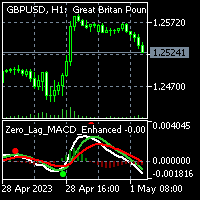
To get access to MT4 version please click here . This is the exact conversion from TradingView: "Zero Lag MACD Enhanced - Version 1.2" by " Albert.Callisto ". This is a light-load processing and non-repaint indicator. All input options are available. Buffers are available for processing in EAs. You can message in private chat for further changes you need. Thanks

The fate of a trade depends on knowing the direction of the price trend. Whatever style you trade, you must know that the direction of the main market trend is in the hands of buyers or sell
YZD Trend indicator helps you to find the main direction by using mathematical parameters and ATR This indicator is a good supplement for your strategy, especially price action, which can reduce your trade losses.
How to use: YZD Trend indicator consists of two ranges in the form of bands, when th

Indicator introduction: A channel and trend line indicator, which is a good tool for manual trading, and also can be used for creating new EAs, without drifting or repainting. It applies to any timeframes and any symbols. The work of the indicator is shown in the screenshots. For any novice and programming trading friend, you can write the signal into the EA to play freely, buffer 0 corresponds to the bold trend line, buffer 4 and 5 respectively corresponds to the channel's upper and lower f
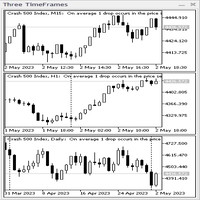
3개의 TimeFrames 표시기 패널. 인디케이터는 CAppDialog 클래스를 기반으로 패널 형태로 제작됩니다. 패널은 최소화하거나 마우스를 사용하여 현재 차트 주위로 이동할 수 있습니다. 표시기는 패널에서 현재 기호의 세 가지 기간을 보여줍니다. 현재 버전에서 표시기에는 최소 설정 수가 있습니다. 이들은 "젊은 기간", " 중간 기간 "및 " 이전 기간 " 의 세 가지 기간 매개 변수입니다 . 표시기 패널이 시작되면 현재 차트의 모든 속성을 자동으로 복사하여 세 가지 기간(예: 배경색, 막대 색, 그리드, 기간 구분 기호, 거래량...)에 적용합니다. 그러나 지표 패널은 세 가지 기간 동안 Expert Advisors 및 기타 지표를 복사하지 않습니다. 현재 차트의 속성을 변경한 경우 세 가지 시간대의 변경 사항은 지표 패널을 삭제하고 다시 부착한 후 또는 현재 차트의 시간대를 전환한 후에만 적용됩니다. 지표의 적용. 수동 거래의 조수로 추천 -

Nadaraya-Watson Envelope Indicator convert to MT5 Nadaraya Watson Envelope Indicator is one of the monst popular indicator in TradingView. TradingView(Chrome, Edge) eats a huge of CPU, so I convert this to MT5 version.
As you can see the screenshot, it's good with Schaff trend RSI Indicator (or others) If you want to get Schaff trend RSI Indicator , Link: https://www.mql5.com/en/market/product/98011
Window Size - determines the window size for calculating smoothed values. A larger window

There are many linear regression indicators out there, most of them draw lines or channels, but this one actually draws a chart. The beauty of the indicator like Heiken Ashi is it removes a lot of market noise. 4 (OHLC) arrays are filled with Linear Regression(LR) values of each price for the LR period (default=14). The period of the Linear Regression is adjustable dependant on the market conditions. The SMA (default=14) also has period adjustment. Candles are generated with Green for 'Up' cand
Schaff trend RSI indicator (It is related with EMA and RSI) It is suited for sub-Indicator to undertand trend(or direction change)
As you can see the screenshot, it's good with Nagaraya-Watson Envelope Indicator (or others) I am using this indicator as Screenshot setting. (Schaff value is default value. 23, 50, 9, close) If you want to get Nagaraya-Watson Envelope, Link: https://www.mql5.com/ko/market/product/97965

The Super Trend is one of the best trend-following indicator for MT5 platforms. It's working fine for real-time trend alerts and accurate signals and it help to identify the best market entry and exit positions. This indicator is the tool you can refers to a trend following overlays. It contains two major parameters: the period and the multiplier. Besides, traders should consider default values that include 10 for every true range aтd 3 for the multiplier. 2 Types TP SL you set in input Point
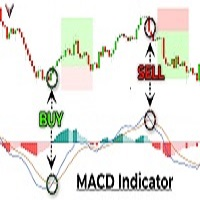
The MACD Gold Scalping Indicator is a powerful tool designed to help traders like you extract profits from the gold market. This indicator is based on the popular Moving Average Convergence Divergence (MACD) indicator, but it's been customized specifically for trading gold. When you use this indicator, you'll be able to quickly identify key entry and exit points in the gold market. It uses a combination of trend analysis, momentum indicators, and support and resistance levels to generate highly

The Off Trend MT5 Forex Indicator is a trend-following tool. Its signals are presented in the cloud. When the cloud is green, the trend momentum is bullish, and traders should take buy opportunities. Conversely, the trend momentum is bearish when the cloud is pink, and traders should take sell opportunities. The Off Trend mt5 Forex Indicator fits all timeframes and mt4 currency pairs.
Introducing our groundbreaking Forex indicator, specifically designed to help traders master the art of identifying critical support and resistance zones, as well as double top and double bottom patterns with unprecedented accuracy. Say goodbye to guesswork and hello to a powerful tool that will revolutionize your trading experience. Our proprietary indicator leverages cutting-edge technology to recognize key price levels where buying and selling pressures are poised to shift the market dynamics
--- StudentK RVI --- 1. Advanced strategy based on RVI 2. EA adapted (especially for StudentK's EA)
--- Context --- StudentK is not indicated as a master or K Sir for knowledgeable person who claims for winning all the time. (But lots of traders should know the fact that it is rarely truth, especially in fluctuated period of time)
StudentK is a group of years-experienced traders who want to share amazing tools in Free and Paid versions. Aiming helping people getting out of "The Rat Race" by
--- StudentK CCI --- 1. Advanced strategy based on CCI 2. EA adapted (especially for StudentK's EA)
--- Context --- StudentK is not indicated as a master or K Sir for knowledgeable person who claims for winning all the time. (But lots of traders should know the fact that it is rarely truth, especially in fluctuated period of time)
StudentK is a group of years-experienced traders who want to share amazing tools in Free and Paid versions. Aiming helping people getting out of "The Rat Race" by
--- StudentK MACD --- 1. Advanced strategy based on MACD 2. EA adapted (especially for StudentK's EA)
--- Context --- StudentK is not indicated as a master or K Sir for knowledgeable person who claims for winning all the time. (But lots of traders should know the fact that it is rarely truth, especially in fluctuated period of time)
StudentK is a group of years-experienced traders who want to share amazing tools in Free and Paid versions. Aiming helping people getting out of "The Rat Race"
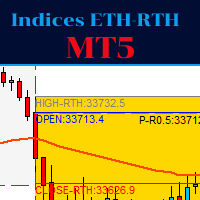
This indicator is for trading indices.
The RTH sessions (regular trading hours) where the underlying cash market is open are distinguished from ETH: for example for the American indices from 9:30 to 16:15 East Coast (New York) time, while for the Dax from 09:00 to 17:35 CET.
For the ETH session (outside RTH) the Fibonacci levels are plotted, as well as sensitive levels such as 25,50,75% retracement from the minimums and maximums.
Also for the RTH session the Fibonacci levels are graphed,
JPYTraderSR is a simple support and resistance indicator with Fibonacci retracement and extension levels added to provide even more trade signal confluence. It provides extra confirmations by indicating support and resistance levels shaping the market structure at any given time, in relation to harmonic trade concepts facilitated by Fibonacci ratios. The JPYTrader Expert Advisor (v1.0) utilizes an older version of this indicator (v1.0), which in turn leads to fairly accurate price action retrace

Market Viewer gives a quick glance on correlation and direction. This indicator takes a list of symbols (max 8) Leave a symbol setting empty if you wish not to use that many - like in the defaults… It will check for each timeframe (Monthly, Weekly, Daily, H4, H1, 30min, 15min, 5min and 1min) if the current candle on that timeframe is bullish or bearish. This will give a good indication of the direction for us to trade in. We need to be in sync with the bigger timeframes.
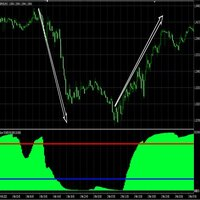
Absolute High Low indicator is a discretionary tool for assessing extremes in the price. It is very self-explanatory, and you can test against other default oscillators to see the difference. Combine with your trend following systems to master entry and exit at extremes. Back test and study the indicator to see the results up against a system or indicator. The indicator calculates a number of max bars so a gap will appear at the end, and it will restart. MT4 Version: https://www.mql5.com/e
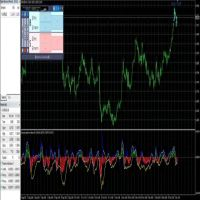
This is a predictive indicator ( leading indicator ) that uses Bayes' formula to calculate the conditional probability of price increases given the angular coefficient. The indicator calculates the angular coefficient and its regression and uses it to predict prices.
Bayes' theorem is a fundamental result of probability theory and is used to calculate the probability of a cause causing the verified event. In other words, for our indicator, Bayes' theorem is used to calculate the conditional pr
To get access to MT4 version please click here . This is the exact conversion from TradingView:"HIGH AND LOW Optimized Trend TrackerHL OTT" by "kivancozbilgic" This is a light-load processing indicator. It is a non-repaint indicator. All input options are available. Buffers are available for processing in EAs. You can message in private chat for further changes you need. Thanks.

Pinbar Outside Pattern indicator shows in a table symbol, time frame and direction of the last price candle if it matches outside pinbar input parameters. Outside pinbar means that the candle is extreme in the chosen time frame. By clicking ' Open chart ' button you can view drawn pattern. You can choose to scan through all the symbols in Market Watch or enter your favorite symbols, and also you can enter time frames you need to scan. ---------Main settings-------- Select all symbols from Market

It is one of the famous indicator in TradingView platform. Supertrend indicator shows the trend of the market intuitively . You can use it for understanding the trend or get insight about the market.
------- Value & Color -------- You can change the colour (line, filled). Default value is the same as Tradingview Supertrend default value ( period 10, ATR multiplier 3.0)
Provlepsis 지표에 오신 것을 환영합니다.
"Provlepsis"는 MQL 마켓을 위해 개발된 고급 지표입니다. 같은 시간대의 이전 바를 분석하여 시장 움직임의 잠재적 범위를 정확하게 계산하여 향후 가격 변동에 대한 소중한 통찰력을 제공합니다. 전통적인 ATR 지표와 달리 "Provlepsis"는 시간 요소를 고려하여 다양한 시장 조건에 적응하는 더 강력한 도구입니다. 밤에는 좁은 범위를 예측하고 활발한 거래 시간대에는 더 넓은 범위를 예측합니다. "Provlepsis"가 제공하는 포괄적인 범위 분석으로 거래 전략에서 경쟁 우위를 확보하세요. 최초 20개 다운로드 가격: 35.00달러
다음 가격: 60.00달러
프로블렙시스 사용의 이유
범위 기반 트레이딩: 이 지표는 시장 움직임의 잠재적 범위를 식별하는 능력으로 범위 기반 트레이딩 전략에 가치를 제공할 수 있습니다. 트레이더는 이 지표를 사용하여 예상 범위 내에서 주요 지지선과 저항선을 식별하고 그에 맞게 거래를

Pack Volatility 75 1/3 In this indicator stage 1 I am pleased to present you the volatility 75 Buy/Sell Professional indicator. where in each temporary structure it will mark a sale and a safe purchase to operate manually, where the strategy is based on the lines EMA of 7 exponential periods and the EMA of 50 exponential periods. where purchasing a product comes 2 as a gift (it's the pack) purchasing any of the 3 products will be sent the remaining indicators, to be able to apply the strategy we
On this occasion I am pleased to present the (Boom 300 Professional Pack) where it consists of 4 indicators for the Boom 300 index of synthetic indices (Deriv Broker) Acquiring this indicator enables you the pack of the 4 boom 300 indicators where the rest of the indicators will be sent, This indicator is 1 of the 4 that includes the Buy/Sell strategy, sending you clear alerts where there buy or sell the pair It is recommended to use in a period of 15 minutes, to have a greater profit since the
Professional Pack Crash 300 Indicators, On this occasion I present the trend indicator that is for the crash index 300 (Deriv Broker) The indicator consists of a strategy where trends are caught in periods of 15 minutes, very clearly the indicator shows the purchase marking the tip of red until the trend develops, and then mark the green point of purchase, it is very simple to use, It is recommended to use in that temporality since it serves to catch longer trends and increase profit, the indica
Channel Stochastic Boom 1000 I am pleased to present the pack (Tendence Boom 1000) where on this occasion I present the Channel Stochastic Boom 1000 indicator for (Deriv Broker) where is 1 of the 4 indicators that the pack brings! The indicator consists of the sthochastic strategy, where it reaches the point of (0 Level) the purchase is made, taking advantage of hunting spike, where it reaches the point of (90 Level) the sale is made taking advantage of the trend candles! It is used in 1 minute

The Fisher Transform is a technical indicator created by John F. Ehlers that converts prices into a Gaussian normal distribution. The indicator highlights when prices have moved to an extreme, based on recent prices. This may help in spotting turning points in the price of an asset. It also helps show the trend and isolate the price waves within a trend. The Fisher Transform is a technical indicator that normalizes asset prices, thus making turning points in price clearer. Takeaways Turning poi

"Advanced Daily VWAP with Standard Deviation and Trading Bands" Description: "The 'Advanced Daily VWAP with Standard Deviation and Trading Bands' indicator offers a comprehensive view for traders who wish to make the Volume Weighted Average Price (VWAP) the crux of their trading strategy. It not only calculates the VWAP on a daily basis but also incorporates standard deviation to give an accurate representation of market volatility. The trading bands are calculated using a 1.5% multiplier for th

This MT5 indicator is my newest trading indicator which gives traders an accurate entry to buy or to sell. This can be used to scalp or swing-trade on longer time-frames but you will need to set your own stop loss and profit targets as the markets are unpredictable. This indicator can always provide the trader with at least a few pips of profit from scalping. Buy when you see a green arrow and sell when you see a red arrow. It's as easy as that.
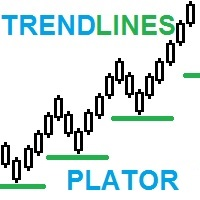
트렌드플레이터: 최적화된 거래 전략을 위한 강력한 추세 예측 지표 우리의 새로운 지표의 힘을 발견하세요! 더 큰 시간 프레임의 추세선을 계산하고 현재 시간 프레임에 직접 예측하여 모든 트레이더의 주목을 끄는 전략적인 지원을 제공합니다. 이러한 포인트는 거래에 강력한 지지나 저항 수준이 되어 거래 전략을 촉진합니다. Price action 지표 컬렉션에 완벽하게 부가되는 지표에 대한 액세스를 상상해보세요. 우리의 새로운 지표가 바로 그것입니다! 테스트해 보고 그 정확성에 놀라워하십시오. 이는 당신의 전략에 부족한 조각이 될 수 있으며 결과를 향상시킬 수 있습니다. 시간을 낭비하지 마세요! 이 멋진 도구를 거래 아카이브에 추가하는 기회를 활용하십시오. 그 가치와 잠재력을 인정한다면 지금 구매하는 것을 망설이지 마십시오. 강력한 지표와 함께 성공의 새로운 수준에 도달하여 정확도를 높이세요! 새로운 소식을 놓치지 마세요 독점적인 출시 소식을 받으려면 지금 가입하세요. 프란시스코 고메스 다

Trading Hours 표시기는 콘크리트 거래소의 시작 및 종료 시간을 나타내는 프레임을 차트로 그립니다. 입력: 입력 매개변수 `UTC 시간대 이동`은 UTC에서 사용자의 시간대 이동을 설정합니다. 다른 매개변수는 프레임을 표시하거나 숨기거나 색상을 설정하는 데 사용됩니다. 특징: 콘크리트 교환의 시작 및 종료 시간을 나타내는 프레임을 차트로 그립니다. 선택한 교환에 대한 프레임 표시/숨기기, 선택한 교환의 색상을 설정합니다. 17개 대형 거래소 지원, 1일보다 작은 기간만 지원합니다. Market-Instruments 에서 개발
Trading Hours 표시기는 콘크리트 거래소의 시작 및 종료 시간을 나타내는 프레임을 차트로 그립니다. 입력: 입력 매개변수 `UTC 시간대 이동`은 UTC에서 사용자의 시간대 이동을 설정합니다. 다른 매개변수는 프레임을 표시하거나 숨기거나 색상을 설정하는 데 사용됩니다. 특징: 콘크리트 교환의 시작 및 종료 시간을 나타내는 프레임을 차
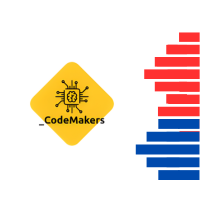
A visual Order Book is a powerful tool used in the financial market to provide a detailed view of buy and sell orders in a given financial instrument in real time.
This visual representation allows traders to observe the liquidity available in the market, identify the supply and demand levels at different prices and follow the evolution of orders as they are placed, modified or withdrawn.
By analyzing the visual Order Book, traders can identify trading patterns, detect possible reversal poi
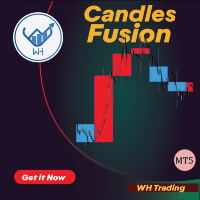
캔들 퓨전은 현재 시간대에 더 높은 시간대의 양초를 표시하여 거래 분석을 향상시키는 강력한 MT5 표시기입니다.
이 고유한 기능은 트레이더에게 다양한 시간대에 걸쳐 가격 움직임에 대한 포괄적인 보기를 제공하여 정보에 입각한 거래 결정을 내릴 수 있도록 합니다. 특징:
다중 시간대 오버레이. 사용자 지정 가능한 기간 선택. 명확한 시각화. 실시간 업데이트. 사용자 친화적 인 인터페이스.
캔들 퓨전은 시장 역학에 대한 포괄적인 이해와 현재 차트에 더 높은 시간대의 캔들을 병합하여 거래 정밀도를 높이려는 트레이더를 위한 필수 도구입니다. 이를 통해 트레이더는 주요 지원 및 저항 수준을
식별하고 추세 반전을 발견하고 숨겨진 거래를 발견할 수 있습니다. 더 정확하게 기회를 제공합니다.
질문이 있으시면 언제든지 저에게 연락하십시오
Crash Scalper Gold It is an indicator, where it marks points of purchase and points of sale As the name says, it is used to scalp in the pairs of (Crash) 1000/500/300 where it sends you signals of sale/Sell and purchase/Buy at level points (90) he sends you the sell signal, (Spike) at the level point (27) it sends you the buy signal, (Trend Candles) It is very simple and easy to use. to make the best tickets possible! For this period it will remain on sale! Without further ado, enjoy! Good profi
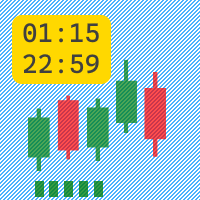
The Active Session indicator displays an active trading session in the form of green candles in a separate window.
Indicator parameters:
Monday = true/false - trade on Monday if the parameter is true.
Tuesday = true/false - trade on Tuesday if the parameter is true.
Wednesday = true/false - trade on Wednesday if the parameter is true.
Thursday = true/false - trade on Thursday if the parameter is true.
Friday = true/false - trade on Friday if the parameter is true.
StartHou
Xau/Usd Scalper It is a unique indicator where it counts the low/high to make buy and sell entries! where you mark the entries with arrows next to the lows and highs used in m15/H1 to make longer and more valuable entries It is very simple and easy to use It also works for forex pairs and synthetic indices! Without further ado, enjoy! good profit World Investor!!

볼륨 가중 평균 가격 지표는 MT5의 메인 차트 창에 표시되는 라인 스터디 지표입니다. 이 표시기는 일반적인 가격을 모니터링한 다음 표시기 라인을 거래량이 많은 가격으로 자동 푸시하는 데 사용되는 거래량을 모니터링합니다. 이 가격은 가장 많은 계약(또는 랏)이 거래된 곳입니다. 그런 다음 이러한 가중 가격은 되돌아보는 기간 동안 평균화되고 지표는 푸시된 가격에서 라인 연구를 보여줍니다.
이 게시물의 지표를 통해 트레이더는 해당 룩백 기간의 일일 시작 시간을 설정할 수 있습니다. 이 표시기는 자동으로 5개의 일일 룩백 기간(현재 형성 기간 및 동일한 시작 시간을 기준으로 이전 4일)을 표시합니다. 이러한 이유로 이 지표는 일중 거래에만 사용됩니다. 표시기는 해당 날짜의 수직 일일 시작 시간 구분선도 자동으로 표시합니다. 일반적인 가격과 거래량은 하루 종일 누적되며 하루 종일 처리됩니다.
중요 업데이트: 이 지표의 v102를 사용하면 VWAP 및 밴드의 시작을 가장 최근의 주요
Step Scalper , It is an indicator with alerts, where it sends you buy and sell alerts accompanied by a moving average of 21 periods It is very easy and simple to use. where on the path of the green period marks the purchase of the asset , and the path of the red period marks the sale of the asset, It is used for scalping on M5/M15 but it is also recommended use it in periods of 1 hour since it captures the buying or selling trend, to get more profit! no more to enjoy good profit World Investor!
대수 이동 평균 지표는 지수 이동 평균의 공식을 반전시키는 이동 평균입니다.
많은 거래자들은 로그 차트를 사용하여 가격 변동의 길이를 분석하는 것으로 알려져 있습니다. 이 게시물의 표시기는 표준 시간 척도 차트에서 가격의 대수 값을 분석하는 데 사용할 수 있습니다.
거래자는 다음 입력 매개변수를 설정할 수 있습니다.
MAPeriod [기본값: 9] - 가격을 더 부드럽게 하려면 더 높은 숫자로 설정하고 대수 이동 평균 선 연구의 더 빠른 반전을 위해 더 낮은 숫자로 설정합니다.
MAShift [기본값: 3] - 가격 교차의 양을 줄이려면 더 높은 숫자로 설정하고, 가격 교차가 더 자주 발생하려면 더 낮은 숫자로 설정하십시오.
표시기 라인(표시기 버퍼)은 Expert Advisor 빌더 소프트웨어 또는 사용자 정의 코딩된 Expert Advisors에서 생성된 Expert Advisors에서 iCustom으로 호출할 수 있습니다.

If you have been anywhere near Forex forums or social media lately, you have no doubt been hearing people talk about Smart Money Concepts (SMC) trading. You may be wondering what SMC is, and whether it deserves all the hype. In this post, we will introduce Smart Money Concepts trading to you so you can make an informed decision about whether or not to give this strategy a try in your own trading. What is SMC Forex trading? Smart Money Concepts (SMC) is one of many forex trading methods. SMC
Volumen del especulador Es un indicador que captura la fuerza del volumen de compra y venta. donde es muy fácil de usar, mostrándote la fuerza alcista y la fuerza bajista. En este gráfico está el claro ejemplo de cómo se utiliza, en el par VOLATILITY 75 donde esta la tea verde junto con la flecha que indica la compra, y ahí está la vela roja con la flecha marcando la venta del par, los parámetros a utilizar son Volumen : 5 Tiempo : 1000 para que capte toda la tendencia y se note mejor cuando co
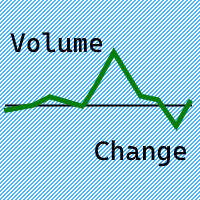
The Volume Change indicator displays in a separate window the change in volume and the direction of price movement in the form of a line.
Indicator parameters: VolumeTimeframe - timeframe on which the indicator takes data. VolumeApplied - volume type: Tick volume/Real volume. VolumePeriod - period of the moving average on the VolumeTimeframe, against which the volume change is calculated.
This indicator can be used to build a trading system based on tracking price movements w
차트에 그리기 기능을 제공하는 "Draw On Chart Indicator"를 소개합니다: 차트에서 창의력을 발휘하세요!
분석을 주석으로 추가하거나 아이디어를 효과적으로 전달하기 위해 트레이딩 차트에 주석을 달기 위해 애를 쓰는 데 지쳤나요? 더 이상 찾아볼 필요가 없습니다! 저희는 자랑스럽게 "Draw On Chart Indicator"를 선보입니다. 이 혁신적인 도구를 사용하면 몇 번의 클릭 또는 펜 스트로크로 차트에 직접 그리고 주석을 추가할 수 있습니다.
저희 혁신적인 "Draw On Chart Indicator"는 차트 분석 경험을 향상시키고 창의력을 발휘할 수 있도록 설계되었습니다. 이 강력한 도구를 사용하면 손쉽게 생각을 표현하고 핵심 레벨을 표시하며 패턴을 강조하고 트레이딩 전략을 시각적으로 표현할 수 있습니다. 숙련된 트레이더, 기술적 분석가 또는 트레이딩의 매혹적인 세계를 탐험하는 초보자라 할지라도, "Draw On Chart Indicator"는 차트와

Moving Average Band is a tool designed to provide traders with a more comprehensive and realistic perspective when using moving averages in their technical analysis. Unlike conventional moving averages plotted as lines, Moving Average Band introduces a unique approach by representing the moving average as a dynamically adjusting band based on market volatility.
Volatility is an intrinsic characteristic of financial markets, and understanding how it impacts trends and price movements is essent
MetaTrader 플랫폼 어플리케이션 스토어에서 MetaTrader 마켓에서 트레이딩 로봇을 구매하는 방법에 대해 알아 보십시오.
MQL5.community 결제 시스템은 페이팔, 은행 카드 및 인기 결제 시스템을 통한 거래를 지원합니다. 더 나은 고객 경험을 위해 구입하시기 전에 거래 로봇을 테스트하시는 것을 권장합니다.
트레이딩 기회를 놓치고 있어요:
- 무료 트레이딩 앱
- 복사용 8,000 이상의 시그널
- 금융 시장 개척을 위한 경제 뉴스
등록
로그인
계정이 없으시면, 가입하십시오
MQL5.com 웹사이트에 로그인을 하기 위해 쿠키를 허용하십시오.
브라우저에서 필요한 설정을 활성화하시지 않으면, 로그인할 수 없습니다.