MetaTrader 5용 기술 지표 - 26

This indicator is an utility for have always under control, how much time is left at the end of the bar setted.
The utility show on the lower right of the chart, the countdown to the end.
When the remaining seconds is = to the seconds set in the input, the color of remaining seconds on chart, change color and play a warning sound to warn you that the bar is about the end. When the remaining seconds is < to the seconds set in the input, the utility play a beep to warn you that the bar is in
FREE

Advanced Trend Builder is a trend indicator using the original calculation algorithm. ATB can be used on any data and timeframe. My recommendation use for calculation numbers 4 - 16 - 64 - 256 and so on ..., but this is only recommendation. The middle of the trend wave is a special place where market behavior is different, when developed ATB was main idea to find the middle of the wave trend. Input parameters: Bars will be used for calculation - number of bars used for a trend line calculation.
FREE

A unique professional tool is a divergence/convergence indicator between AC and price, which allows you to receive a signal about a trend reversal in a timely manner or catch price pullback movements (depending on the settings). It is indispensable for those who trade divergences manually or with an Expert Advisor. The indicator settings allow you to adjust the strength of the divergence /convergence due to the angle of the AC peaks and the percentage change in price, which makes it possible to
FREE

The Indicator indicator draws 2 clouds based on Envelopes indicator values. The upper cloud is formed by the upper lines values and the lower cloud by the lowers lines values. The indicator allows to change the Envelopes parameters and the clouds colors the period of the base line and the deviations of each Envelopes instance. The indicator holds 5 buffer index as follow: [0] - Outer values of the upper cloud [1] - Inner values of the upper cloud [2] - Base/Center line values [3] - Inner valu
FREE

Only Exponential Moving Average at Close Price is used in standard Bears Power limiting the possibilities of that indicator to some extent. Bears Power Mod enables you to select from four Moving Averages and seven applied prices, thus greatly expanding the indicator's functionality.
FREE

Indicator that show candlestick bars with an different sampling method than time fixed. Real time data is sourced to the indicator and it may be used as substitute of the default graph. Each bar is formed when a predefined amount of ticks is received, showing in the graph the OHLC of this clusteri of ticks. The input variable is the amount of ticks of each bar. It's a different approach of sampling, the amount of bars is proportional to the amount of negotiations insted of a sample in a fixed am
FREE

Good afternoon. Today we offer the maxlottomson indicator to determine the maximum volume that you can put up for purchase or sale, if you look at your deposit level. This indicator is convenient to use for News trading, when you need to determine the entry point on a high-speed movement and calculate the risk level as a percentage of the deposit, the maxlottomson indicator shows the maximum value of the LOT volume for your deposit that you can use for trading.
FREE

В стандартном индикаторе DeMarker используется простая скользящая средняя - Simple Moving Average, что несколько ограничивает возможности этого индикатора. В представленном индикаторе DeMarker Mod добавлен выбор из четырех скользящих средних - Simple, Exponential, Smoothed, Linear weighted, что позволяет существенно расширить возможности данного индикатора. Параметры стандартного индикатора DeMarker: · period - количество баров, используемых для расчета индикатора; Параметры индикат
FREE
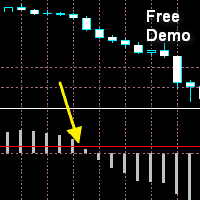
The moment when the MACD line crosses the signal line often leads to a significant price movement and trend changes. MACD Cross Prediction is an indicator that uses OSMA(MACD oscillator) and a red line. You can change the level of the red line on the indicator setting popup(and the red line moves up and down). The alerts(email, mobile push, sound, MT5 alert) will be sent when the MACD histogram touches the red line, which means the alerts can be sent just before/around the time when the MACD lin
FREE

Индикатор, показывающий моменты пересечения важных уровней индикатора RSI. Может быть использован для поиска моментов пересечения уровней для успешной торговли на отскок или по тренду.
Входные параметры Inform about finding the signal - параметр, отвечающий за получение уведомлений (Alert) о найденном сигнале. По умолчанию - нет RSI period - Период RSI для работы RSI Max - Значение максимальной границы RSI RSI Min - Значение минимальной границы RSI
FREE

The indicator draws a colored histogram from comparisons of the strengths of bulls and bears.
It works like this:
The values of two indicators Bears and Bulls are taken, who is stronger on the candlestick is compared, the column is filled in. It's all.
.
FREE

1. Why did I develop this series of indicators
I found that most traders need to use multiple time frame indicators. They usually switch time frame to see indicators. However, once the timeframe is switched, you cannot see the corresponding relationship between the price in the smaller timeframe and the indicator in the larger timeframe . For example: if your price chart is in H1 timeframe, you can see H4, D1 and W1 indicators in H1 timeframe Chart. This is more helpful for you to find t
FREE

Free version of https://www.mql5.com/en/market/product/44815 Simple indicator to calculate profit on fibonacci retracement levels with fixed lot size, or calculate lot size on fibonacci levels with fixed profit. Add to chart and move trend line to set the fibonacci retracement levels. Works similar as default fibonacci retracement line study in Metatrader. Inputs Fixed - select what value will be fix, lot or profit (available in full version, lot is set on free version) Fixed value - value tha
FREE
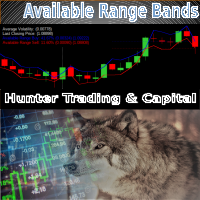
The Available Range Bands Technical Indicator draws two lines on the chart indicating the maximum limits (bands) expected for buying and selling for the current period (candle). These limits can be accessed by buffers 0 and 1 respectively.
In addition, it displays in the lower right corner the current average values of the real volatility, the last price, the predicted range of movement available for buying (% and points) and the predicted range of movement available for selling (% and points
FREE

Стратегия форекс «Гора» основана на одном довольно сложном индикаторе. С его помощью генерируются вполне неплохие сигналы и, в принципе, автор указывал возможность торговли и на остальных инструментах, однако, мы решили взять изначальный вариант — торговлю только по GBP/USD. Так же следует сказать, что по ходу развития тренда торговая стратегия пропускает большое количество неплохих точек входа, но это только на первый взгляд. Фильтрация сигналов показала себя достаточно неплохо и в итоге торгов
FREE

This is the MT5 version. Get Q-Math MT4 here
Check it out and if you like it just enjoy it. Try various values to find the setting that best suits your trading. Upward signal if the indicator is colored lawn green and bearish signal if the indicator is gray. You can use the line itself to trailing stop when you open orders. This is just a tool. A complement. It is not a strategy. Combine it with your own analysis Just download it and try it, it's free.
FREE

Introduction
One of the patterns in "RTM" is the "QM" pattern, also known as "Quasimodo". Its name is derived from the appearance of "Hunchback of Notre-Dame" from Victor Hugo's novel. It is a type of "Head and Shoulders" pattern.
Formation Method
Upward Trend
In an upward trend, the left shoulder is formed, and the price creates a new peak higher than the left shoulder peak . After a decline, it manages to break the previous low and move upward again. We expect the pric

Spread Indicator MT5 - NS Finanças. (http://www.nsfinancas.com.br) Auxiliary tool to give Spread visibility to all types of currency pairs and timeframes. The labels are well positioned in the upper right corner of the chart so as not to disturb the visualization during the trade, however it is also possible to drag the indicator to the best place on your screen. In addition to the current spread, this indicator also monitors the minimum, maximum and average spread of the selected currency pair
FREE

Critical Trading, Omni-Channel This indicator lets you create a unique channel from a base type and a range type. Channels are great for spotting over-extensions or the start of new trends. With an ever changing market it is important to create your own edge in the market that no one else has. Let Omni-Channel add to your unique trading strategy. Please contact criticaltrading@outlook.com for more info or advice on adding any other functionality.
FREE
The indicator displays the chart of an arbitrary combination of trading instruments, described by the entered arithmetic formula. Using the indicator. Add an indicator to any chart. Enter the formula as a string in the indicator's parameters. All symbols used in the formula must exactly match the names in the table "Market Overview" of the terminal. Example of the formula: (SIBN + SNGS) / 'RTS-3.19' + 2.5 * GAZP / LKOH Start the indicator The formula must meet the following requirements: The nam
FREE
grafico de media os dados são exibidos pela media aritimetica dos negocios realizados, evitando as distorções dos outros graficos. A forma de operação e pela busca de padrões. o parametro e para reduzir as distorções, diminuindo as interferências, quanto menor for o valor mais alinhado o grafico fica. ativos mais lentos são o ideal, atualmente estou usando no dollar canadense.
FREE

Indicator for fast navigation through financial instruments. When you click on the button, you go to the chart of the financial instrument, the name of which was written on the button. In other words, the indicator opens or unfolds an existing chart window. For each chart, you can customize the name of the financial instrument, text color and background color; in total, you can customize symbols buttons that you trade often. The indicator can be installed on any charts for which you need to swit
FREE

Non-proprietary study of Joe Dinapoli used for overbought/oversold evaluation. Uses of Detrended Oscillator indicator Profit taking. Filter for market entry technics. Stop placement. Part of volatility breakout pattern. Determining major trend changes. Part of Dinapoli Stretch pattern. Inputs lnpPeriod: Perid of moving average Method: Calculation method ********************************************************************************* If you want to know market Overb
FREE
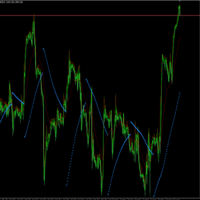
La idea de este indicador es la siguiente: reemplazar los precios High, Low del indicador SAR por los valores del indicador Moving Average. Al final tendremos la siguiente imagen:
Es decir, el indicador SAR cambia su dirección después de tocar el indicador Moving Average.
Parámetros de entrada SAR: Step - parámetro "Step" del indicador SAR; SAR: Maximum - parámetro "Maximum" del indicador SAR; MA: Period - parámetro "período de promediación" del indicador MA; MA: Shift - parámetro "d
FREE

The indicator is built on a principle similar to neural networks, and it calculates a multidimensional polynomial. When you install it on a chart or make changes to the indicator's parameters, or when you switch the chart period, the indicator is initially initialized. During initialization, not only the entire period of the chart is recalculated, but also the indicator is self-trained. The indicator's parameters include Sensitivity, Forecast, and degree of harmonization. The indicator theoretic
FREE

Indicador Monte Carlo Simulation Indicador faz uma regressão linear nos preços de fechamento do ativo escolhido e gera uma simulação de Monte Carlo de N preços aleatórios para definir 3 níveis de sobrecompra e 3 níveis de sobrevenda. O primeiro processo é a Regressão Linear dos preços de fechamento do ativo, no qual é regido pela equação: Y = aX + b + R Onde Y é o valor do ativo escolhido, X é o tempo, a é a inclinação da reta, b é a intersecção da reta e R é o resíduo. O resí
FREE

Indicador que cria um painel para acompanhamento to total de posições abertas no ativo do gráfivo.
São apresentados os dados: Ativo do gráfico Total de posições de venda em aberto Quantidade do volume de posições de venda em aberto Total de posições de compra em aberto Quantidade do volume de posições de compra em aberto.
Painel simples mas eficiente para o equilíbrio das ordens
FREE

Moving Average ******************* Moving Average для платформы секундных графиков Micro . ********************* Секундный график на порядок увеличит точность ваших входов и выходов. Секундный период , в привычном формате, позволит увидеть то, что ранее было скрыто. Бесплатные индикаторы, дополнят визуальную картину, что, в совокупности выведет вашу торговлю на новый уровень. Идеально подходит как скальперам, так и трейдерам торгующим внутри дня. Индикатор Moving Average для платформы Micr
FREE

Tick Speed Free povides a on-chart label of tick speed to allow you to see the ebb and flow of market activity. Observing rises and falls in tick speed may allow you to better time entries to reduce slippage and re-quotes.
Options include: - colores for low-mid-high tick speeds - placement and styling - prefix & suffix to customise the speed label
Troubleshooting: - Note, in the tester environment, tick timings are limited to what is supplied by the tester environment and it's speed
- If
FREE

An improved version of the standard Standard Deviation indicator.
It is now a responsive and smoothed line.
The setup is not straightforward - but I hope you can do it.
It is very easy to understand the readings of this indicator, the meaning is the same as that of the usual Standard Deviation.
//////////////////////////////////////////////// ///////////////////////////////////
I hope this indicator will be very useful to you in successful trading.
Good luck.
FREE

O indicador é uma ferramenta desenvolvida para o MetaTrader, projetada para auxiliar na análise detalhada do comportamento do preço em relação a uma média móvel específica. Ao ser anexado ao timeframe diário, o ele realiza cálculos e monitora, em timeframes menores, quantas vezes o preço toca determinados níveis de afastamento durante o dias além de calcular a média dos toques.
MT4: https://www.mql5.com/pt/market/product/111706
FREE

--- StudentK Sync Chart --- 1. Move charts at the same time 2. Cross check among different Symbols and Timeframes 3. Plan your own trading strategies
=== Simple (Free) Version ===
1. Allow USDJPY only
2. Support M5 and M15
3. * Contact StudentK for unlocking all timeframes *
--- Context --- StudentK is not indicated as a master or K Sir for knowledgeable person who claims for winning all the time. (But lots of traders should know the fact that it is rarely truth, especially in fluctuat
FREE

High and Low
The indicator marks bars with a simple trend definition“ each subsequent high above/below the previous one and each subsequent low above/below the previous one ”. Charles Dow
Formula:
Max – The current maximum Min – The current minimum MaxK – Maximum per period MinK – Minimum per period
Min>MinK & Max>=MaxK – Symbol on top Max
FREE

Gapless Moving Average (GMA)
Improved version of standard Moving Average (MA) from MetaTrader library which provides the possibility to eliminate the 'gaps' between candle sticks which distort the average values mainly during the N ('period') initial candles after market opens due to the spread ('gap') between closing price from previous day and opening price from the next day. The greater these 'gaps' are, the more divergent the standard MA is in order to indicate the current p
FREE
Мультивалютный индикатор в отдельном окне отображает движение валютных пар в пунктах с расхождением от начала дня. Во время работы, динамически возможно включать и отключать различные пары прямо на графике. При первом запуске, возможно, потребуется продолжительное время, пока загрузиться история для основных валютных пар. Расчет всех кроссов происходит на основе мажоров. Для валют CAD, CHF, JPY - график перевернут. При повторном открытии, все настройки индикатора восстанавливаются автоматически.
FREE

Indicator details The Moving Average Retracement Boundaries(M.A.R.B) shows the average retracement level above or below the given moving average.It shows the first upper boundary (which is the average retracement above the moving average ),the second upper boundary (which is double the first upper boundary),the first lower boundary (which is the average retracement below the moving average) and the second lower boundary (which is double the first lower boundary).
How to use it 1.It can be used
FREE

This indicator changes the standard MetaTrader 5 candles to candles at the selected BID, ASK or Average price (BID+ASK)/2. Simply attach the indicator to the chart and select the prices to plot the candles or bars. Indicator Parameters ENUM_DRAW_TYPE - plot candles or bars on the chart For the price - the price for plotting the candles or bars The chart returns to its normal visualization mode after removing the indicator.
FREE
A professional tool for trading - the divergence indicator between the AC and the price, which allows you to receive a signal about a trend reversal in a timely manner or catch price pullback movements (depending on the settings). The indicator settings allow you to adjust the strength of the divergence due to the angle of the AC peaks and the percentage change in price, which makes it possible to fine-tune the signal strength. The indicator code is optimized and is tested very quickly as part
FREE

"Elder Ray" or "Ray" indicator is based on the Dr. Alexander Elder's oscillators: Bulls & Bears Power. Both of them works with an EMA. This indicator is used by traders to identify divergence, market directions and more... Dr. Elder's method generally uses a 13-day EMA Period but this can be modified based on your personal demand. The calculations are: Bulls Power= high candle - EMA close Bears Poder= low candle - EMA close Lime line represents Bulls Power and OrangeRed line, shows Bears Power
FREE

The indicator has only one parameter - the number of bars for analysis. The indicator calculates statistics for when the market was moving down, when it was moving up, and the number of bars for each movement. From this data, the average number of bars is calculated, which is displayed in the indicator window. If the indicator values sharply decrease, then the market is preparing for an upward movement. If the indicator values persist at high levels for an extended period, then the market is pre
FREE

Добрый день. Сегодня добавили вспомогательный индикатор тренда DveMashkiTompson, идея взята из аналога МТ4 и перенесена на МТ5, используется совместно с индикаторами Тренда ТМА и МА, рисует красные и зеленые области в зависимости от направления рынка. Тренд вверх -зеленые области, тренд вниз -красные.Области основываются на пересечении индикатора МА, таким образом данный индикатор дает информацию графического содержания для более быстрой оценки ситуации и принятия решения.
FREE

Бинарный индикатор находит свечной паттерн "Поглощение" и рисует соответствующий сигнал для входа рынок. Имеет встроенные фильтры и панель для просчета количества успешных сделок. Демо версия является ознакомительной, в ней нет возможности изменять параметры. Полная версия . Особенности Работает для всех валютных пар и любых таймфреймов. Индикатор рассматривает комбинацию из 2-х или 3-х свечей в зависимости от настроек. Имеется возможность фильтровать сигналы путем настройки количества свеч
FREE
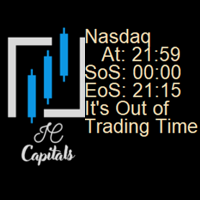
This indicator shows you the time of the opening and close of the trading time of every symbol. If it's out of the trading time it will show you a message in the screen, you can choose "PT-BR" or "ENG". For future updates i want to trigger a sound alarm in the preset value by the client for the opening of positions and closement of all positions.
If you want anything more than that just message me in the community ( https://discord.gg/P5mcttvXgw ) and I will update it for you!
FREE

Привет. Сегодня представляем индикатор корреляции - SynchroWindowTomson. Индикатор в одном окне показывает движение нескольких инструментов, по отношению друг к другу, удобно определять направление и изменение, особенно когда вы работаете с целым портфелем разных инструментов и нужно определить какой из них тянет результат назад и движется в другую сторону. Так же видны точки разворота спреда.
FREE

//////////////////////////////////////////////// //////////////////////////////////
An improved version of the standard Average True Range indicator.
It is now a responsive and smoothed line.
The setup is not straightforward - but I hope you can do it. It is very easy to understand the readings of this indicator, the meaning is the same as that of the standard Average True Range.
//////////////////////////////////////////////// ///////////////////////////////////
I hope this indicator
FREE

*This is trading view indicator converted in mql5*
The HA Market Bias Indicator is a popular tool used in trading and technical analysis, designed to help traders identify market bias and potential trend reversals. It is commonly used in conjunction with candlestick charts and provides valuable insights into market sentiment. The indicator is based on the Heiken Ashi (HA) candlestick charting technique, which aims to filter out market noise and provide a smoother representation of price actio
FREE

Indicator for "screenshoting" the chart at a specified interval. The files are saved in the " MQL5\Files\ScreenShots\Symbol TF\ " directory and named as the date and time the screenshot was taken ( 2017.06.20 23.56.24.png ) Settings: Width and Height — width and height of the saved screenshots, IntervalSeconds — the saving interval in seconds. Attention ! If you set a large size for screenshots and a high frequency, you may run out of space on the hard drive. Do not delete the folder where the s
FREE

Indicador Volatilidade Histórica Indicador é um oscilador que faz o plot da volatilidade histórica de um ativo, representado pelas fórmulas: Volatilidade Histórica = Raiz quadrada da média das diferenças ao quadrado * Fator de anualização. Média das diferenças ao quadrado = soma de todas as diferenças de retorno diário / número total das diferenças. Retorno diário = (preço atual - preço anterior) / preço anterior. Nesse indicador estamos utilizando os preços de fechamento de cada barra e fazemos
FREE

XFlow shows an expanding price channel that helps determine the trend and the moments of its reversal. It is also used when accompanying transactions to set take profit/stop loss and averages. It has practically no parameters and is very easy to use - just specify an important moment in the history for you and the indicator will calculate the price channel. This is a demo version limited to CHF currency pairs. Designed to familiarize you with the interactive use of XFlow DISPLAYED LINES ROTATE
FREE

Switch symbols and timeframe by arrow buttons 1. You can switch multiple symbols of one or all charts. 2. You can set list of symbols to switch between them or get them from Market Watch. 3. You can change timeframe of one or all charts. List of timeframes here [M1, M5, M15, M30, H1, H4, D1, W1, MN1]. Switch symbol of all charts: indicator check current symbol of the chart to get index of it in list and change for next or previous. Key functions: - Right arrow key: switch to next symbol. - Left
FREE

The liquidity swings indicator highlights swing areas with existent trading activity. The number of times price revisited a swing area is highlighted by a zone delimiting the swing areas. Additionally, the accumulated volume within swing areas is highlighted by labels on the chart. An option to filter out swing areas with volume/counts not reaching a user-set threshold is also included.
This indicator by its very nature is not real-time and is meant for descriptive analysis alongside other c

What is this indicator? This indicator is the RSI (Relative Strength Index) supporting Virtual Trading mode of Knots Compositor . When the mode is turned on, the indicator will be recalculated based on the displayed candlesticks. When the mode is turned off, the indicator will be recalculated based on the original chart candlesticks.
Types of the applied price - Close - Open - High - Low - Median Price (HL/2) - Typical Price (HLC/3) - Weighted Price (HLCC/4)
KC-Indicators - KC-MA (M
FREE

Based on two MA line indicators.
Looking at the histogram, if the value is greater than 0, the uptrend will increase, the bigger the value, the stronger the uptrend will be and vice versa, if the value is less than 0, the downtrend will decrease, the smaller the value, the stronger the downtrend . The necessary condition when entering a buy order is that the first histogram is greater than 0 and the current candle is closed, and enter the order when the second histogram appears. The necessary
FREE
O indicador grafico de rompimento foi desenvolvido para elevar a precisão e confiabilidade na identificação de oportunidades de rompimento no mercado financeiro. Projetado com algoritmos avançados, este indicador destaca barras de rompimento com uma precisão notável, permitindo que traders identifiquem pontos de entrada e saída estratégicos. Recursos Principais: Precisão Aprimorada: Utiliza algoritmos avançados para identificar barras de rompimento com uma precisão excepcional. Alertas em Tempo
FREE

The indicator measures and displays the difference in the number of "Bid" and "Ask" prices changes in the form of digital, analog and graphic indicators. Designed for market research and for determine the moments of position closing during scalping trade with H1 or less timeframe. Use with bigger timeframe is not prohibited, but it is not informative because of a large number of accumulated values. Theory
"Bid" and "Ask" prices do not change simultaneously for most symbols. Often you can see h
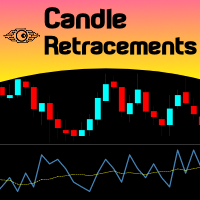
Do you want to know how much, how frequent and at what level a candlestick retraces over the previous one, just drop Candles Retracement over your chart and see it visually! Just choose your desired timeframe and the indicator will show it graphically. As simple as that... In addition you have the option to calibrate a Moving Average over this sub-window chart monitor. This indicator could be used to study candle retracements levels so you can comfortably expect during a trade what to expect fro
FREE

The indicator draws two simple moving averages using High and Low prices. The MA_High line is displayed when the moving average is directed downwards. It can be used for setting a stop order for a sell position. The MA_Low line is displayed when the moving average is directed upwards. It can be used for setting a stop order for a buy position. The indicator is used in the TrailingStop Expert Advisor. Parameters Period - period of calculation of the moving average. Deviation - rate of convergence
FREE

Normalized Candlestick shows candlesticks which are filtered by volatile price action activities. It filters big price movements that caused by big players and news. It shows candlesticks based on actual psychological reason to go up or down in normal circumstance.
It was originally made to find actual reversal points that depends on support and resistance levels. But big players and news can cause price to be volatile and move support and resistance to new level dynamicaly. In order to norma
FREE

Recomended broker: https://tinyurl.com/5ftaha7c Indicator used to monitor price fluctuations in the market and discover possible reversals through reversal points or divergences in the indicator. All assets and all timeframes. SEE OUR RESULTS ON INSTAGRAM: https://www.instagram.com/diogo.cansi/ TELEGRAM GROUP = https://t.me/robosdsc More information by email dscinvestimentos@gmail.com or by Whatsapp 55-991372299
FREE

Thread indicator is calculating possible values for the upcoming periods. It is built by author’s system, with ability to learn. Input data ( recommended interval ): Sensitivity to oscillatory motion (integer value, 0 - 8) increase of value shifts priority of calculation towards high-frequency vibrations (increase loads the system) Shift of diagram (integer value, 0 - 8) shifts output of indicator to the right Diagram forecast (integer value, maximum 10) defies the number of periods calculated
FREE

The forex spread is the difference between a forex broker's sell rate and buy rate when exchanging or trading currencies . Spreads can be narrower or wider, depending on the currency involved, the time of day a trade is initiated, and economic conditions.
Forex Spread WatchDog :
This Forex indicator ensures that you are getting the best spreads while trading, and guards against broker spread widening.
FREE
RSI Traffic Lights Dashboard Trend is you friend, one of the classical Trend following is the Relativ Streng Index (RSI). With RSI Traffic Light Dashboard you get an Overview how the current trend is moving for several Pairs. How many pairs you monitor, can be configured in Indicator settings. The order of symbols is equivalent to your Market Watchlist. The RSI Traffic Light Indicator alerts you if the trend is changing for your pair. Alert can be switched on/off
Important: Get informed about

This indicator helps keep track of the number of trades taken in the day. It shows losses and potential profit then the total profits which is, profits - losses. Then total profit for the week and month. Soon the indicator will be sharing some trading tips based on your trading. It really does put necessary pressure and helps you to set a goal for yourself for the day. Familiarise yourself to draw your analysis on the same chart with the indicator because it will have to alert you if price brok
FREE
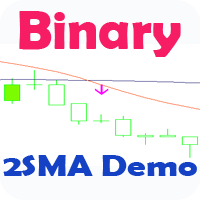
Стрелочный индикатор, выдающий сигнал при пересечении 2 SMA. Сигналы выдаются в виде стрелок и подходят для торговли бинарными опционами.
Это демо версия индикатора, в не нельзя изменять параметры. Полная версия .
Входные параметры First period- период 1 MA Second period - период 2 MA Invert signals - Возможность давать инвертированные сигналы (для работы по тренду) Candles to count - количество свечей для подсчета статистики Expiration - время экспирации сигнала Length - расстояние
FREE

What is this indicator?
This indicator is the Envelopes supporting Virtual Trading mode of Knots Compositor . When the mode is turned on, the indicator will be recalculated based on the displayed candlesticks. When the mode is turned off, the indicator will be recalculated based on the original chart candlesticks.
Types of the moving average - Simple (SMA) - Exponential (EMA) - Smoothed (SMMA) - Linear weighted (LWMA)
Types of the applied price - Close - Open - High - Low - Median Pri
FREE

Only Exponential Moving Average at Close Price is used in standard Bulls Power limiting the possibilities of that indicator to some extent. Bulls Power Mod enables you to select from four Moving Averages and seven applied prices, thus greatly expanding the indicator's functionality.
FREE
Мультивалютный индикатор в отдельном окне отображает движение валютных пар в пунктах с расхождением от начала дня. Во время работы, динамически возможно включать и отключать различные пары прямо на графике. При первом запуске, возможно, потребуется продолжительное время, пока загрузиться история для основных валютных пар. Для валют CAD, CHF, JPY - график перевернут.
При повторном открытии, все настройки индикатора восстанавливаются автоматически.
FREE

What is this indicator? This indicator is the ADX (Average Directional Movement Index) supporting Virtual Trading mode of Knots Compositor . When the mode is turned on, the indicator will be recalculated based on the displayed candlesticks. When the mode is turned off, the indicator will be recalculated based on the original chart candlesticks.
KC-Indicators - KC-MA (Moving Average) - KC-ENV (Envelopes) - KC-BB (Bollinger Bands) - KC-ADX (Average Directional Movement Index)
FREE

Display the date, time and price according to the movement of the mouse cursor on the chart This is useful for discretionary trading.
It is an indispensable tool for verifying and studying past market prices and trades. Characteristic Date,Time and Price are displayed.
The value follows the movement of the mouse.
You can change the color of the text. Please refer to the video on youtube. For MT5 only.
FREE

The custom Bollinger Bands Height indicator measures and displays the current state of the Bollinger Bands indicator, showing whether the bands are widening (moving away from each other) or narrowing (starting to converge). Contraction, indicated by the narrowing of the bands, suggests that the current market movement is losing momentum and hints at the potential start of a new strong movement. This can be a signal to look for an opportune moment to enter a position, as a sharp price change ma
FREE
MetaTrader 플랫폼 어플리케이션 스토어에서 MetaTrader 마켓에서 트레이딩 로봇을 구매하는 방법에 대해 알아 보십시오.
MQL5.community 결제 시스템은 페이팔, 은행 카드 및 인기 결제 시스템을 통한 거래를 지원합니다. 더 나은 고객 경험을 위해 구입하시기 전에 거래 로봇을 테스트하시는 것을 권장합니다.
트레이딩 기회를 놓치고 있어요:
- 무료 트레이딩 앱
- 복사용 8,000 이상의 시그널
- 금융 시장 개척을 위한 경제 뉴스
등록
로그인
계정이 없으시면, 가입하십시오
MQL5.com 웹사이트에 로그인을 하기 위해 쿠키를 허용하십시오.
브라우저에서 필요한 설정을 활성화하시지 않으면, 로그인할 수 없습니다.