MetaTrader 4용 유료 트레이딩 유틸리티 - 8
This is a purely Price Action indicator that tracks the open and close prices of all 28 major Forex currency pairs and calculates a volatility value based on every tick in real time. It only tracks raw price data and not data from another indicator and it does not use any complicated formula or algorithm in calculating volatility. This version shows volatility for all 28 major currency pairs
Benefits Accurate and real time update of volatility Volatility across all 28 major Forex currency pair
This is a purely Price Action indicator that tracks the open and close prices of all 28 major Forex currency pairs and calculates a volatility value based on every tick in real time. It only tracks raw price data and not data from another indicator and it does not use any complicated formula or algorithm in calculating volatility. This version only shows volatility for a single currency pair
Benefits Accurate and real time update of volatility Volatility across all 28 major Forex currency pair

This is a non-trading expert which transforms unstructured web-pages into structured data tables. It downloads and parses an HTML file, then creates DOM ( Document Object Model ) for it, and finally applies specified CSS ( Cascading Style Sheets ) selectors for required fields and extracts data for them. You may consider it as a powerful and highly customizable HTML to CSV ( Comma-Separated Values ) converter. The EA can process web-pages from remote sites (using MetaTrader's WebRequest ) or loc

The Expert Advisor (EA) generates an advanced trading tool to place a pending or market order on any currency pair symbol , as selected from a drop-down menu in the panel. A market order is placed by clicking appropriate Sell or Buy button. On the other hand, a pending order is placed by selecting a pending order type and thereafter clicking Place button. Moreover, the panel provides various options to define exact parameters for every order before placing it. For instance, the triggering price

The aim of this indicator is to provide statistical information about the user trading activity as recorded in the MetaTrader Account History . It can be loaded on any chart and timeframe and the information is shown on the main window and refreshed every time a new bar is formed. The orders can be selected according to various meaningful criteria: their type (long and/or short), those having a given magic number, those executed in a given time interval, on a particular weekday, on a given symbo

Slow Pips OCO Trade Panel is an advanced trading panel for placing pending orders. Traders can use this panel to place two pending orders at once. One pending order would be of buy entry type and the other one would be of sell entry type. Both orders will have Stop Loss and Take Profit parameters. Since two pending orders are placed at the same time, the pending order for which the price hits first gets converted into a market order and the other pending order gets deleted (one order cancels the
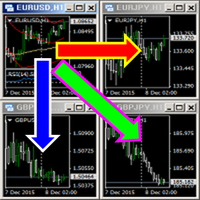
This indicator changes the timeframe and chart profile for multiple charts. If you dispatched many charts (10~20 or more) in single MetaTrader terminal, it is very boring and difficult work to manage the timeframe and chart profile individually. If the indicators you use in a chart are numerous and the setting values are different from the default one, you might give up adding all the indicators to all charts. The changing of timeframes on multiple charts has the same problem, too. Whenever you

Volume Volatility Dashboard is a great tool for quickest possible analysis of multiple currency pairs in terms of extremely high and extremely low accumulation to distribution ratio in comparison to values from past. The number of displayed symbols is 30 and the name of each symbol can be edited in the parameters, so we are able to analyze not only predetermined currency pairs, but also other ones, commodities, equities, indices, currency pairs with prefixes and suffixes etc... This analyzer is
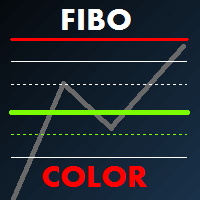
Fibo Color Levels is an amazing tool for Fibonacci lovers. You can customize your preferred values, styles and formats of each level and set the color levels according to their importance. Fibo Color Levels Not add object fibonacci retracement automatically . The purpose of this indicator is not it. So you need to manually add the Fibonacci Retracement in your chart, as usually already do. Use the standard tool Fibonacci Retracement in your MT4, draw the Fibo according to the swing-high and/or s

The Price Action Dashboard is an innovative tool to help the trader to control a large number of financial instruments. This tool is designed to automatically suggest signals and price conditions. The Dashboard analyzes all major Time Frame suggesting price action conditions with graphic elements. The Dashboard can suggest you the strength of the trend identifying directional movement, it is an indispensable tool for those who want to open position themselves using market trends identifiers. The

Grid Trading is a semi automated one click EA for manual grid trading.
Normal Trading From chart you just click Sell or Buy trades and it will handle all the trades with adding Stop Loss, Take profit, while its Trailing and Breakeven functions will care if trade cannot reach its take profit level.
Hedging If you select hedge trading it will start grid trading with opening opposite entry and this grid will continue until it will close all trades in profit.
Martin If you select martin tradin
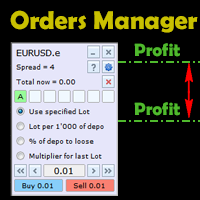
This is an irreplaceable assistant for manual trading providing maximum automation of daily routine calculations, convenient system of opening and maintaining trades and also their closure on reaching a specified adjustable level. The untility provides maximally clear and complete information on the current situation of each instrument separately and features the convenient trading panel as well as many additional functions in one program. The product works correctly with all instruments (Forex,

Searches on every symbol on MT4 MarketWatch. System Stoller% uses Williams% and StarcBands to calculate trend, entries and exits. Works only for H1 timeframe.
Input parameters: Period: Number of bars to search. Refresh_min: Number of minutes to wait between searches. ShowTrendChanges: Signals on trend changes. ExtendPeriod: Extend period to calculate signals order. UseADXFilter: Confirm entry using ADX on M15. BullColor: Font color on buy entries BearColor: Font color on sell entries.
Result
The SCRIPT opens , modifies , and deletes all types of orders: BUY, SELL, BUYLIMIT, SELLLIMIT, BUYSTOP, and SELLSTOP.
Features Orders can be opened both by comments and magic. Order grids. Take profit and stop loss modification. Orders can be removed by type, magic, and comments. Market orders are deleted if magic = 0. Notification window appears after orders are opened, modified or removed. Multi-task script. Modification is performed after opening orders.
Parameters Orders_Tip - consists o
Object Synchronizer : Better focus/analysis of the price chart in many time frames. Are you bored to save and load template many times for the same symbol for many chart time frames? Here is the alternative. With this indicator, you enjoy creating objects across many charts, you can modify the same object in any chart, you can delete the same object in any chart. All objects that you created/modified always are synchronized across all chart windows (with same symbol). Save your time, you can foc
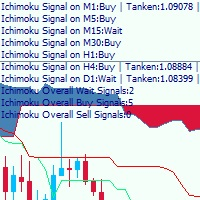
This is a multi-timeframe Ichimoku Kinko Hyo signal analyzer indicator. As you know, Ichimoku consists of 5 lines (Tenkan-sen, Kijun-sen, Chikou Span, Senkou Span A & B which create the Kumo Cloud). Ichimoku is a simple indicator like Moving Average, but the method they use makes it a very good tool in detecting market conditions and trend with which you can open trades in the best location and stay in the trade till the most profitable price. As this indicator has lots of lines and we should co

Elliott Wave Counter는 Elliott 파동의 빠르고 사용자 친화적인 수동 마크업을 위한 패널입니다. 색상과 마크 수준을 선택할 수 있습니다. 도구에서 만든 마지막 마크업과 전체 마크업을 제거하는 기능도 있습니다. 한 번의 클릭으로 마크업이 이루어집니다. 5번 클릭 - 5개의 웨이브가 있습니다! Elliott Wave Counter는 Elliott 파동의 초보자와 전문 분석가 모두에게 훌륭한 도구가 될 것입니다. Elliott Wave Counter 설치 및 입력 가이드 당신이 얻고 싶다면 EA 추가 URL( http://autofxhub.com ) MT5 터미널에 대한 알림 (스크린샷 참조). MT4 버전 https://www.mql5.com/en/market/product/14016 MT5 버전 https://www.mql5.com/en/market/product/15081 일반 입력: 웨이브 유형 버튼: 이 버튼을 사용하면 차트

If you wish to draw Support and Resistance lines, view: daily market opening, classical pivot levels, Fibonacci pivot levels, trend lines, Fibonacci levels, the remaining time to candle closing, and current spread. If you seek to place your orders with the exact lot that meets your desired stop loss risk. If you wish to do all this and more with just one click, then this is the perfect tool to use. This tool will allow you to feel more relaxed when deciding to open orders, as well as predicting

원 클릭 분석 도구는 키보드 단축키 기반 객체 생성 MetaTrader용 복사 도구입니다. 클릭 한 번으로 MetaTrader의 분석 도구를 쉽게 사용할 수 있습니다. 당사의 도구를 사용하면 지지 및 저항 수준, 피보나치 수준, 도형, 채널, 추세선 및 기타 모든 개체를 차트에 빠르게 그릴 수 있습니다. 버튼을 클릭하고 마우스를 움직이면 One Click Analysis Tool이 나머지 작업을 수행합니다. 이를 통해 시간을 절약하고 차트 분석을 보다 효율적으로 수행할 수 있으므로 분석을 기반으로 정보에 입각한 거래 결정을 내리는 데 집중할 수 있습니다. 개체 생성 외에도 One Click Analysis Tool에는 다음이 포함됩니다. 개체 복사기( 차트 동기화)를 사용하면 한 차트에서 다른 차트로 개체를 쉽게 복사할 수 있습니다. 이는 여러 차트가 열려 있고 차트 간에 개체를 복제해야 하는 경우에 특히 유용할 수 있습니다. 원 클릭 분석

The indicator looks for market sentiment impulses and notifies traders accordingly. The indicator can notify of a detected impulse via a sound or alert, as well as emails. You can select the color and display type for bullish and bearish moods. Mood arrow appears on the current bar and remains intact after the bar is formed provided that the bar forming conditions have not changed. At least 100 history bars are required for the indicator operation.
Inputs Period - period of the indicator calcu
통화 쌍의 상관 관계 및 발산 지표 - 동일한 가격 차트의 모든 쌍. 터미널에 열려 있는 모든 쌍을 표시합니다.
MT5 버전
장점 다중 통화 거래 전략을 사용하는 거래자는 이동 매개변수를 비교하기 위해 동일한 가격 차트에서 선택한 쌍의 가격 이동을 시각적으로 관찰할 수 있습니다. 이것은 오버레이 차트 표시기의 고급 및 확장 버전입니다.
"쌍 거래" 및 "포트폴리오 거래"와 같은 다중 통화 거래에 있어 상당히 효과적인 조수로서 다가오는 움직임을 미리 결정하는 데 도움이 됩니다.
이 기술은 두 가지 전략으로 요약되며, 첫 번째는 중요한 뉴스 발표 후 또는 거래 플로어가 열릴 때 통화 쌍 간의 불일치를 찾기 위해 고안되었습니다. 이러한 작업의 논리는 매우 간단하며 시장의 "폭풍"이 진정된 후 상품 가격 간의 델타가 다시 수렴하기 시작할 것이라는 가정을 기반으로 하는 반면 강력한 지원에 주의를 기울이는 것이 좋습니다. 강한 저항 아래에서 직접 구매하고 맨 아래에서 판

Grammy — is: Instant messages to your Telegram on any trade events , Commands to control all your terminals from one Telegram chat, Price alerts (crossing horizontal or trend lines), Daily, weekly and monthly reports . You can't test this utility in the Strategy Tester.
Please, contact me to get your free demo version. Why is Grammy better : Fully customizable messages templates , Emoji and "smart" substitution to the messages, Commands to control all your terminals from Te

Draw Agent는 모든 차트 분석, 낙서, 메모 등을 만들고 관리할 수 있는 아름답고 혁신적인 방법으로 설계되었습니다. 이 도구는 차트 공간을 칠판으로 취급하고 손으로 그리는 자유 그리기 방법을 제공합니다. 이 자유형 그리기 도구를 사용하면 차트에서 이벤트를 표시하거나 강조 표시하기 위해 MT4/MT5 차트에 그릴 수 있습니다. Elliott 파동을 손으로 작성하거나, 차트에 선을 긋거나, 차트에 아이디어를 설명하려는 경우 유용한 도구입니다. 클라이언트를 위한 라이브 웨비나를 실행하거나 사람들에게 스크린샷 또는 차트 파일을 배포하는 경우 특히 유용합니다. 또한. Draw Agent 설치 및 입력 가이드 EA 추가 URL( http://autofxhub.com ) MT4/MT5 터미널(스크린샷 참조) 에 대한 알림을 받으려면 . MT4 버전 https://www.mql5.com/en/market/product/14929 MT5 버전 https://www.

Copy Trader is a convenient and fast order copier for MetaTrader4. The EA performs the copying of orders from the server terminal to one or several client terminals. It monitors opening/closing, StopLoss and TakeProfit, and also pending orders. It uses a magic number for its orders, which allows to open other orders in the client terminal both manually and using other experts; It has a minimum of settings. Install the Expert Advisor in two terminals: Choose MODE - SERVER on the terminal to copy

Partial Close Expert는 많은 기능을 하나의 자동화 시스템으로 결합한 도구입니다. 이 EA는 위험을 관리하고 잠재적 이익을 극대화하기 위한 여러 옵션을 제공함으로써 트레이더가 자신의 포지션을 보다 효과적으로 관리하도록 도울 수 있습니다. 부분 마감 전문가를 통해 트레이더는 부분 마감 이익을 고정하는 수준, 후행 중지 이익을 보호하고 손실을 제한하는 수준, 손익분기점 가격이 반대 방향으로 움직이더라도 거래가 중단되도록 하는 수준 및 기타 여러 기능. 이 올인원 Expert Advisor를 사용하면 트레이더는 거래를 지속적으로 모니터링할 필요가 없으므로 시간과 노력을 절약할 수 있습니다. 대신 EA는 시장 상황에 따라 미리 설정된 지침을 실행하여 거래자에게 거래에 대한 더 많은 유연성과 통제권을 제공합니다. 부분 닫기 전문가 첨부, 키보드에서 "p"를 누르고 설정을 변경하면 바로 사용할 수
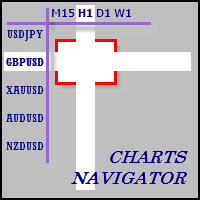
The whole market in one click! Do you value your time? Is ease of use important for you? Are you still looking for the symbol you want or do you have 100 charts open in one terminal? Forget that! Do everything in a single click, on one chart!
Advantages: Quick navigation on all the symbols and timeframes you want in a single chart window; Instant transfer to the required chart in one click; All the necessary symbols and timeframes are clearly and compactly grouped on one chart; Two navigation

The News Filter based EA Controller (NFC) is a very convenient utility to control the live trading status of your Expert Advisors during important news events. The NFC was programmed to prevent all Expert Advisors of live trading during significant news events. The NFC is resource-efficient and uses the Forex Factory Calendar. It is not necessary to set offset hours dependent on your broker, it will be done by the NFC. The NFC was successfully used and tested under MetaTrader 4 on a personal com
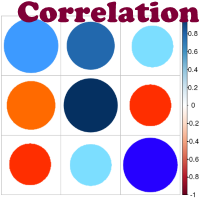
Advantage The analyzer provides an opportunity to examine correlation in history, for example, for the previous month excluding the current one, thus allowing you to evaluate symbol movement in history. It can be conveniently used in conjunction with LineSyncMirrorChart analyzer. Charts are synchronized by a market type: Forex, CFD, Futures, and Indices. The analyzer calculates the distance covered by the price on a specified period in points. The tool fits pairs and portfolio traders.
Descrip

Master Trend Dashboard is a new generation indicator, compact, light and efficient. Each element of this Dashboard is designed to return specific signals as: Price Action, Breakout, Net Change (performance of the instrument), algorithmic studies, correlations and statistical calculations. This tool will change your way of trading allowing you to receive important information. See the Graphic Signals to understand every single signal below:
Graphic Signals Symbol name and arrow color Green = Cu

Constructor is a convenient tool for creating, (building strategies) testing and applying trading strategies and ideas, as well as testing and using separate indicators and their groups.
Constructor includes opening, closing, deal tracking, averaging and recovery modules, as well as various trading options with and without averaging and martingale. You are able to connect up to 10 different external indicators. Find the detailed instructions in the attached pdf file.
Trading settings
averag

Found a great signal, but a provider's lot is too small? You need larger position volume, but terminal settings are too poor? SignalLotEnlarger will increase the provider's position volume by means of a duplicate order of the needed volume. Just set a lot size and a name of a signal for copying orders from. This is the version with extended functionality, the lite version can be found here: https://www.mql5.com/en/market/product/8117
With the Pro version you can:
disable copying new orders f
The BOSS (Binary Option Super System) indicator is a ready TRADING SYSTEM for binary options. The system is designed specifically for the currency market and for the traders who operate on the web-terminals and the MetaTrader 4 platform. This is a counter-trend system, i.e. it is based on the assumption that the price of a traded asset revert sooner or later, and the final trade will cover the previously incurred losses and make a profit. Signals of the system are not redrawn, they appear once t

RSI Breakout Dashboard is a tool for multiple currency pairs analysis at the same time in terms of breakout (return) from Oversold or Overbought Zone to Neutral Zone.
All displayed and used by indicator symbols are free to choose and are specified using a space separated list in parameters, so you're able to analyze not only predetermined ones, but everything that your broker offers, also commodities, equities, indices, ones with prefixes, suffixes etc.
You can choose 3 types of al
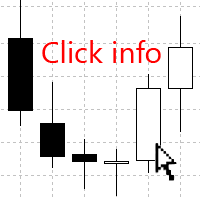
The Click Info is a simple utility that allows the trader to quickly receive information about the High, Low, Open, Close, Time values of the current chart. In order to receive information about a bar, it is necessary to left-click the selected candle. Depending on the settings, either a pop-up Alert or a Comment with the information appears. Information on the bar values (High, Low, Open, Close, Time) can be extremely useful in practice of trading using graphical analysis, evaluation of the Pri
Everyone has their own style, for example, color of candle, color of chart blackground, used indicators, EAs, and script tools etc. If you often use a template to load your favorite style, you should already know that manual loading is cumbersome when using multiple charts. Now, you can use this tool to work better and faster. Magician Of Template (MOT) is a utility script tool for MetaTrader 4. After attaching the script to a chart, one template will auto load to all charts. The template should
Tipu Parabolic SAR Dashboard is based on the Tipu Parabolic SAR indicator. Please contact me here at MQL5 if you would like to use this panel for your custom signals. Tipu Parabolic SAR Dashboard is a multi-currency, multi-timeframe panel created to help traders in analyzing the markets quickly using the Parabolic SAR indicator signal. The dashboard panel is designed to help traders quickly change symbols and periods. If you are constantly missing trade opportunities while browsing through the

This simple script deletes all objects on the chart while keep record of them in order to re draw them when uses the free Objects Show script. In order to use it, just drag and drop the script over a desired chart when you want to hide (delete) its objects. Using the combination of Objects Hide and Objects Show scripts you can hide (delete) and later show all the graphical objects in your chart. This script do not have full support for Gann related objects. As this script removes all objects fro

This panel is a part of the SupDem-Pro trading system and is used to search for the best opportunities for any available instruments. Which can be selected manually in the Market Watch (open it with CTRL + M). Using this trading panel in combination with ShvedSupDem-Pro_Zone allows to analyze multiple currency pairs with a single click. The panel allows to load any instruments from the Market Watch, from 6 major currency pairs up to all instruments (480).
The indicator parameters Button Width

The Five Minutes indicator is a ready TRADING SYSTEM for binary options. The system is designed specifically for the EURUSD M5 currency market with at least 80% payout and for trades who operate on the web-terminals and the MetaTrader 4 platform. This is a counter-trend system, i.e. it expects the price of traded asset to reverse. Signals of the system are not redrawn, they appear once the formation of the previous bar is completed, and are equipped with a sound notification. For decision-making

It is good to know the presence of a trend on multiple timeframes at once. And even better - on multiple currency pairs at once. This indicator allows to quickly determine the presence of a trend or a flat on 8 timeframes and from 1 to 15 currency pairs at once. Multi Alligator Signals analyzes the signals of the Alligator indicator by Bill Williams on every timeframe (from M1 to W1) and multiple currency pairs (up to 15) simultaneously. If there is a buy signal, a green upward arrow is drawn, i

Automatic lot calculation per stop level: calculates the lot considering the risk. It is possible to enter a percentage of the deposit and set the line to the planned stop level. As a result, the lot for entry will be calculated. Also, the TakeProfit level will be calculated taking into account the profit/loss ratio, and their profit/loss in the deposit currency. Thus, the final result of the trade can be seen, which is an integral part of successful trading.
Features The indicator displays th

Unlimited Binary Options Copier Remote is a powerful tool to copy binary options trades remotely between multiple accounts at different locations over internet. This is an ideal solution for signal provider, who want to share his binary options trades with the others globally on his own rules. One provider can copy trades to unlimited receivers and one receiver can get trade from unlimited providers as well. The provider can set the subscription expiry for each receiver, so that receiver will no
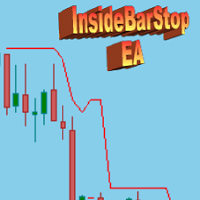
This Export Advisor implements the trailing stop algorithm "Trailing Stop with Inside Bars" that was suggested by the famous German trader and author Michael Voigt ("Das grosse Buch der Markttechnik") to capture robust gains when trading strong price moves. It is used for semiautomatic trading. You open a position manually and apply the expert to the chart. It modifies your order by setting a stop loss according to the trailing stop algorithm. Your trade direction (Long/Short) is detected automa

This is an Expert Adviser use for manual trading as a background EA or combine with external EA to open orders. Loss Recovery Trading is one of your options to handle the lose positions instead of using stop loss by setting a zone recovery area and target to exit the turn rounds sequence.
How It Work? If the market goes against your first positions direction at the specific of losing points, the EA will open an opposite direction position with calculated larger lot size and also keep the first
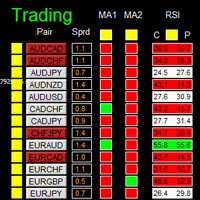
如果产品有任何问题或者您需要在此产品上添加功能,请联系我 Contact/message me if you encounter any issue using the product or need extra feature to add on the base version.
There is Demo version of this panel Dashboard Super MA RSI CCI Demo in my product list, pls try it out to get familiar with all functionalities free . Dashboard Super MA RSI CCI is an intuitive, and handy graphic tool to help you to: Have 28 pairs under control with one dashboard Monitor price movement, identify possible trend based on MA, RSI, and CCI
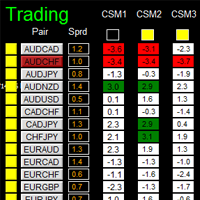
如果产品有任何问题或者您需要在此产品上添加功能,请联系我 Contact/message me if you encounter any issue using the product or need extra feature to add on the base version.
Dashboard Super Currency Strength is an intuitive, and handy graphic tool to help you to: Have 28 pairs under control with one dashboard. Monitor price movement, identify possible trend based on currency strength gap of two currency on 3 timeframe. Provide trading signals based on the CSM (currency Strength Meter) selected. Manage order automatically on
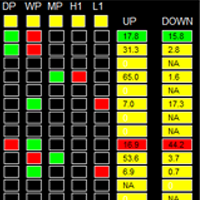
如果产品有任何问题或者您需要在此产品上添加功能,请联系我 Contact/message me if you encounter any issue using the product or need extra feature to add on the base version.
Please re-direct to LINK for free demo version. There are two critical components in a profitable trading system, one is entry (place an order), and another one is exit (close an order). You can exit by time: closing order after London Close for example. You can also exit by position: closing an order when price reaches a certain support/resistance leve
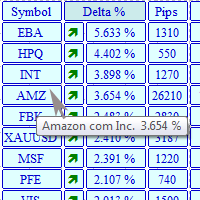
The MarketView utility is designed to display the market changes in percents as a table over the specified time interval. Every column element can be disabled. The color scheme can be easily and quickly customized for your needs. The number of symbols in columns can be adjusted ( PerColumn ). The MarketView also allows to open chart of any symbol by simply clicking its name. It can automatically apply any customized template to the newly opened chart. Attention! In order to remove any symbol fro

Close all opened orders of All charts at defined values... You can define Stop Loss and close pending orders. This EA is setup to close All orders of All charts.
Settings useTP - True/False (use it to close all opened orders at defined TakeProfit) TP - defined take profit to close opened orders useSL - True/False (use it to close all opened orders at defined StopLoss) SL - defined stop loss to close opened orders PendingOrders - True/False (close pending orders with all orders after reaching

This trading panel has been developed for fast and comfortable operation of the financial markets. It is equipped with the necessary functions for manual and semi-automated trading. Due to the presence of the order trailing feature, trailing stop and automatic closure by equity, profit, time. You can use it to automate your trading system. All you have to do is open a position and set the parameters for maintenance, everything else will be handled by the EA. If you want to limit your losses, set
Scalper Positions Analyzer - the tick history may be necessary for development of trading strategies and market analysis.
Setup Open a chart of any currency pair. Open the Navigator window. Drag the indicator to the chart of the currency pair. Enable sending information (MainMode = true). Open "File". Select "Open Offline". Open an offline chart of the currency pair with the name that appeared on the main chart (for example, R_EURUSD).
Drag the indicator to the offline chart. Enable receiving
如果产品有任何问题或者您需要在此产品上添加功能,请联系我 Contact/message me if you encounter any issue using the product or need extra feature to add on the base version.
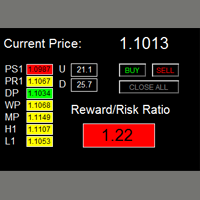
There are two critical components in a profitable trading system. One is entry (placing an order) and another one is exit (closing an order). You can exit by time: closing order after London Close, for example. You can also exit by position: closing an order when price reaches a certain support/resistance level. Easy RR Monitor Panel is an intuitive, an

The Profit Loss Control Panel is a tool designed to control loss and profit in trading. It allows to close deals if profit and/or loss of positions opened on the account reaches a certain limit.
Limit types Percentage of balance Number of points Deposit currency Thus covering the most popular list of reasons to close the deal. The panel allows to combine limits of various types, for example, limit loss as a percentage of the deposit and limit profit in deposit currency. Limits as a percentage
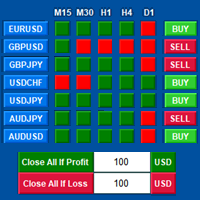
Tools designed for multi-currency trading.
You can customize which currency you want to trade, analyze up to 10 currencies by yourself. Note: Demo version for testing can be found here: https://www.mql5.com/en/market/product/17796
Analysis method. (Refer to screenshot 1) Ultimate dashboard analyzes trend strength from six major time frames: M5, M15, M30, H1, H4, D1 Show the result in graphic format. You can identify which currencies have the best strength, trend.
One click trading panel. (
MyBreakeven Expert Advisor automatically moves a position to breakeven. The EA works both with all open positions and with a certain order. The robot allows moving a position to breakeven in several modes: Points - move a position to breakeven when reaching a certain profit in points. To work in this mode, fill in the SizePoints field in the inputs; Summ - move a position to breakeven when reaching a certain profit in deposit currency. To work in this mode, fill in the SizeSumm field in the inpu

MFI Breakout Dashboard is a tool for multiple currency pairs analysis at the same time in terms of breakout from Oversold or Overbought Zone . Money Flow Index (MFI) uses both price and volume to measure buying and selling pressure. MFI is also known as volume-weighted RSI (Relative Strength Index). The number of displayed symbols is 30 and the name of each symbol can be edited in the parameters. The analyzer is perfect for alert notifications, push notifications and email alerts. We can also se

MFI Extremes Dashboard is a great tool for quickest possible analysis of multiple currency pairs in terms of Oversold or Overbought at the same time. Money Flow Index (MFI) uses both price and volume to measure buying and selling pressure. MFI is also known as volume-weighted RSI (Relative Strength Index). The number of displayed symbols is 30 and the name of each symbol can be edited in the parameters, so we are able to analyze not only predetermined currency pairs, but also other ones, commodi

Technical Dashboard is a great tool for quickest possible analysis of multiple currency pairs in terms of coherent conditions of 4 different indicators at the same time. The number of displayed symbols is 30 and the name of each symbol can be edited in the parameters, so we are able to analyze not only predetermined currency pairs, but also other ones, commodities, equities, indices, currency pairs with prefixes and suffixes etc. This analyzer is perfect for alert notifications through the MetaT

Dax Scalping Bracket is a new generation Expert Advisor Panel. This a very professional tool for SCALPING. The usability makes this tool an excellent ally for FAST operations of SCALPING on Index instruments and Forex market. The main feature of this EA is the ability to open multiple operations with a single click. Each position is autonomous and you can set different take profit and stop loss for each position. Special functionalities: STOP MOVE to manage your stop chasing the price BREAK EVEN

Professional and highly customizable utility for automated trading. It can become an indispensable to any trader regardless of the skills. It will help to save the time that would be required for daily routine activities and it will allow to develop custom strategies. The utility can also work manually opened orders and orders opened by any other EAs. This can be applied to attempt to recover the losing trades or even save the trader form losing the deposit. The utility allows to automate the tr
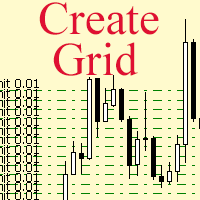
The script allows to use the mouse for placing a grid of orders with fixed or variable step quickly and with as few mistakes as possible. Drag the script to the chart using the left mouse button and release. The grid will be plotted starting from that point. If the current price is lower than the grid start point, the grid will be placed "to the north" towards the buys, and if higher - towards the sells, "to the south". Setting take profit and stop loss is left to trader's discretion.
Input Pa
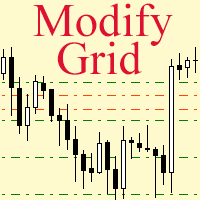
Модифицируйте тейк профит и стоп лосс сети ордеров с помощью мыши. Перетащите скрипт на график левой кнопкой мыши и отпустите. Скрипт выставляет всем рыночным и отложенным ордерам раздельно, единый стоп лосс и единый тейк профит, используя величину цены в точке окончания перетаскивания.
Входные параметры Buy or sell - Ордера какого типа подлежат модификации. Возможны два варианта: All BUY - все ордера на покупку All SELL - все ордера на продажу По умолчанию значение этого параметра All BUY. Wh
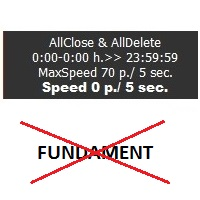
Sensor utility is a tool for protecting the capital against unexpected market movements. Today's markets are unpredictable. Are you afraid of big moves? This tool monitors the movements of the market and may remove pending orders or open positions while increased volatility. The utility works with the actual movement of the market. The indicator works on all timeframes. You are not limited by use of different timeframes, the indicator is able to adapt. On the screenshots, you can see basic setti
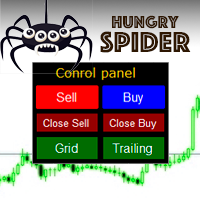
Hungry Spider EA is a convenient trading panel and a useful assistant to manage your trades and to set a grid of orders ( not pending orders ) with a push notification option.
Hungry Spider is a trading panel to help you save time while trading. The EA does not open orders, but it sets a grid. The grid then opens at actual prices without using pending orders. The grid can be turned on and off in a single click. The EA includes a Trailing Stop function, which can also be activated in a single cl

Great for scalper/intraday weapon for your ease daily trading. Scalper weapon will suit's you for any trading condition, whether it's intraday / scalper this tool is important for you which providing the missing function on the native MT4 platform. You have to check Allow Auto Trading by pressing Ctrl+O, going to Expert Advisors tab, and checking " Allow automated trading" . also to ensure the " auto trading " is green.
Input Parameters _MINIMIZED_AT_START: to chose whether the panel is minimi

Scaler is a simple technical indicator that plots a rectangle in your chart and tells you how many pips it represent. Scaler is ideal for traders that use intraday charts to give them the sense of size of a price movement. There are only two parameters: Scale Color: Sets the color for the rectangle Font Color: Sets the color for the Scaler's text. Scaler automatically changes the size of the rectangle in order to represent the same proportion of the chart Scaler automatically adjusts the pips si

The Parabolic SAR Trailing is a utility that provides a trailing stop based on the Parabolic SAR indicator. Moving the stop loss order according to the values of this indicator is considered to be the most popular solutions for trailing, as this trend indicator follows the price. The utility can work with deals on all trading instruments or on the selected instrument. Thanks to the Magic parameter, it is possible to provide joint operation with other experts and management of the stop loss order
A new way of managing your trades – efficiently, automatically and with no emotions. Control various markets and manage many different trades at one moment. Grasp your competitive advantage and ultimately find out what profitable trading looks like! Trademanager is a piece of software developed for MT4 platforms. This tool enables you to completely set up all parameters for many different trades on many different markets – at one time and with no emotions as psychological obstacles. Must-need to

Market Pressure Dashboard is a new generation utility. Its main function is to assist you and give you operational ideas optimizing your analytical work. Using this utility you could monitor a lots of financial instruments (max 28 symbols FOREX) in a very simple way. The Market Pressure indicator allows you to customize the internal list of the symbols to be monitored. The opening function and position management with this panel will be much more comfortable and navigation charts very powerful.
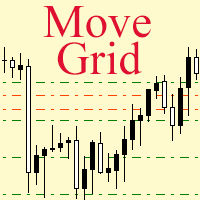
If a complex grid with specified stop loss and take profit levels has been created in the wrong place by mistake, it is not necessary to remove it and start over again. The grid can be moved to a new place using the mouse. Drag the script to the chart and drop it where the grid should be moved. The grid will be moved, keeping the distance between orders, distances to stop loss and take profit. The script works exclusively with pending orders , market orders will be left unchanged.
Input Parame
MetaTrader 플랫폼 어플리케이션 스토어에서 MetaTrader 마켓에서 트레이딩 로봇을 구매하는 방법에 대해 알아 보십시오.
MQL5.community 결제 시스템은 페이팔, 은행 카드 및 인기 결제 시스템을 통한 거래를 지원합니다. 더 나은 고객 경험을 위해 구입하시기 전에 거래 로봇을 테스트하시는 것을 권장합니다.
트레이딩 기회를 놓치고 있어요:
- 무료 트레이딩 앱
- 복사용 8,000 이상의 시그널
- 금융 시장 개척을 위한 경제 뉴스
등록
로그인
계정이 없으시면, 가입하십시오
MQL5.com 웹사이트에 로그인을 하기 위해 쿠키를 허용하십시오.
브라우저에서 필요한 설정을 활성화하시지 않으면, 로그인할 수 없습니다.