 MetaTrader 5
 Experts
 지표
지표 라이브러리
라이브러리 유틸리티
유틸리티 위젯
위젯 규칙
규칙MetaTrader 4용 Expert Advisor 및 지표 - 129
 트레이딩 로봇은 자동으로 시장거래를 수행하는 반면 지표는 가격을 더 잘 분석하고 가격 행동을 예측할 수 있게 해줍니다.
이러한 어플리케이션을 사용하면 MetaTrader 4에서 더 많은 기회를 포착하는 동시에 보다 정보에 입각한 방식으로 거래를 수행할 수 있습니다.
트레이딩 로봇은 자동으로 시장거래를 수행하는 반면 지표는 가격을 더 잘 분석하고 가격 행동을 예측할 수 있게 해줍니다.
이러한 어플리케이션을 사용하면 MetaTrader 4에서 더 많은 기회를 포착하는 동시에 보다 정보에 입각한 방식으로 거래를 수행할 수 있습니다. 
Olofofo Fx Scanner is a Custom Indicator created to scan through the currency pair it is being attached to in the market on ALL time frames simultaneously from a Minute to Monthly looking for just 3 things that make Forex trading exciting and worthwhile to invest in. Once these are found, it alerts the User immediately for a timely action on the part of the Trader. This is a self-fulfilling prophecy of the market, meaning that even if you are a newbie, by the time you see the graphical display o

This simple indicator helps defining the most probable trend direction, its duration and intensity, as well as estimate the possible range of price fluctuations. You can see at a glance, at which direction the price is moving, how long the trend lasts and how powerful it is. All this makes the indicator an easy-to-use trend trading system both for novice and experienced traders.
Parameters
Period - averaging period for the indicator calculation. Deviation - indicator deviation. Lag - calculatio

Real Trend Lines is an indicator that calculates trends using a set of channels and using a set of algorithms. This indicator helps to find trend return points. It generally represents an oscillator. This trend tracking system helps the investor to understand small or large trends and determines the direction according to it.
Trending features Up trend Rule 1 - yellow trend line should be below zero level. Rule 2 - the yellow trend line should be in the green and orange channel. Rule 3 - the tr

This tool is developed to make your trading risk and profit management easier. It is able to move all of your opened transaction's take profit and stop loss on to one similar price.
How to use Draw a trend line/horizontal line and name it to "tp_" as the take profit line and "sl_" as the stop loss line. The EA will modify all of your orders' and pending orders' take profit and stop loss to the given line. You can drag the gray box to drag the line. You can see the risk in the account currency

This is the multi-time frame Fisher Divergence indicator for MetaTrader 4, with signal arrows and a Signals panel which is freely movable showing the last signals and their time in color. The indicator draws some lines based on signal time. On the time frames below H4, the indicator scans for H4 divergence signals and draws it on chart with thick trend lines, and also it draws arrows for them. And also it scans the current time frame and draws a line at divergence location and places signal arro

Super oscillator indicator is an oscillator designed to calculate trend reversal points. A set of bar calculations and a set of algorithms to calculate trend reversals. Level probing system with high probability trends. All of these features combine to make it easier for investors to find trends.
Suggestions and Features There are two levels on the super oscillator indicator. They are at levels of 0.5 and -0.5. The oscillator bar should be below -0.5 to find the upward trend. And a blue color t

OneWayTicket indicator is based on CCI indicator. In fact, it analyzes multiple CCIs from several timeframes. There are four Ways of OneWayTicket, read from left to right - 15 min, 30 min, 1 hour and 4 hours. The idea is to enter the market when all four CCIs agree on a trend. A trader chooses which timeframes to monitor. When all four ways of the OneWayTicket are green - Buy . When all four ways of the OneWayTicket are bright red - Sell . Original idea from the author: tageiger, revised for the
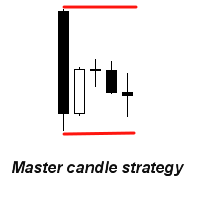
Features This is an indicator that recognizes a special type of Inside Bar formation which is formed by a Master candle followed by 4 smaller candles (please see the strategy explanation below). Plots buy/sell stop lines on the chart as well as well as take profit and stop loss levels. The TP/SL levels are based on the Average True Range (ATR) indicator. Object colors are changeable. Sends you a real-time alert when a Master candle formation is identified - sound / pop-up / email / push notifica
This multi time frame and multi symbol indicator scans for Pin bars, Morning/Evening stars, Engulfings, Tweezers, Three line strikes, Inside bars and Pennants and Triangles. The indicator can also be used in single chart mode. Please read more about this option in the product's blog . Combined with your own rules and techniques, this indicator will allow you to create (or enhance) your own powerful system. Features
Can monitor all symbols visible in your Market Watch window at the same time. App

The indicator shows the market turning points (entry points).
Reversals allow you to track rebound/breakout/testing from the reverse side of the lines of graphical analysis or indicators.
Reversals can be an independent signal. The indicator allows you to determine reversals taking into account the trend and without it. You can choose a different period for the movement preceding the reversal, as well as the volatility coefficient. When plotting reversals, the indicator takes into account volati
This Expert Advisor uses ATR as CORE indicator for GRID operative.ATR measures intrinsec volatility. Using ATR on a GRID, you will give enought space between lines considering current volatility.
On this EA, you can set ATR period and timeframe parameters, and also you can set a ATR multiplier factor, to increase margin between each GRID level. In the same way, you can also configure the number of GRID levels (up and down) as well as the color of the drawn lines.
In addition, it has a start/en

This indicator is designed to filter trends. Using the RSI indicator we know. It is aimed to confirm trends with this indicator. Can be used alone. It can be used as an indicator to help other indicators. He is already a trend indicator. You can confirm the signals given by other indicators according to your strategy with this indicator. The RSI Trend Filtering indicator confirms trends using a number of complex algorithms. Red below trend zero represents the downward trend. If trend is blue abo
This multi time frame and multi symbol indicator identifies high-probability breakout patterns. It does this by identifying strong, symmetrical pennants and triangles. This pattern DOES NOT appear very often on higher time frames. But when it does, it is a very high-probability setup. The indicator also includes an Inside bars scanner. It can for example be used to detect a special type of Inside bars formation which is formed by a Master candle (MC) followed by 4 inside candles (please see the
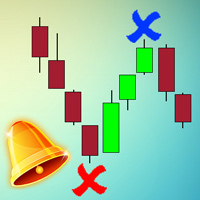
The MACD_stopper_x2 indicator shows where the trend has a tendency to stop or reverse. It uses the standard MACD indicator and a proprietary formula for processing data obtained from MACD. There are 2 types of stop/reversal signals: Small cross - probability of a trend stop/reversal is 70-80% Large cross - probability of a trend stop/reversal is 80-80% If there are open trades (for example, BUY) on the symbol the indicator is attached to, and the BUY trend ends, the indicator sends push notifica
"저는 시장이 전환할 때 가장 큰 돈을 벌 수 있다고 믿습니다. 모두들 고점과 저점을 고르려다 죽는다고 하는데, 저는 중간에서 트렌드를 따라가면 돈을 벌 수 있다고 생각합니다. 저는 12년 동안 중간에 있는 고기는 놓쳤지만 고점과 저점에서 많은 돈을 벌었습니다."
- 폴 튜더 존스 -
트레이딩 전략: 추세 반전 또는 되돌림 시 시장 진입. 통화쌍: EUR/USD. 권장 최소 입금액: 0.01랏당 $100.
운용 설명 Trend Raptor에 사용되는 독점 거래 전략은 Kalinka Capital OU (에스토니아)라는 회사의 트레이더가 개발했습니다. Trend Raptor는 자동 외환 거래를 위한 효율적이고 리스크가 없는 전문가 자문입니다.
Trend Raptor의 주요 기능 중 하나는 EA가 예측한 시장 상황에 따라 이익을 취하고 지정된 네 가지 매개 변수 중 하나를 적용하는 유연한 접근 방식입니다.
Trend Raptor는 진입 시점을 매우 정확하게 결정합니다. 트레

This is a complex indicator for developing custom trading strategies. It can also sort out already existing strategies. The initial objective of the indicator was to combine a couple of indicators. After combining 12 indicators, I realized I need to implement the ability to separate them as well as arrange the signals from the built-in indicators and systems. The indicator provides signals as buffer arrows: 0 - buy, 1 - sell. The contents of the complex indicator:
Indicators Let me know if you

Super signal series trend arrows is an indicator designed to generate trading signals. This indicator uses a number of different indicators and generates a signal using a number of historical data. It generally tries to calculate the trend return points. These trend returns may be sometimes very large, sometimes small. The investor should act with the belief that the signal may be small. Monthly median produces 5 to 10 signals. These signals vary according to market conditions. The signals do no

Colored trend indicator is a trend indicator that uses Average True Range and Standard Deviation indications. It is aimed to find more healthy trends with this indicator. This indicator can be used alone as a trend indicator.
Detailed review 4 different trend colors appear on this indicator. The blue color represents the upward trend. The dark blue color has a tendency to decline after rising from the rising trend. The red color represents the declining trend. The dark red color has a tendency

Box martingale system is an indicator designed to trade martingale. This indicator sends a signal from the highest point where the trend is likely to return. With these signals the user starts the trades. These signals appear in the form of a box. The user can see from which point the signal is given. The important thing in trading martingale is to find a good starting point. This indicator provides this starting point.
Trade rules Start processing when the first trade signal arrives. The impor

The arrow indicator 'Magneto Flash" is based on candlestick analysis and does not use built-in terminal indicators. It determines entry points in the current candlestick (a signal can be canceled) and informs about a confirmed signal on the next candlestick.
Indicator setup and use Only two parameters can be used for optimization - the hour of the beginning and end of chart analysis period. These data for some instruments will be available in product comments page, but you can easily find your

The Expert Advisor implements the Fibonacci level trading. Pending orders (Buy Limit, Sell Limit) are placed at levels ~38.2,~50.0 and ~61.8. The grid of pending orders is built following the trend . Orders are closed by the total take profit or stop loss.
Settings and Inputs Risk: Risk - risk (<0.01 - low, >0.01 - high); Levels for placing pending orders: Level1 (0 - don't set) - level 1 (~38.2%) 0 - do not place a pending order Level2 (0 - don't set) - level 2 (~50.0%) 0 - do not place a pend

This indicator provides useful information for quantitative analysis. It compares the 28 pairs' pips of the current day with the average of pips made in the previous three days. When in the last three days the pips value is low and the value of today's pips is below, we are in the presence of a volatility compression that will explode soon. The "Range Today" is red if today's figure is less than the range of the previous three days, but turns green when the percentage exceeds 100%. When the rang

Easy to handle and use. Only the basic functions and nothing excessive. Due to simplicity of th algorithm integrated in the EA, it is suitable for virtually all Forex brokers. It can even be used on cryptocurrencies such as Bitcoin, Ether and the like. It has also been tested on metals, stocks and many other instruments. What is the algorithm inside the EA? First of all, it is a trader's find that allows using a unique the unique inefficiency of the market, which occurs only once in a while but

The EA has two strategies, each designed for a particular market behavior. Using both strategies allows you to cover a significant range of trading time and get high and stable results. The Channel strategy is based on the principle of scalping within the channel bounds, during periods of low volatility. (Modified strategy from version 1.1) Trend strategy builds on the principle of following the trend in during the high volatility hours. (New Strategy) The trading periods are selected based on t

The MACDVolume indicator is a trading system based on the increase in tick volumes in bars, which match the trend.
Indicator Parameters Fast Moving Average - period of the fast moving average; Slow Moving Average - period of the slow moving average; MA method - averaging method of the moving averages (simple averaging, exponential, smoothed and linear-weighted); Apply to - applied price of the moving averages (Close, Open, High for the period, Low for the period, Median, Typical and Linear-Weig

This indicator consists in two different algorithms, in order to profit all fast movements created during noises of the market.
First of all, it plots normalized trend bands to can filter the possible trades. The normalized trend bands are calcualted using an exclusive mathematical algorithm to has both the correct trend and the fast adaptability to the change of trends.
With those bands you can know when you are inside the trend, or when you are outside. The second alhorithm uses a private fo

This is an efficient and yet simple Expert Advisor not using indicators, which can determine the following: the future direction of movement of quotes, their strength, trade levels for the current and next trading day. The Expert Advisor runs on the "here and now" principle, which means that the EA tracks a lot of parameters of the price behavior in real time. Based on this Expert Advisor, a certain trading strategy was developed and tested in real time. The ELEMENTARY strategy consists of three

The Stubborn Scalper indicator can run in any currency pair and at any time interval. The larger the time interval, the less false signals are obtained. Always choose a larger time interval for healthy signals.
Trade rules Turn on the Buy action when the Stubborn Scalper indicator turns blue and the trend up warning is displayed. The Stop Loss is set to the level at the end of the green circle. Turn off the operation when the Stubborn Scalper indicator is green or red. Turn on the Sell action w

MACD Temp is a system of two oscillators, which allows to track the price changes of the Fast and Slow periods in case of their convergence/divergence. The bar border is colored in accordance with the MACD trend, while the color of the histogram changes when the values of the Momentum indicators cross the level of 100, for respective periods: Fast Moving Average (Fast Momentum), Slow Moving Average (Slow Momentum), selectively or for both values (the mode is to be chosen in the indicator propert

The axiom of the Forex market is that any trend will be broken. The Expert Advisor determines trend direction (the pink line), and calculates levels for opening opposite orders depending on the settings. The value of Away from the trend line for Deal will be different for each pair and timeframe, depending on the volatility of the trading instrument. Next orders can be opened with an increased lot (a static lot is used by default). See the screenshots to understand the idea of the Expert Advisor

The Expert Advisor finds strong trend movements of a currency pair over the specified number of bars. It also finds correction to this trend (for the same period). When the trend is strong enough, and the correction becomes equal to the values specified in the EA parameters, the Expert Advisor opens the a trade in the trend direction. The advantage of this is that the EA will not buy at the trend maximum or sell at its minimum - trhe EA only trades after correction. However, you can set differen

Alan Hull's moving average, more sensitive to the current price activity than the normal MA. Reacts to the trend changes faster, displays the price movement more clearly. No Repaint Version on separate Windows shows the trend 1 and -1 . Improvement of the original version of the indicator by WizardSerg <wizardserg@mail.ru>. Suitable for all timeframes.
Parameters Period - period, recommended values are from 9 to 64. The greater the period, the smoother the indicator. Method - method, suitable v

This indicator uses Donchian channel and ATR indicators. This trend tracking system uses historical data to buy and sell. This indicator does not repaint. The point at which the signal is given does not change. You can use it in all graphics. You can use it in all pairs. This indicator shows the input and output signals as arrows and alert. Open long deals on blue arrows Open short deals on red arrows When sl_tp is set to true, the indicator will send you the close long and close short warnings.

Slide Trend is a simple indicator that shows a trend and allows for easy and fast navigation between charts. It was designed for quick analysis and aids you to scroll very fast through all the charts in the inputs list. The minimalist graphic allows receiving data on trend on D1, W1 and MN timeframes. The Trend feature (in the inputs) allows you to filter and view only the most powerful symbols. In this case, the circles are all of the same color. This indicator is a utility that speeds up navig
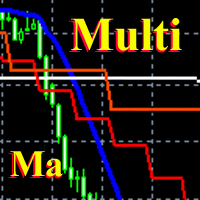
This is a fully multi timeframe version of the Moving average standard indicator, which works for any combination of timeframes. The indicator allows quickly and effortlessly viewing the charts from different timeframes at the same time. You can create and set of intervals and freely switch to a higher or lower one. At the same time, the selected charts will always be displayed in a correct time scale. The interaction of the short-term and long-term trends will be clearly visible, and it will al
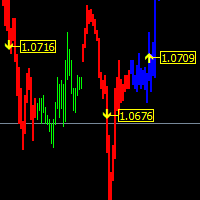
The main function helps you trade in the direction of the trend D1. All this make it Become One trend trading system easy to use for beginners, advanced and professional traders. This indicator will give you a new perspective and it suggests you a decision on the market. The indicator is equipped with a pop-up and audio alert. This indicator creates a very important that optimizes the entry points. We are very happy to have created this indicator and we hope it will be useful to all.
Features D
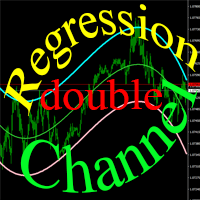
Trading robot for a real account. It is a continuation of the idea used as the basis of the popular Regression Channel EA. Unlike its predecessor, it uses a bidirectional trading algorithm. The robot trades inside a channel formed by regression curves. Deals are always by stop losses.
Strategy Features The robot trades inside a trend channel bound by the curves of a polynomial regression. The trend direction and strength are determined by the gradient of the channel cures during the trading. Ma

MMM Ichimoku EA strategy: The robot uses its built in Ichimoku indicator all the time and does a calculation to determine the prices trends. If it indicates the price will be bullish, it sends a buy order. If the indicator indicates the price will be bearish, it sends a sell order; It will not send an order unless the calculations determines a good trend of profit; Like all MMM products it is also programmed to minimize your losses and protect your money from the hostile market. We have protecti
Strx Super Grid is a grid system with many advanced features. It places the first 2 orders as BUY_STOP and SELL_STOP distanced from current price by the GridPoints specified; when an order becomes active, the other is canceled. User can also choose to open immediately a position or a pending order via the new FirstImmediateOrder input. If GridPoints is 0 (default), grid is auto-sized based on last 500 bars (max-min closes) divided by MaxOrders input parameter. If trade becomes profitable, after

This indicator is based on ADX, RSI and CCI. Each indicator show trend arrows on each timeframe. If all arrows are in the same trend, the SELL/BUY signal is the strongest.
Settings Spread Threshold - value of spread threshold ADX Setup ADX Period ADX Price - price of ADX (Close, Open, High, Low, Median(High + Low)/2, Typical(High + Low + Close)/3, Weighted(High + Low + Close + Close)/4). Level of ADX Trend - ADX level Strong of ADX Trend - ADX for Strong Signal RSI Setup M1...MN period Price -

Neurone is a trend strategy based on neural network analysis.
Strategy Description The strategy is based on the algorithm of a self-learning neural network. The idea of the algorithm was taken from a famous demonstration of artificial intelligence training in the game with 11 matches. The trading day is divided into 6 trading intervals, which are associated with the H4 candles. Each candle withing a day is a neuron. The history data associated with the neuron are passed as input for the neurons

The MACD TrendMA indicator is a trading system developed on the basis of the MACD indicator popular among many traders, and which is based on measuring the inclination (trend) angle of the moving averages, while measuring the ratio (convergence/divergence) between them. The signal for entering/exiting the market is the frame of the bars colors and color of the MACD TrendMA histogram according to the trend, which can be customized in the properties window of the indicator - in case the inclinatio
Gold Digger Martingale Robot is a fully automated scalping Expert Advisor based on Heiken Ashi, Moving Average and Ichimoku Kinko Hyo. Each entry point is calculated using an advanced entry filter based on Price Action by following the trend.
Advantages Money management system. Indicators are Heiken Ashi, Moving Average and Ichimoku Kinko Hyo for filter sideway and scalping by following the trend. Easy to set up.
Requirements Symbols: XAUUSD H4. Minimum deposit: $500. Leverage: 1:400-1:500. An

Multi Feature Robot suit for trading in semi automatic mode. The robot uses Heiken Ashi indicator to form signals. It provides two options for trades. 1. Heiken Ashi trade - use signal trade for buy and sell. 2. Reverse trade - use Heiken Ashi stop loss for buy stop and sell stop. Also, provide additional feature for a trader which is: 3. Trend line trade - use trend line for buy and sell. This trend line trade feature is not for fully automated trading because it needs trend line input. Trader

This indicator can determine the current direction of the market and the most probable future direction on the basis of its own algorithms which only analyze the price action. The indicator calculates and displays current buy/sell levels, as well as required buy/sell levels for a balanced movement. The indicator generates buy/sell signals. These signals can be filtered both manual and automatically, and you can also enable both filters.
Features fast, convenient, easy working wherever possible
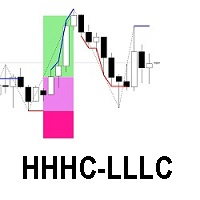
The HHHC-LLLC indicator uses candle by candle analysis, based on the principle of trend confirmation from Higher High, Higher Close candles (bullish) and Lower Low, Lower Close candles (bearish). There is no lag, no re-painting, and averaging is not used. HHHC-LLLC helps confirm: market structure and levels - look left to see them line up trends, pullbacks & reversals Bull moves (blue), Bear moves (red) Structure Zig Zags (black dotted lines), for summarizing market moves exhaustion and stalling

MMM Momentum EA strategy: The robot uses its internal Momentum indicator all the time and does a calculation to determine the prices trends. If it indicates the price will be bullish, it sends a buy order. If the Stochastic indicator indicates the price will be bearish, it sends a sell order; It will not send an order unless the calculations determines a good trend of profit; Like all MMM products it is also programmed to minimize your losses and protect your money from the hostile market. We ha
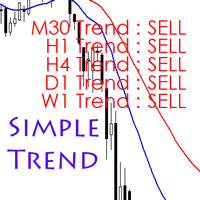
According to experts, trading against the trend is said to be hazardous, and perhaps sometimes it is a mistake that we easily make. Simple Trend Info is designed to display the trend of an asset class on different time frames and assists in minimizing trading against the trend. It uses the conventional moving averages to determine whether the trend is bullish or bearish and displays the trend on the screen. The time frames are limited to 5 options and you can adjust them as per your needs. The d
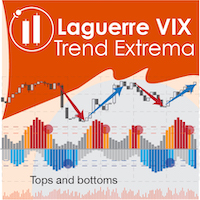
The Laguerre VIX Trend Extrema (LVTE) indicator detects market tops and bottoms. As its name suggests, LVTE is a percentage price oscillator that identifies extreme ranges in market price. How to use: Buy when the indicator was in the lower "blue" range for more than 2 candles, and then moves up into grey. Sell when the indicator was in the upper "red" range, and then moves down into orange. Please see screenshots for examples! To make it simple, the indicator can show this by paint

A High Frequency Trading System, which trades when the market is at very high volatility. It uses several unique indicators to detective the price fluctuation in very short terms, open an order when a breakthrough takes place, and capture several pips instantly within a few seconds. Every pending order has a inherent stoploss, and every existed order has a trailing stop to preserve the capital. Please notice that the performance of the EA depends heavily on your choice of Broker and VPS. It is

HC candlestick pattern is a simple and convenient indicator able to define candle patterns. Candlestick charts are a type of financial chart for tracking the movement of securities. They have their origins in the centuries-old Japanese rice trade and have made their way into modern day price charting. Some investors find them more visually appealing than the standard bar charts and the price action is easier to interpret. Hc candlestick pattern is a special indicator designed to find divergence
The Expert Advisor tries to enter the market at the beginning of a trend. If the price moves in the unfavorable direction, the EA hedges the deal by placing an opposite order with a larger volume. The EA will change direction in the course of the trend until it is captured. The minimum distance for changing direction is specified by the Min Turn Step parameter, the actual distance can be longer and depends on the current volatility, it is controlled by the Mult Factor Next Orders parameter. The
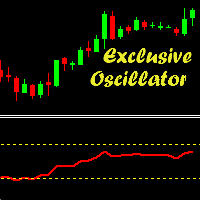
Exclusive Oscillator is a new trend indicator for MetaTrader 4, which is able to assess the real overbought/oversold state of the market. It does not use any other indicators and works only with the market actions. The indicator is easy to use, even a novice trader can use it for trading. Exclusive Oscillator for the MetaTrader 5 terminal : https://www.mql5.com/en/market/product/22300
Advantages Generates minimum false signals. Suitable for beginners and experienced traders. Simple and easy

This indicator is designed for trend trading and it helps in determining the best entry points. To identify the points, it is necessary to follow the signal line. Once the line crosses the zero level upwards - buy, and when it crosses downwards - sell. In addition to the signal line, the indicator also displays the so-called market "mood" in real time in the form of a histogram. The indicator works on all timeframes and with all instruments. The indicator operation required the Moving Average in

Advisor uses 6 trading strategies you can customize each strategy separately. Powered by 7 pairs and 1 timeframe M1 and uses a variety of trading systems. This increases the chances of stable growth and reduces the influence of one pair. The robot uses intelligent averaging system. Advisor is able to self-adjust their work. Instead of searching for values satisfying historical prices for each pair, the adviser uses the values effective on all cylinders, which increases the likelihood of good

Flow Of Lines
The indicator calculates and shows on a symbol chart trend channels, as well as the price movement channels, each of which corresponds to its specific timeframe. This method provides easy analysis of long- and short-term trend movement dynamics. In addition to all of the above, the indicator displays breakouts and the presence of a strong trend in the digital format (on the right top of the table). The lines that serve as the channel borders, can be at the same time used as certai

NewsBreaker EA is an News Trading EA and tries to trade short-term trends during the announcement of important economic news.
Benefits The EA has its own Magic number and is ideally suited to complement other EAs No martingale, no grid, no hedging Equity protection by dynamic hidden Stop Loss and Break Even function Inputs start hour hour broker server time, in which the EA starts the trading period start minute minute broker server time, in which the EA starts the trading period end hour hour

Face smiling trend indicator is an oscillator designed to search for turning points. Face smiling trend indicator represents an oscillator that uses in his work an average price for a certain period and is designed to determine the price reversal points. Face smiling trend indicator oscillates between 0.00 (oversold) and 105 (overbought) values depending upon market conditions. Red bars suggest bearish pressure and blue bars bullish pressure. Typically, a reversal of the trend occurs when achiev

Undefeated trend indicator, an indicator that uses MacD and Bollinger bands. It is a coded indicator to find trends. It finds these trends by its own algorithm. This indicator requires visual monitoring. It does not give any warning because it needs visual follow-up. The main trendline should turn down to find the down trend. The main trend line should go under the white line and then go under the yellow line. The main trendline should turn upward to find the upward trend. The main trend line sh

The MACD CloseBars indicator is a trading system based on the MACD indicator popular among many traders, which is built on the principle of bars closing above the moving averages selected in the indicator settings. The signal for entering/exiting the market is the frame of the bars colors according to the trend: in case the bars in the main window of the chart are closed above/below the Fast Moving Average, Slow Moving Average individually or both together.
Indicator Parameters Fast Moving Aver

The Grid Inside works on a counter trend mode, automatically opens a new order when it hits the price target due to the Fibonacci levels at 23.6 and 73.6. If the price goes the wrong way it opens another order with a calculated lot and position. All the positions are closed when it reaches the target profit defined on settings. As TGI does not use stop loss, I don't recommend you put on your account more than you can afford to lose, the higher the timeframe safer it gets. Once an order is trigge
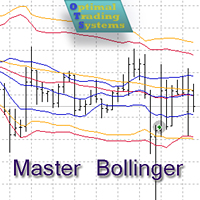
The Expert Advisor opens and closes positions using Bollinger Bands signals: it buys on lower bands when price rolls back, and it sells on upper bands. It has the option to close positions by an opposite signal, by take profit and stop loss, move a trade to breakeven upon reaching the central Bollinger band or after a certain price movement. Many good strategies use one or more Bollinger Bands indicators. In this EA, it is possible to use up to 3 such indicators. When using the first and second

The ”Trend Guess” is a complex software that does not involve the MACD, RSI or moving averages. It adapts itself to current market conditions using complicated algorithms based on price action and out custom indicators. The indicator will gives you trading signals Buy or Sell stop loss levels indicated in the popup alert window and graphically. You have to do is to press buy or sell button whenever you get a signal
Important Rules Identify a current long term trend. Example – if you trade on a

MMMStochastic EA strategy: The robot uses its built in Parabolic SAR indicator all the time and does a calculation to determine the prices trends. If it indicates the price will be bullish, it sends a buy order. If the indicator indicates the price will be bearish, it sends a sell order; It will not send an order unless the calculations determines a good trend of profit; Like all MMM products it is also programmed to minimize your losses and protect your money from the hostile market. We have pr

Centaurus Trend Engine is an indicator that uses custom indicators to give the current momentum moves of the market with a multi-timeframe approach to trading Features Value Area -It is the (red/green) rectangular box on your chart based on the dynamic structure period set;Green to indicate you focus on LONG moves & Red for SHORT moves Analysis - Displays The Market Analysis Strength - Displays The Market Strength Trend - Displays The Market Trend Entry State - Displays the BEST entry time for t

Strong trend indicator is a special indicator designed to capture healthy signals. There are lines showing the signal of the indicator and the power of buying and selling. The signal line is yellow. The green lines are Buy lines. The ones that are brown are Sell lines. The green line must close above the yellow line to perform the operation. The brown line must close above the yellow line to sell. The important line is the first one that closes above the yellow line. If the first line is green,
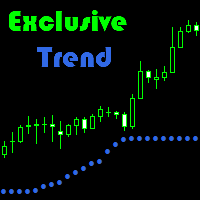
Exclusive Trend is a trend indicator that can be used for scalping, as well as intraday trading.
Advantage of indicator: Generates minimum false signals. Perfect for scalping. Simple and easy indicator configuration.
Recommendations on usage It is recommended to use the indicator during session movements to reduce the likelihood of falling into flat. Period M1 to D1. Trending currency pairs: GBPUSD, EURUSD, AUDUSD.
Signals for Position Opening: Open Buy when the indicator is blue. Open Sell w

use on EURUSD use on M5 price and indicator analysis. Deals is in the direction of the trend. analysis 4 TimeFrame. Price and MovingAvarage (MA) are analyzed at TF EA. Market conditions in each TF are analyzed separately, then the overall picture. The algorithm shown in the screenshot below Sets is in Comments
Advantages Advisor is optimized well for any instrument Can work on accounts with any spread, commissions, delays in the execution of orders Flexible settings specifically for your needs

How the EA works (simple explanation) Trades on M5 timeframe Uses H1 timeframe to analyze global market context Analyzes 2 or 3 timeframes simultaneously On each timeframe: Checks price position relative to one or two Moving Averages Evaluates MA angle and distance between price and MA Entry logic is based on trend + volatility conditions , not on random signals
The full algorithm is illustrated in the screenshots. Recommended usage Symbol: EURUSD Timeframe: M5 Trading

The Extreme point indicator helps in determining the probable price reversal points on the chart. The indicator facilitates the search for points to enter the market with greater accuracy. The indicator displays certain impulses, after which there is a high probability of the price continuing its movement in the same direction. The indicator can be used in conjunction with other indicators for a more accurate detection of the position entry points. The indicator can also be used independently. F
MetaTrader 마켓은 과거 데이터를 이용한 테스트 및 최적화를 위해 무료 데모 거래 로봇을 다운로드할 수 있는 유일한 스토어입니다.
어플리케이션의 개요와 다른 고객의 리뷰를 읽어보시고 터미널에 바로 다운로드하신 다음 구매 전 트레이딩 로봇을 테스트해보시기 바랍니다. 오직 MetaTrader 마켓에서만 무료로 애플리케이션을 테스트할 수 있습니다.
