모든 주문
 규칙
작업 종료됨

명시
Dear Honorable Programmers,
I am trying to summarize what I would like to reach after programming my idea.
Complete documentation is going to be provided for all Applicants.
The aim of the document is to provide the Programmer with sufficient information about my idea in order for it can be faster understood and easier programable.
Basically I use Trader Dynamic Index (TDI) indicator to make trade decision. TDI indicator is well-known indicator among the forex traders as it is an ’all-in-one’ indicator.
I would like to use this indicator -according to my interpretation- for that the signals to be shown on the charts.
a) TREND
DIRECTION
There are two rules that should be built in the indicator:
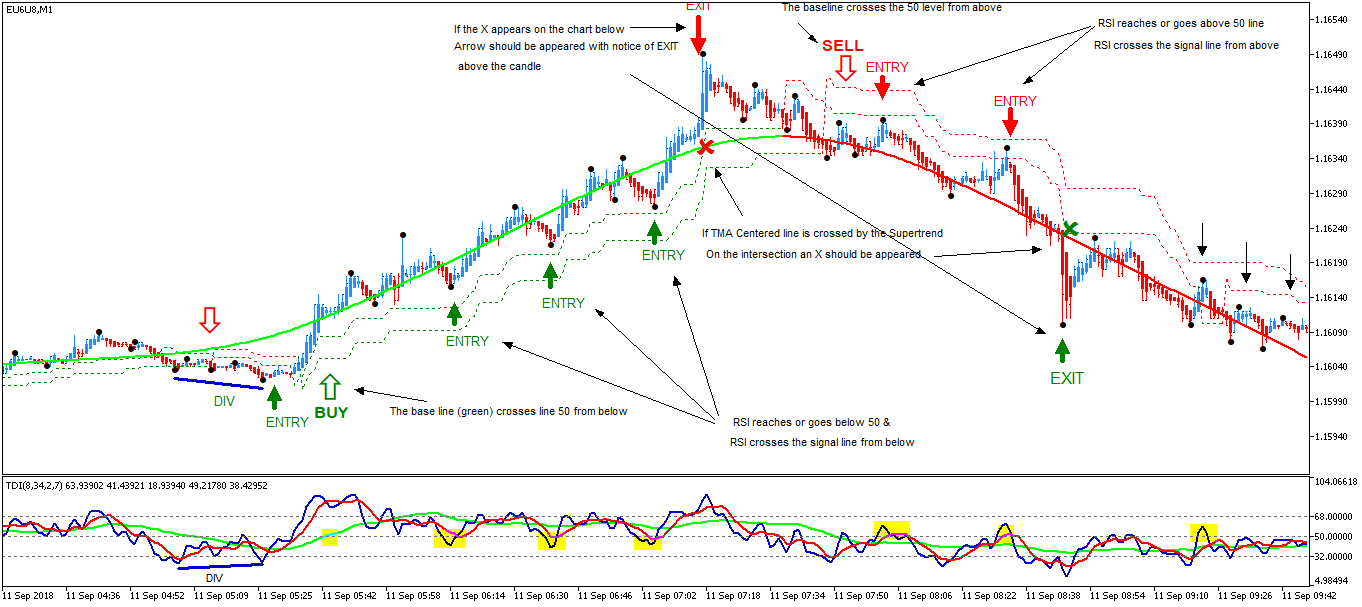
i) If the Market Base Line crosses line 50 from below-----> BUY
ii) If the Market Base Line crosses line 50 from above-------> SELL
The two marks next to the a) point show the applicable marks on the chart. It conforms to the applicable marks of Metatrader 5
Some example can be found in the attachment. Fig.1
b) ENTRY INTO A TRADE
There are four (4) rules that should be built in the indicator in order to get the desired result in accordance with the point a) above.
i) If RSI goes below line 50 AND RSI crosses the SL from below----à BUY ENTRY POINT signal
ii) To take into account the signal at least two (2) full body (including candlewicks from the highest to the lowest points) Heiken Ashi candles have to be below the TMA Centerred Line otherwise the i) requirement is not valid and it does not have to be shown on the chart.
iii) If RSI goes above line 50 AND RSI crosses the SL from above--àSELL ENTRY POINT signal
c) EXIT FROM A TRADE
There are several requirements to be built in the indicator in order to get the result I would like to
In LONG case:
i) If Supertrend (10,3) crosses the TMA Centerred Line from below---à On the intersection an X should be appeared.
ii) If the X appears on the chart, Arrow should be appeared with the notice of EXIT above the candle with a predefined distance.
iii) The Arrow with the notice of EXIT called EXIT mark should be above the Heiken Ashi candle and should follow the latest point of the zigzagpointer.
iv) If the Zigzagpointer reaches the latest position on the chart, the EXIT mark should stay this final position.
In SHORT Case:
i) If Supertrend (10,3) crosses the TMA Centerred Line from above---à On the intersection an X should be appeared.
ii) If the X appears on the chart, Arrow should be appeared with the notice of EXIT above the candle with an predefined distance.
iii) The Arrow with the notice of EXIT called EXIT mark should be below the Heiken Ashi candle and should follow the latest zigzagpoint on the chart below the latest candle of the zigzagpointer indicator..
iv) If the Zigzagpointer reaches the latest position on the chart, the EXIT mark should stay this final position
Additional Requirements:
i) If the intersection between the TMA Centerred Line and the Supertrend disappears on the chart - as the TMA Centerred Line is always changing-, the X mark on the intersection as well as the EXIT mark should vanish from the chart.
ii) Contrary to the i) point, the X on the intersection should stay in the final position when the Supertrend has crossed the TMA Centerred Line last time.
DIVERGENCES:
d)
I need only the classic
divergences to be marked on the chart. See the inserted pictures and charts in
the document.
Some preferences:
ii) The number of candles should be maximum 40 between two defined candles. I do not care about divergences with more than 40 candles involved.
iii) Preferred marking on the chart : A simple straight line between two zigzagpoints with the notice of DIV below or above the line as you can see on the attached pictures.
e) Colouring of „GAPS” between TMA Centerred Line & TMA Bands
As I define in the Basic terms, TMA Bands should be above or below TMA Centerred line.
The GAP between them should be coloured, only the GAP.
There can two GAPS be found on the charts.
1. Gap between the TMA Centerred Line (60) and TMA Centerred Bands arrow (small gap)
2. Gap between TMA Centerred Line (300) and TMA Bands (60) (big gap)
Rules:
· As soon as a starting gap occurs on the chart, it should be marked with a previously selected colour.
· From the moment of the cross-àfrom the moment the gap appears
· Up to the GAP is closed.
Remarks:
· The GAP (like a Moving avarage) always moves—increases or decreases its area untill it is closed within the set parameters
· I need only marking of the GAP!
· If the GAP disappears, the Marking(colouring)should be disappeared, too.
The following situations should generate sound alerts:
- ENTRY ALERTS
- EXIT ALERTS
a) ENTRY ALERTS: This parameter should be set on the panel.
ON/OFF and the type of the sound
b) EXIT ALERTS: possibility of setting
a chosen sound on the panel.
ON/OFF and the TYPE OF THE SOUND
5) ENTRY-SUPPORTING MINI-EXPERT
I would like to have a mini expert in which If the precondition is according to my interpretation depending on the chapter 3.b ENTRY into a Trade, it will open a position with a predefined risk.
a) OPEN A POSITION àOrder type: Market Stop Loss order
If the Buy Entry Point appears, the Expert shall have to open a LONG position
· in Market price
· in the following Heiken Ashi reverse candle. Blue- àRed
· with the predefined risk where the STOP LOSS level should be below the lowest point of the previous candles+Spread (E.g. below the point given by zigzagpointer indicator)
If the Sell Entry Point appears, the Expert shall have to open a SHORT position
· in Market Price
· in the following Heiken Ashi reverse candle. Red àBlue
· with the predefined risk where the STOP LOSS level should be above the highest point of the previous candles + spread (E.g. above the point given by zigzagpointer indicator)
Risk: given in the form of a percentage (eg. 2%) I want to give my risk parameter in percentage format on the panel. For example 2% per trade, and the expert has to calculate how many lots/contracts to add a stop order on the fastest way. If I set 0 %, the expert has to open position with only one (1) lot/contract.
b) MANAGING STOPLOSS AND RISK
a) Before switching the mini expert, I want to set the following:
i) Time stop: X x time unit (eg. 10 Min.)
This is a predefined value, informing me about how many candles have to appear before the expert has to pull the stoploss into the entry point in other words into zero level. (If possible)-àbreakeven
iii) If price goes against my position during the previously set TIME STOP, the starting stoploss will be the only protection.
iv) The expert has to manage the position with the previously set Supertrend after Time Stop
v) I want to decide whether I will use b) or not. Tru/False ----->If not, I manage my position in manual.
c) CLOSING POSITIONS
i) Automaticly by Supertrend
ii) starting stoploss with normal risk
iii) in the opening position without risk in 0
iv) Manual mode
I am attaching a picture for you having better understanding.
If you are interested in this job, please apply for it, and I will provide you with all the necessary information and written material that relevant to solving the task.
The Deadline of Application: 31 January, 2019.
If you have any question or clarification, please, contact me, and I will try to do my best in order for you get the best input of your work.
Waiting for your Application
Best Regards
KG