트레이딩 로봇 주문 방법을 보십시오
주문을 실행하거나 포스트하기 전에 규칙을 읽으십시오
MQL5 및 MQL 4의 트레이딩 로봇을 주문하는 방법
로봇을 주문하기 위해샘플 요구 사항을 보십시오
카테고리의 새로운 주문:
100 - 200 USD
30+ USD
45 - 205 USD
30+ USD
60+ USD
명시
Key Features....
.................................
*We Want TWO VERSIONS.
1. for Forex Tester 2 (.dll) file... and please note that this version doesn't have to have any data windows or, bells and whistle.. JUST AUTOMATICALLY TRADING THE STRATEGY... no vertical lines or, the other special things like the MT4 (.ex4) Version.
2. for MT4/MQL4 Language (.ex4) file BUT BUT BUT TWO VERSIONS ARE NOT REQUIRED, but, it would be nice, if you can do it, OK
*No Stop Loss
*Starting lot size .01
*Target/Take Profit(TP) 50 pips
* We want to Draw a GREEN LINE for BUY STOP or, SELL STOP by placing the GREEN LINE Above or Below the Current Price/Candle.... If Placed Above Price, BUY STOP. If Placed Below Price, SELL STOP.
*Takes the Best Trending 2 Pairs, out of 15 Pairs (All 15 Pairs/Charts must be open)
Aud/Usd Aud/Jpy Eur/Usd Eur/Jpy Eur/Gbp Gbp/Usd Gbp/Jpy Cad/Jpy Nzd/Usd Nzd/Jpy Usd/Cad Usd/Chf Usd/Jpy Xau/Usd Xag/Usd
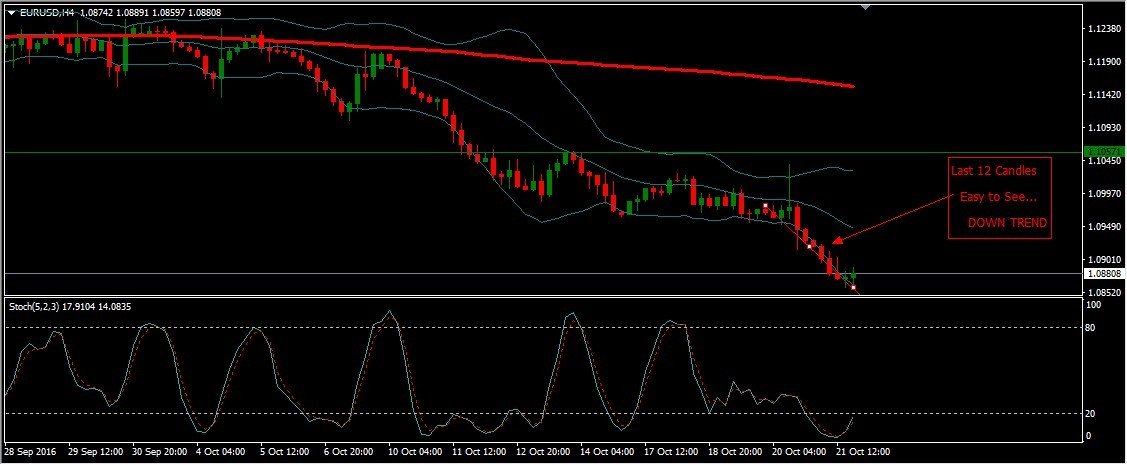
*How does it Calculate the Trend?... Answer: (Counts the last 12 Candles for each TimeFrame)... Is it UP, or DOWN Direction, based on the last 12 Candles, for each Timeframe?
*How does it Calculate which Two Pairs to Choose out of the 15 Pairs?... The Pairs with the Most Green (UPs) or, Red (DOWNs)
*If there is a Tie... Choose the Pair with the Most Pips, according to the last 3, 4 Hour Candles.
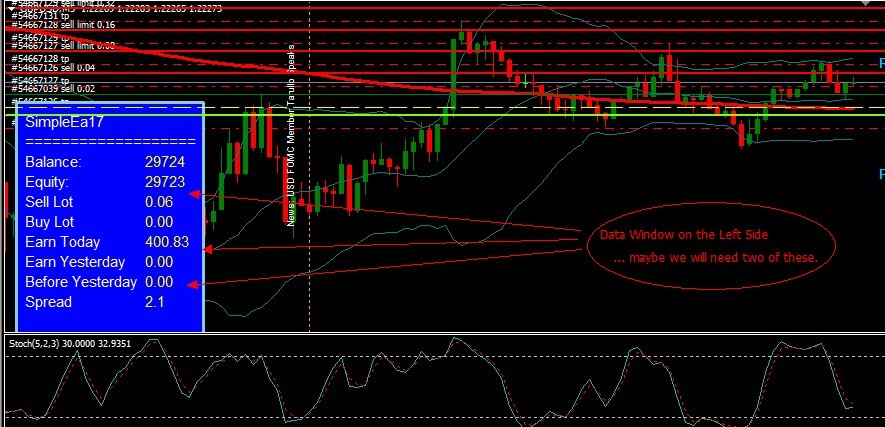
*An Example of the Information we want on the LEFT side of each chart, in 2 Data Window, for All 15 Pairs, that we trade:
AUD/USD
| CANDLES >> H1 (Arrow) H4 (Arrow) D1 (Arrow) W1 (Arrow) MN (Arrow)
| TREND >> H1 (Arrow) H4 (Arrow) D1 (Arrow) W1 (Arrow) MN (Arrow)
AUD/JPY
| CANDLES >> H1 (Arrow) H4 (Arrow) D1 (Arrow) W1 (Arrow) MN (Arrow)
| TREND >> H1 (Arrow) H4 (Arrow) D1 (Arrow) W1 (Arrow) MN (Arrow)
EUR/JPY
| CANDLES >> H1 (Arrow) H4 (Arrow) D1 (Arrow) W1 (Arrow) MN (Arrow)
| TREND >> H1 (Arrow) H4 (Arrow) D1 (Arrow) W1 (Arrow) MN (Arrow)
EUR/USD
| CANDLES >> H1 (Arrow) H4 (Arrow) D1 (Arrow) W1 (Arrow) MN (Arrow)
| TREND >> H1 (Arrow) H4 (Arrow) D1 (Arrow) W1 (Arrow) MN (Arrow)
EUR/GBP
| CANDLES >> H1 (Arrow) H4 (Arrow) D1 (Arrow) W1 (Arrow) MN (Arrow)
| TREND >> H1 (Arrow) H4 (Arrow) D1 (Arrow) W1 (Arrow) MN (Arrow)
GBP/USD
| CANDLES >> H1 (Arrow) H4 (Arrow) D1 (Arrow) W1 (Arrow) MN (Arrow)
| TREND >> H1 (Arrow) H4 (Arrow) D1 (Arrow) W1 (Arrow) MN (Arrow)
GBP/JPY
| CANDLES >> H1 (Arrow) H4 (Arrow) D1 (Arrow) W1 (Arrow) MN (Arrow)
| TREND >> H1 (Arrow) H4 (Arrow) D1 (Arrow) W1 (Arrow) MN (Arrow)
CAD/JPY
| CANDLES >> H1 (Arrow) H4 (Arrow) D1 (Arrow) W1 (Arrow) MN (Arrow)
| TREND >> H1 (Arrow) H4 (Arrow) D1 (Arrow) W1 (Arrow) MN (Arrow)
NZD/USD
| CANDLES >> H1 (Arrow) H4 (Arrow) D1 (Arrow) W1 (Arrow) MN (Arrow)
| TREND >> H1 (Arrow) H4 (Arrow) D1 (Arrow) W1 (Arrow) MN (Arrow)
NZD/JPY
| CANDLES >> H1 (Arrow) H4 (Arrow) D1 (Arrow) W1 (Arrow) MN (Arrow)
| TREND >> H1 (Arrow) H4 (Arrow) D1 (Arrow) W1 (Arrow) MN (Arrow)
USD/CAD
| CANDLES >> H1 (Arrow) H4 (Arrow) D1 (Arrow) W1 (Arrow) MN (Arrow)
| TREND >> H1 (Arrow) H4 (Arrow) D1 (Arrow) W1 (Arrow) MN (Arrow)
USD/CHF
| CANDLES >> H1 (Arrow) H4 (Arrow) D1 (Arrow) W1 (Arrow) MN (Arrow)
| TREND >> H1 (Arrow) H4 (Arrow) D1 (Arrow) W1 (Arrow) MN (Arrow)
USD/JPY
| CANDLES >> H1 (Arrow) H4 (Arrow) D1 (Arrow) W1 (Arrow) MN (Arrow)
| TREND >> H1 (Arrow) H4 (Arrow) D1 (Arrow) W1 (Arrow) MN (Arrow)
XAU/USD
| CANDLES >> H1 (Arrow) H4 (Arrow) D1 (Arrow) W1 (Arrow) MN (Arrow)
| TREND >> H1 (Arrow) H4 (Arrow) D1 (Arrow) W1 (Arrow) MN (Arrow)
XAG/USD
| CANDLES >> H1 (Arrow) H4 (Arrow) D1 (Arrow) W1 (Arrow) MN (Arrow)
| TREND >> H1 (Arrow) H4 (Arrow) D1 (Arrow) W1 (Arrow) MN (Arrow)
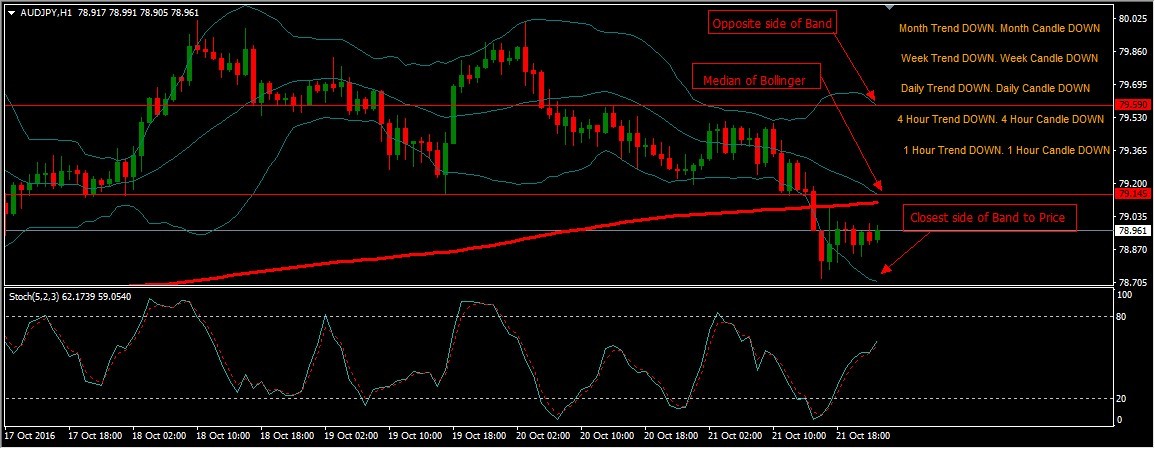
*Gets into more positions when price retraces, at certain points, also known as the Price Pull-Backs. OK First...
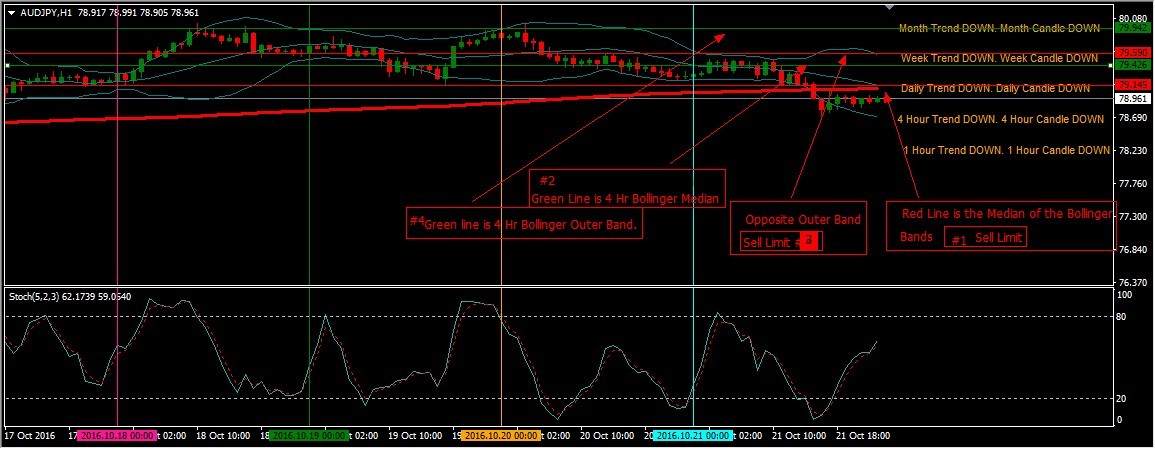
1st Position, is according to trend of the BEST TWO TRENDING CHARTS/PAIRS(Just Gets in once Calculated, going the direction of the Trend... with Option in Settings to get in after first Pull-back). 2nd Position, when it pulls back to the Middle of the Bollinger Median Point.
For Example... [See Attachment]
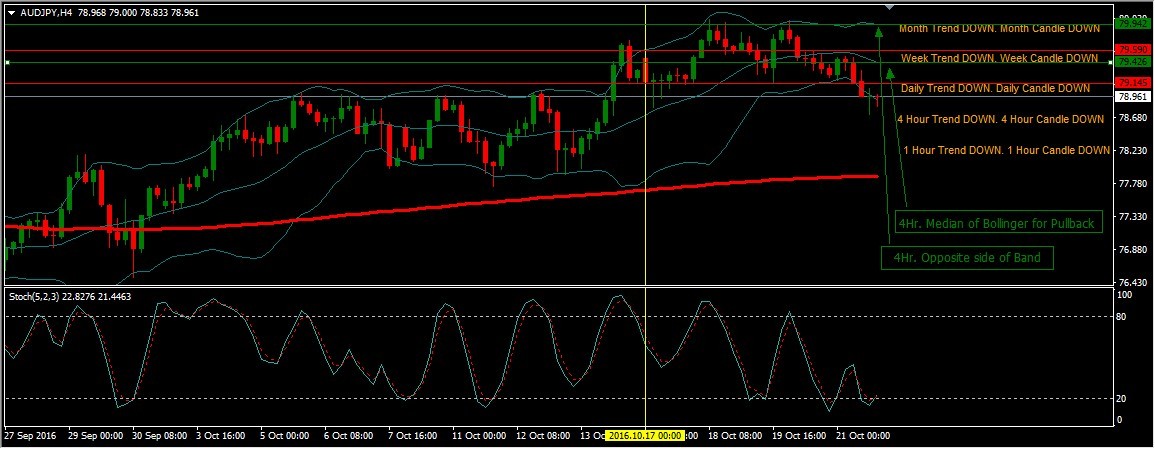
Then, Opposite Side of the Bollinger Band, from where you ENTERED a Position, According to the 1 HR. & 4HR. Charts, Median and Opposite Band(Furthest Band) Points. (We call Pull Backs, High Fives).
For Example... [See Attachment]
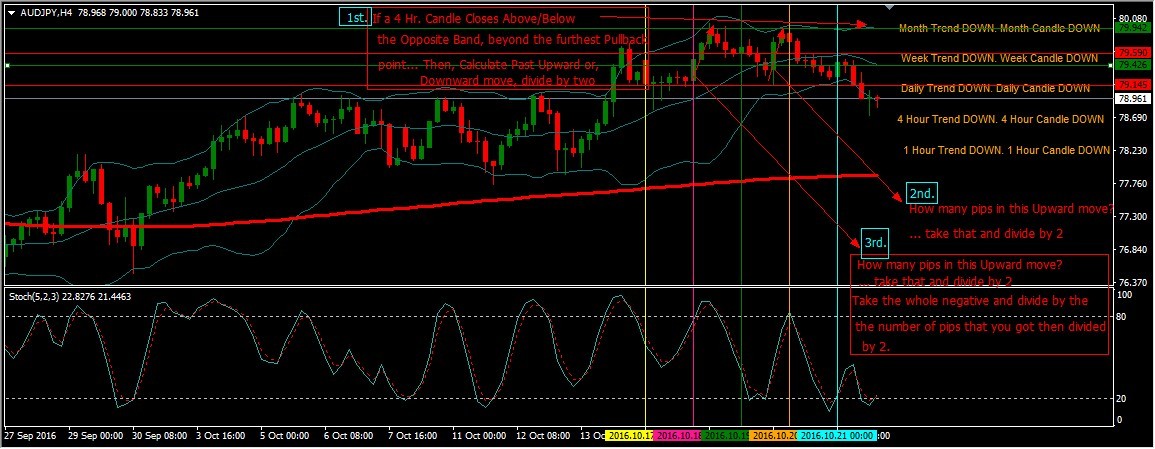
*We Will look to go the Opposite Direction ONLY After.... Price Closes Above or, Below the Opposite Point of Entry, Furthest Pullback Point, with both 1 hour and 4 hour Median ond Opposite Band Points, from where we 'started from/entered from'.
&, we need the EA to calculate how many pips the 4 Hour Candles last Move Upward or Downward was.
For Example... [See Attachment]... Please also consider position of 200 MA for 5 minute chart... Did the price cross-over 200 MA?... A sign to really look to go the opposite way.(we want the OPTION)
Also,
*Calculation Example... 0.01 in 4 negative positions... Lets say those 4 Negative Positions are: -$3.00 + -5.00 + -$8.00 + -$11.00 = -$27+ $50 Profit = $77 Goal.
80pips last Upward move / 2 = 40 pips... So, $77 / 40 = $1.93 a LOT. (.19) or, you can round up to (.20) lot size... Then, if the Price Stops going up and Goes against us again, for some strange reason after another 4 Pullback points, then the opposite way with now be (.20 LOT X 4 positions negative... example -$50, -$100, -$150,- $200) = $-500 + 200 profit = $700... 80 pips last Downward move / 2 = 40 pips... So, $700 Goal /40 pips = 17.5 a LOT (1.75 LOT size) or, you can round up to (1.8 LOT size)
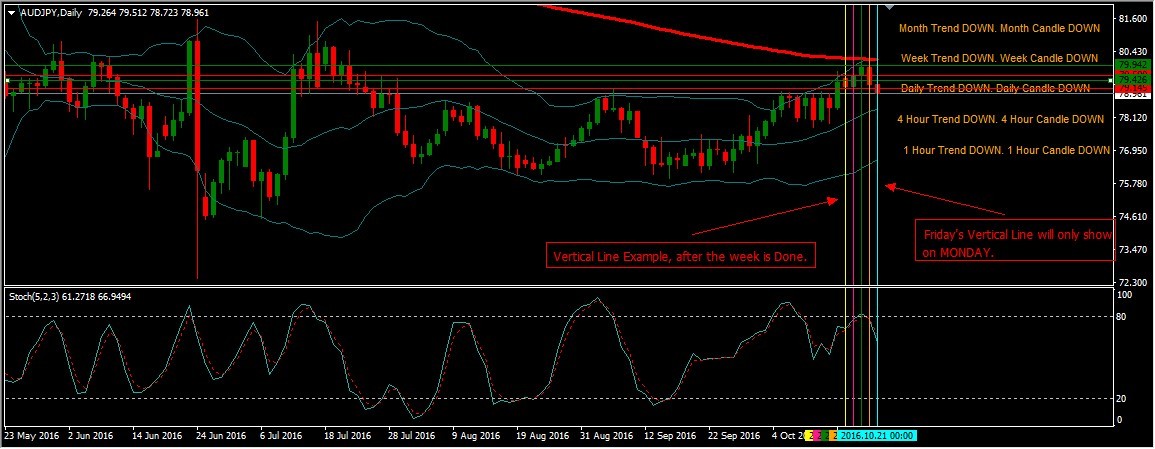
*We want Vertical lines to be drawn for Only the Current Week Only(5 days (M-F) after each day has closed/finished).
We want Monday(Yellow) Tuesday(Pink) Wednesday(Green) Thursday(Gold) Friday(Sky Blue & Friday only showed on Mondays)For Example....
*Horizontal Lines for the Closing and Opening of EACH DAILY CANDLE for the CURRENT WEEK ONLY.
For Example....
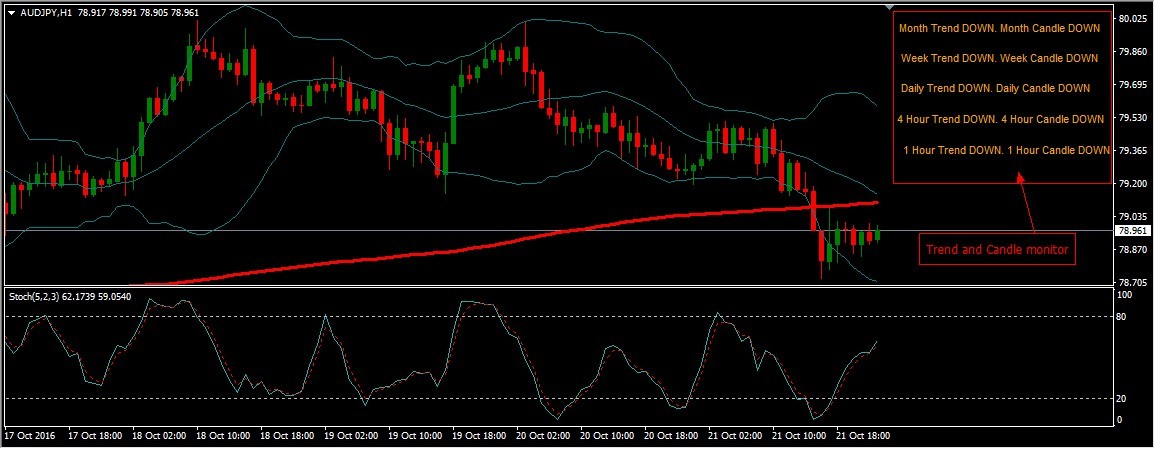
*On the Right Side of the Chart, Where it is empty after pushing (button)
We want Every Chart/Pair to Show(the BELOW) on the Right Side of the Chart:
Month Trend DOWN/UP - Month Candle DOWN/UP side note:(8 size font) (DOWN in Red) (UP in Green)
Week Trend DOWN/UP - Week Candle DOWN/UP side note:(8 size font) (DOWN in Red) (UP in Green)
Day Trend DOWN/UP Day - Candle DOWN/UP side note: (8 size font) (DOWN in Red) (UP in Green)
4 Hr. Trend DOWN/UP - 4 Hr. Candle DOWN/UP side note: (8 size font) (DOWN in Red) (UP in Green)
1 Hr. Trend DOWN/UP - 1 Hr. Candle DOWN/UP side note: (8 size font) (DOWN in Red) (UP in Green)
Also, Other Details Underneath like:
2 BEST TRENDING PAIRS/Charts(Currently)
Balance
Equity
Total Sell Lots
Total Buy Lots
Earned Today
Earned Yesterday
Before Yesterday
Spread (in pips, NOT POINTS)
비슷한 주문
Trade copier for Ninjatrader
50 - 100 USD
Hi I want a trade copier for my ninja Trader 1. It should support at least 50 followers accounts. 2. Each follower should have its own configurable quantity/risk. 3. Copier should replicate entries, stops, and take profit, order medications, and order cancellations, ect. 4. It should copy both manual and strategy trades. (As long as the follower accounts are selected to follow, it should do the exact same as the
Infinity
30+ USD
Gold Guardian EA (MT5) Entry Strategy Trade only XAUUSD. Default timeframe: M5. Buy when: 20 EMA crosses above 50 EMA. RSI (14) is above 55. ADX (14) is above 25 (strong trend). Sell when: 20 EMA crosses below 50 EMA. RSI (14) is below 45. ADX (14) is above 25. Only one open trade at a time. Risk Management Risk 1% of account balance per trade (adjustable). Automatic lot size based on stop-loss distance. Daily loss
I am looking for an experienced MetaTrader 5 expert. I already have 3 MT5 trading accounts. I need someone to: 1. Help me choose a reliable Windows VPS. 2. Connect to my VPS remotely (AnyDesk or TeamViewer). 3. Install 3 MetaTrader 5 terminals. 4. Configure: - 1 Master Account - 2 Slave Accounts 5. Install and configure a professional Trade Copier. 6. Copy all trades from the Master account to both Slave
Project: Fib Grid Entry — Automated Trading Strategy (Sierra Chart / ACSIL, C++) I need a Sierra Chart custom study (Advanced Custom Study, C++/ACSIL) that automates a Fibonacci-based split-entry strategy. The core idea: I draw a Fibonacci Retracement on the chart by hand using Sierra Chart's own Price Retracement tool (Tools → Price Retracement), and the strategy should read that drawing's two anchor points
HELANY DE GUZMAN
50+ USD
Online Ordering System para sa Milk Tea Shop* *1. Layunin ng Project* Gumawa ng website at mobile app kung saan makaka-order ang mga customer ng milk tea online. Para hindi na pumila at para mas madali i-track yung mga orders. *2. Mga Kailangan / Features* - *Para sa Customer:* - Mag-register at mag-login gamit ang email at number - Makita ang menu na may picture, presyo, at description - Makapag-customize ng
Lokingo for an Expert MT5 Indicator Developer
30 - 300 USD
I am looking for a highly experienced developer to build a professional, commercial-grade trading indicator for MT4/MT5. I am not looking for a basic indicator or a modified public script. I need a custom solution based on real market logic with high-quality coding standards. Requirements 100% Non-Repainting indicator. Accurate Entry signals. Automatic Stop Loss placement based on real market structure. Automatic
I need a custom MT5 Expert Advisor (MQL5) for XAUUSD. Strategy: 1. Trend Filter (H1) - EMA 20, EMA 50 and EMA 200. - Buy only when EMA20 > EMA50 > EMA200 and price is above EMA200. - Sell only when EMA20 < EMA50 < EMA200 and price is below EMA200. 2. Confirmation (M15) - M15 trend must confirm the H1 trend before taking any trade. 3. Entry (M5) - Wait for price to pull back to EMA20 only. - After touching EMA20, wait
Mac200
50+ USD
I need a Trend following Bot. Here we took entries by looking at two indicator which are 200 period ema and 12 26 9 MacD. Rules for entry exit are: Buy trade: When market is above 200 ema and MacD Line cross over the signal line and this cross over happened below the zero line of MacD indicator. We simply put Buy trade. Sell trade: When market is below 200 ema and MacD line crosses below the signal line and this
Multiple times EMA Crossing robot with smart entry
50 - 100 USD
I I would like to create a trading robot based on 2 ema crossing. The robot is pretty simple, it should open buy position when fast ema cross slow ema and vise versa. Also it should use martingale after the loss position. It should has expiration period inside the code and alerts l
Iconic Boy
300 - 400 USD
Am looking for a bot to trade .so that I can be able to trade and become very successful and make some profit so that I cannot sleep on a empty stomach
프로젝트 정보
예산
200 USD
기한
에서 14 로 21 일