트레이딩 로봇 주문 방법을 보십시오
주문을 실행하거나 포스트하기 전에 규칙을 읽으십시오
MQL5 및 MQL 4의 트레이딩 로봇을 주문하는 방법
로봇을 주문하기 위해샘플 요구 사항을 보십시오
카테고리의 새로운 주문:
30 - 75 USD
30 - 50 USD
명시
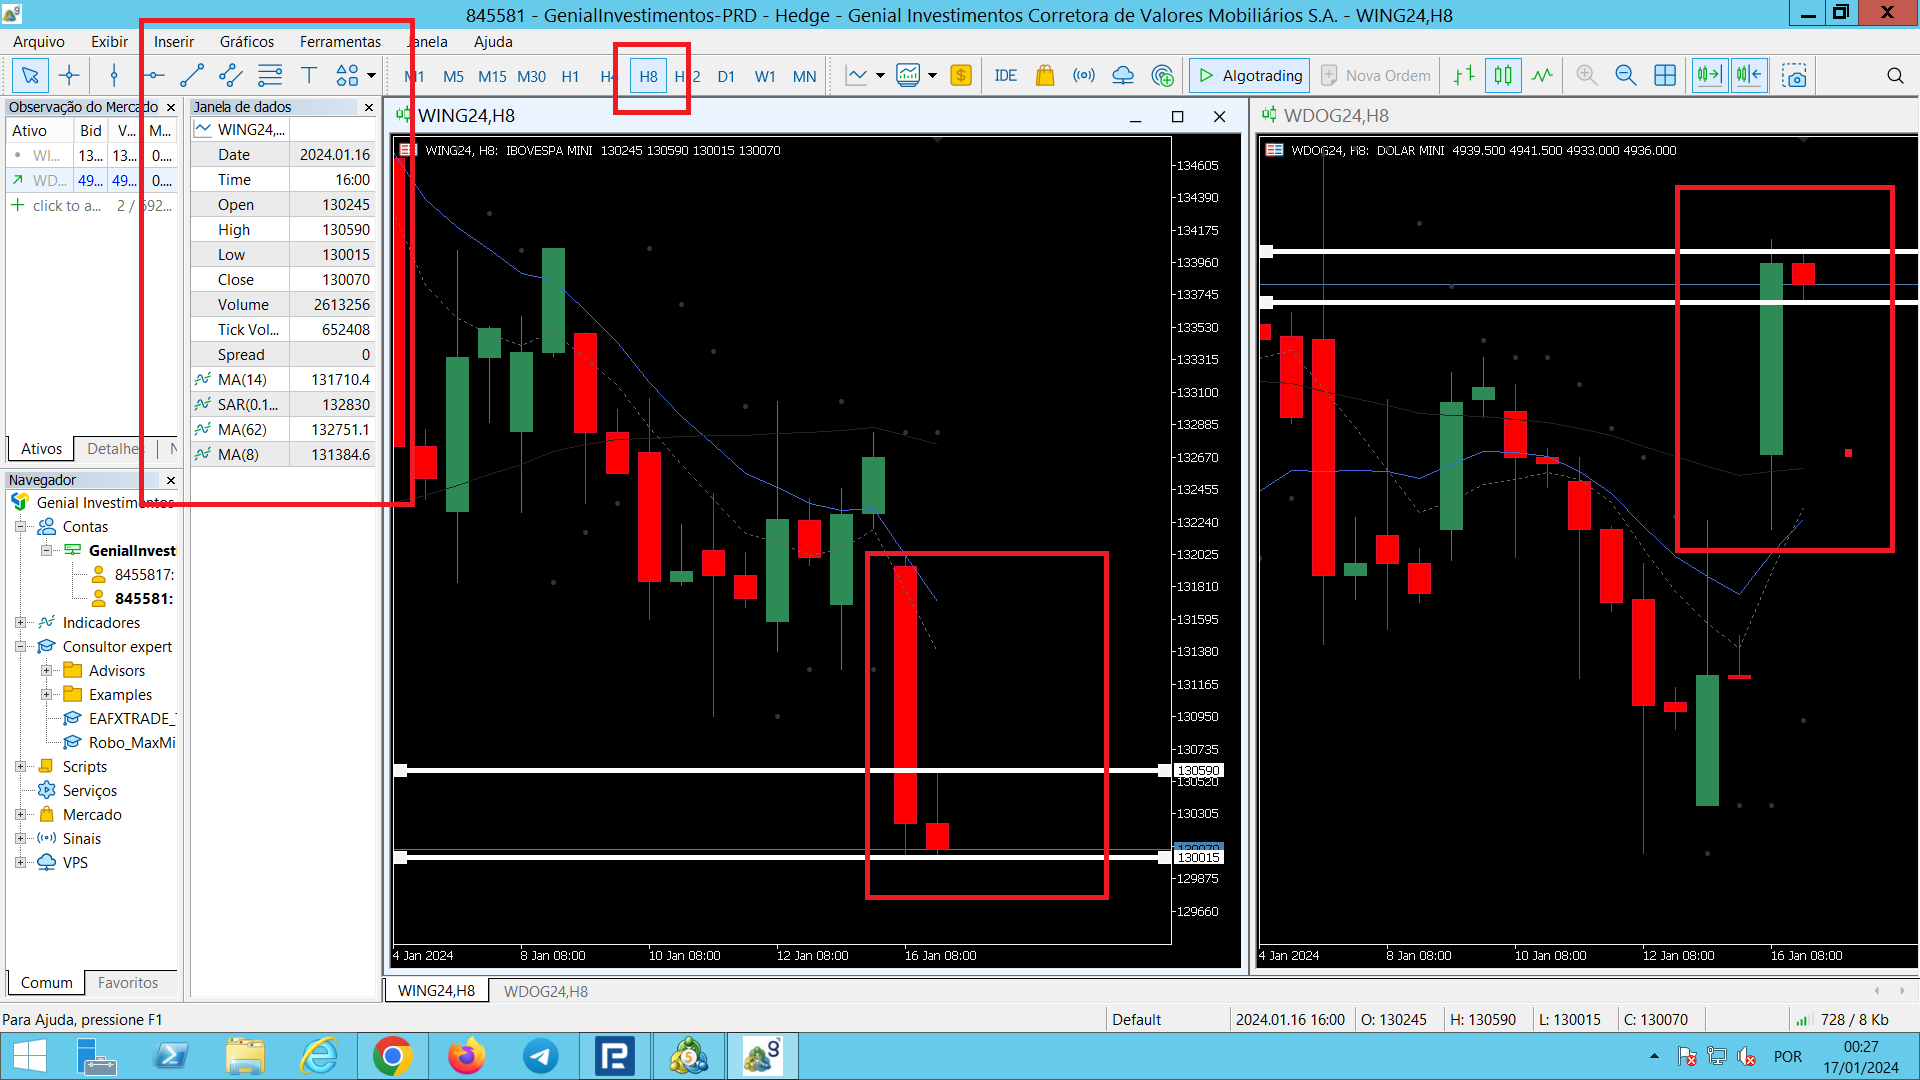
I need an indicator to visualize the maximum and minimum value of the penultimate candle on a chart in any period.
Problem:
It is not difficult to get the maximum and minimum price of the daily candle, but how to get the maximum and minimum value of the 8-hour candle? 4 hours? that's what I need,
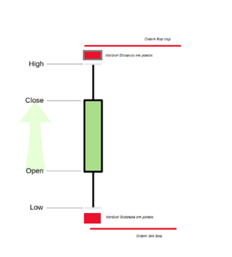
Example: According to the chart time, you have the values of the penultimate candle, as the market is closed I have the last but tomorrow it will be the penultimate. Lines can be plotted to indicate the location of
응답함
1
등급
프로젝트
51
8%
중재
0
기한 초과
0
무료
2
등급
프로젝트
478
40%
중재
105
40%
/
24%
기한 초과
82
17%
로드됨
게재됨: 2 코드
3
등급
프로젝트
638
53%
중재
32
59%
/
22%
기한 초과
6
1%
작업중
4
등급
프로젝트
17
59%
중재
2
0%
/
100%
기한 초과
2
12%
무료
5
등급
프로젝트
36
14%
중재
0
기한 초과
2
6%
무료
게재됨: 8 코드
6
등급
프로젝트
8
0%
중재
8
13%
/
88%
기한 초과
0
무료
7
등급
프로젝트
4
0%
중재
1
0%
/
100%
기한 초과
1
25%
무료
8
등급
프로젝트
0
0%
중재
0
기한 초과
0
무료
9
등급
프로젝트
945
47%
중재
309
58%
/
27%
기한 초과
125
13%
무료
10
등급
프로젝트
91
13%
중재
34
26%
/
59%
기한 초과
37
41%
무료
11
등급
프로젝트
0
0%
중재
0
기한 초과
0
무료
비슷한 주문
Hello, I need an Expert Advisor (EA) developed for MetaTrader 5, specifically tailored for the EUR/USD currency pair on the 5-minute (M5) timeframe. The robot should execute trades based on Price Action or Technical Analysis (such as Support/Resistance Breakouts or Moving Average Crossovers - I am open to the programmer's suggestions for proven, consolidated strategies). Mandatory Risk Management Requirements
PRECISO DE PROGRAMADOS BRABOS
30 - 75 USD
TENHO UM INDICADOR E EU QUERO QUE TRANSFORME ELE EM ROBÔ OU O ROBÔ FAÇA ENTRADAS COM ELE USANDO OS SINAIS DO INDICADOR. MEU NÚMERO 21969476161 SÓ CHAMAR QUE FALO DETALHADAMENTE
Preciso de uma ia baseado nisso
30 - 50 USD
quero que verifique onde o ativo teve o menor valor de mercado, depois cada vez que o ativo estiver com o menor valor de mercado quero que você faça a compra de 0.3 do ativo EURUSD e faça a venda quando atinger o maior valor com base nos ultimos 366 dias
I'd like to know if anyone knows how to create such an indicator for a future project. I need help creating my own indicator, but I don't know how it works behind the scenes, how the calculations are done, so I'm looking for someone to help me
프로젝트 정보
예산
30 - 100 USD