명시
Hello Everyone,
I will be happy to get a developer to design an Expert Advisor/ Robot that will work according to this template.
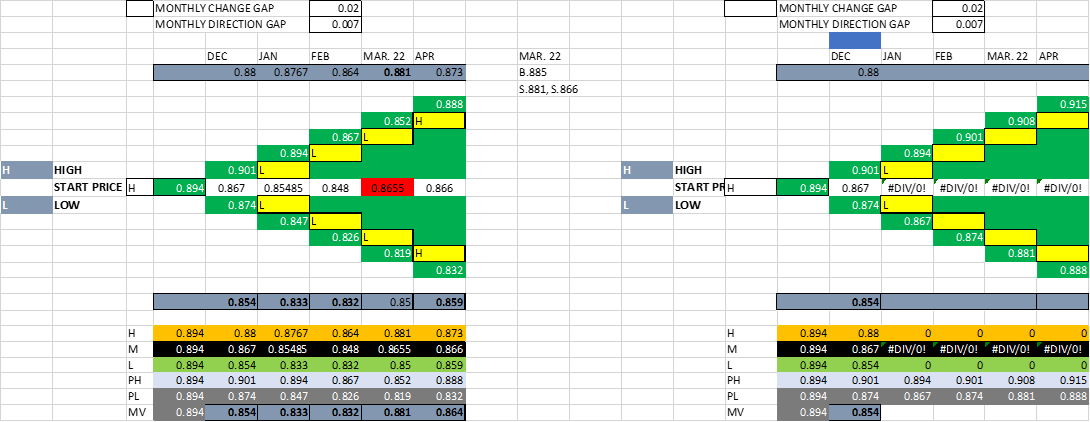
Above shows the template of my strategy I want to develop to an Expert Advisor. The logic will be explained and can then be coded to take actions according to the RULES of the LOGIC. As you can see above, I have 2 similar REPORTS for DEC to APRIL but the LEFT SIDE is populated while the RIGHT SIDE is EMPTY. This is to EXPLAIN the LOGIC of the way the EA will OPERATE.
AT start of DEC. When the EA was attached, the START PRICE was 0.894. At that time, based on the START PRICE, the FUTURE was projected as follows, IF price goes UPWARDS, then it is expected to BUY To 0.901, but if it goes DOWNWARDS it is expected to SELL to 0.874. This is at the BEGINNING OF THE PERIOD. BY END OF DECEMBER, the ACTUAL HIGHEST PRICE was 0.88 and the LOWEST PRICE was 0.854. So it means for DECEMBER, The market was a SELL. And the EA should be able to maximize the bids to take the Highest cumulative profits during the period using the Projection and the ACTUAL results.
AT Start of JAN for Example, the EA Movement in DEC was LOWEST at 0.854. So we have the L in the YELLOW Column in front of Previous MONTH projection. It will be HIGH if the DEC Move has at the HIGHEST. So based on the L, it projected as Follows: Lowest position to reach 0.847, Highest to reach 0.894, while the MID PRICE which will help control the PRICE to determine change in direction will be 0.867 (based on previous TF data- Month). At END of JAN, the Price moved upwards above the mid price to achieve a 0.8767 value, However, it returned to the midpoint of previous Month at 0.867 to fall down to a new LOWEST of 0.833 below previous TF data. So again as we can see, this is a SELL market MOVE for the MONTH of JAN. THE EA should be able to use the prices at 0.88, 0.867 and 0.854 of previous TF in DEC to identify and take bids accurately for JAN, so that when prices didn’t reach 0.894 of Projected HIGH, then it should re adjust itself to a SELL from 0.867 downwards to below 0.854 as a minimum.
AT Start of FEB for Example, the EA Movement in JAN was LOWEST at 0.833. So we have the L in the YELLOW Column in front of Previous MONTH projection. So based on the L, it projected as Follows: Lowest position to reach 0.826, Highest to reach 0.867, while the MID PRICE which will help control the PRICE to determine change in direction will now be 0.85485 (based on previous TF data- Month). At END of FEB, the Price moved downwards to 0.832 and then changed direction UPWARDS and above the mid price to achieve a 0.864 value, As a result, it crossed the previous MONTH Projected LOW of 0.847, the midpoint value of previous Month at 0.8545 to rise up to a HIGHEST of 0.864. So again as we can see, this was initially a SELL up till 0.847, BUT the EA will readjust itself to a BUY MODE as the ACTUAL PRIE Moves from 0.833 to 0.847 and didn’t return back to 0.833 downwards. It will also use the LOWEST of 0.832 to identify the minimum Move UPWARDS to 0.832 + 0.02= 0.852+. So the EA will use the NEW Monthly EXTREME to predict REVERSAL moves if market changes DIRECTION to OPPOSITE.
AT Start of MAR , the EA Movement in FEB- TF was LOWEST at 0.832. So we have the L in the YELLOW Column in front of Previous MONTH projection. So based on the L, it projected as Follows: Lowest position to reach 0.819, Highest to reach 0.852, while the MID PRICE which will help control the PRICE to determine change in direction will now be 0.848 (based on previous TF data- Month). At END of MAR, the Price didn’t move downwards as we can see the Lowest at 0.85 which is above our calculated previous Month Mid Price, but rather price went above the PROJECTED HIGH of 0.852, and Above Previous Month HIGH of 0.864 to reach a new HIGH of 0.881 (which is also above our safe position of HIGH using our Lowest Price for the Month, ie 0.85+ 0.02= 0.87. So the EA should use this Concept to take actions for and against direction and readjust itself depending on the TF- TIME FRAME used for the implementation.
So in summary, all the EA will need is the Projected pries of the limits being expected ahead while it continues to use the current period/ TF data to compare and take accurate decisions between BUYING and SELLING.
Only those that understand the concept should apply and we can discuss further.