트레이딩 로봇 주문 방법을 보십시오
주문을 실행하거나 포스트하기 전에 규칙을 읽으십시오
MQL5 및 MQL 4의 트레이딩 로봇을 주문하는 방법
로봇을 주문하기 위해샘플 요구 사항을 보십시오
카테고리의 새로운 주문:
30+ USD
30 - 20000 USD
30 - 100 USD
50+ USD
명시
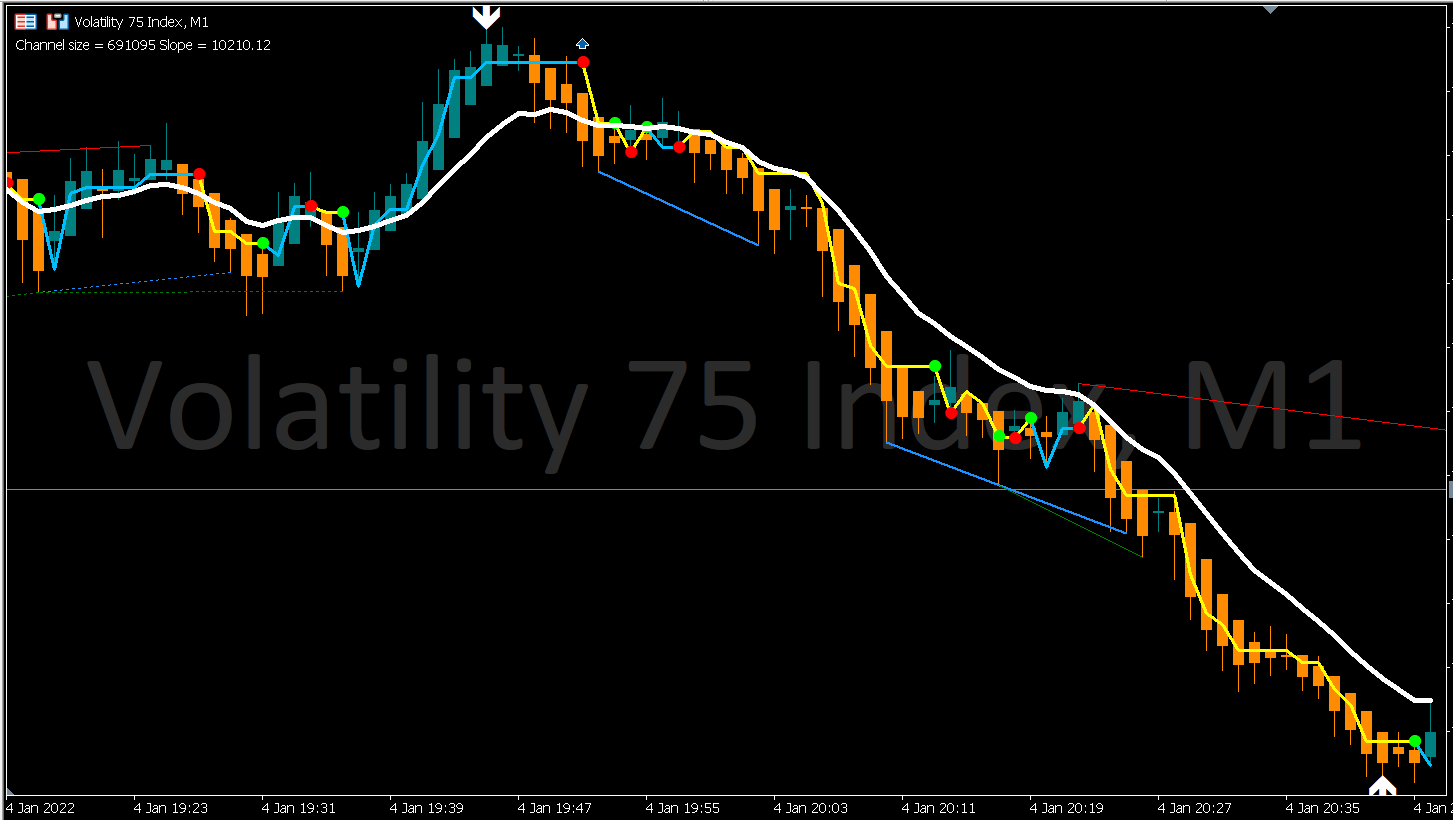
I would like to have an experienced & well talented developer to develop a smart MQL5 EA that's going to base majorly on 2 indicators (super trend and an option to select from 4 different periods of Exponential Moving Average). The EA must be able to trade Forex, Crypto and Indices automatically, open and close positions based on the "Buy & Sell" signals given by the Super-Trend indicator.
The EA should provide the options of selecting lot sizes, money risk management (Stop Loss & Take Profit Levels), Close all Order Positions, etc.
Please, see the attached image below for better clarity of the 2 Indicators mentioned above.
응답함
1
등급
프로젝트
12
42%
중재
1
0%
/
100%
기한 초과
2
17%
무료
2
등급
프로젝트
2937
63%
중재
124
44%
/
26%
기한 초과
429
15%
무료
3
등급
프로젝트
720
34%
중재
35
71%
/
9%
기한 초과
22
3%
무료
4
등급
프로젝트
1429
59%
중재
31
81%
/
0%
기한 초과
10
1%
무료
5
등급
프로젝트
60
23%
중재
11
73%
/
9%
기한 초과
3
5%
무료
6
등급
프로젝트
3407
68%
중재
77
48%
/
14%
기한 초과
342
10%
무료
게재됨: 1 코드
7
등급
프로젝트
644
26%
중재
92
72%
/
14%
기한 초과
12
2%
작업중
게재됨: 1 코드
8
등급
프로젝트
487
70%
중재
6
67%
/
0%
기한 초과
2
0%
무료
9
등급
프로젝트
478
40%
중재
105
40%
/
24%
기한 초과
82
17%
로드됨
게재됨: 2 코드
10
등급
프로젝트
146
34%
중재
13
8%
/
62%
기한 초과
26
18%
무료
게재됨: 6 코드
11
등급
프로젝트
945
47%
중재
309
58%
/
27%
기한 초과
125
13%
무료
비슷한 주문
MT4/MT5 HFT EA Live Trading
40 - 10000 USD
I have a High-Frequency Trading (HFT) Expert Advisor for both MT4 and MT5 designed primarily for US30 (Dow Jones Index) . The EA performs consistently and profitably on demo accounts, but when I run it on an IC Markets Raw or Standard live account, it starts generating losses under what appear to be the same trading conditions. At this time, I cannot provide the source code (.mq4/.mq5). I can only provide the
HFT / Latency Arbitrage pepperstone
30 - 5000 USD
I am looking for an experienced MQL5 developer to build a high-frequency (HFT) latency arbitrage Expert Advisor for Pepperstone MT5 , using LMAX as the leading price feed. The initial focus will be on US30 (Dow Jones) , and if the strategy proves successful, I want the EA to be easily expandable to additional symbols such as NAS100, GER40, XAUUSD, major forex pairs, and other supported instruments. The EA should
EA Crafter
500+ USD
Act as a professional Quantitative Developer and Risk Manager. I want to build a systematic trading strategy rulebook that prioritizes capital preservation and statistical edge over raw performance. Please generate a structured trading strategy using the following framework: 1. ASSET CLASS & TIMEFRAME: - Asset: [e.g., Apple (AAPL), Bitcoin (BTC), or EUR/USD] - Timeframe: [e.g., 5-minute, 1-hour, Daily] 2. CORE
Мне нужен простой торговый бот, написанный исключительно на Python. Бот должен подключаться к терминалу MetaTrader 5 через официальную библиотеку Python "MetaTrader5". Объем кода невелик (около 250 строк). КРИТИЧЕСКИ ВАЖНЫЕ ТРЕБОВАНИЯ: 1. НЕТ КОДА MQL5: Весь проект должен быть написан только на Python. 2. ВНЕШНЯЯ КОНФИГУРАЦИЯ: У бота должен быть внешний конфигурационный файл (config.ini или settings.json). Я должен
Driven Multiple Choice
30+ USD
Part 1: Project setup Input settings (risk, stop loss, take profit, EMA periods) Indicator initialization Trade management framework Part 2: Trading logic EMA crossover detection Buy/Sell entry rules One-trade-per-symbol check Part 3: Risk management Automatic lot size calculation Stop-loss and take-profit placement Trade execution and error handling Part 4: Final touches On-screen information Optimization
Institutional‑Grade Multi‑Currency MT5 EA
1000 - 1300 USD
Hello, I am reopening this project with a fully updated and clarified specification. I am looking for a high‑level MQL5 developer who can deliver a clean, stable, and professional Phase 1 version of my: Institutional‑Grade Multi‑Currency MT5 EA (A2SR + SMC + Smart Recovery + Smart Grid + Liquidity + Volatility + Safety Filters) This EA is not a simple indicator conversion or a basic strategy. It is a structured
Hft gold ea live account ic market
30 - 3000 USD
I am looking for an experienced MQL5 or MQL4 developer with a strong understanding of high-frequency trading (HFT) concepts who can explain how certain HFT-style strategies have historically been able to pass proprietary firm evaluations while also being profitable on demo accounts and capable of transitioning successfully to live trading. I am interested in understanding the legitimate trading logic, execution
프로젝트 정보
예산
30 - 60 USD
기한
에서 3 로 7 일