 MetaTrader 5
 Experts
 지표
지표
 스크립트
스크립트
 라이브러리
라이브러리
 보관함
보관함
당사 팬 페이지에 가입하십시오

Turtle Breakout Indicator Tested on Gold: Profitable in 2025 and 2026 (70) - MetaTrader 5용 지표

- 조회수:
- 218
- 평가:
- 게시됨:
-
 이 코드를 기반으로 한 로봇이나 지표가 필요하신가요? 프리랜스로 주문하세요
프리랜스로 이동
이 코드를 기반으로 한 로봇이나 지표가 필요하신가요? 프리랜스로 주문하세요
프리랜스로 이동

Breakout Exit Lab: Donchian Breakouts With Three Exits Scored Side by Side
Marks Turtle-style Donchian channel breakouts and follows every one of them with three exits at once: an ATR trailing stop, the Turtle exit channel and a fixed target. A panel shows which exit made the most on your symbol, in R, spread included. Non-repainting, with buffers for an Expert Advisor.
Why three exits
Breakout systems live or die on the exit. The entry is simple and everyone agrees on it: price closes above the highest high of the last 20 bars, you buy. After that the arguments start. Trail it with ATR? Use the Turtles' 10-bar exit channel? Take a fixed 2R and walk away?
Every breakout indicator I found picks one exit and draws it. I wanted to see all three on the same entries, on my own symbol, before I chose. So this indicator takes each breakout and runs it through three exits in parallel, then puts the results next to each other.
How a breakout is defined
- The entry channel is the highest high and the lowest low of the previous InpEntryBars bars (20 by default, Turtle System 1).
- A buy signal is a closed bar that closes above the channel high while the bar before it did not. A sell signal is the mirror image. Only the first close beyond the channel counts, so a strong trend doesn't produce an arrow on every bar.
- The trade starts at the open of the next bar. The initial stop is InpStopATR times ATR away (2.0 x ATR(20), the Turtles' "2N").
- An optional trend filter keeps only breakouts on the side of a 200 EMA. It is off by default.
The three exits
- A. ATR trail. The stop follows the best price since entry at InpTrailATR times ATR (3.0 by default) and never moves back.
- B. Turtle exit channel. The stop follows the lowest low of the last InpExitBars bars for a long (10 by default, System 1) and the highest high for a short.
- C. Fixed target. A take profit at InpTargetR times the initial risk (2R by default), with the initial stop.
Each result is measured in R, where 1R is the distance from entry to the initial stop. The spread of the signal bar is subtracted as a cost. A stop that price gaps through is filled at the bar's open, not at the stop price. When the stop and the target are both inside one bar, the stop is counted, because a bar can't tell which came first.
Every breakout is scored on its own, so trades can overlap. The panel is a comparison of exits over the same set of entries. It is not an account simulation with position sizing.
What the panel shows
- The number of breakouts, split into long and short, and how many are still open.
- For each exit: closed trades, win rate, profit factor, average R and the sum in R.
- For the exit you choose to draw (InpDrawExit): the long and short sums separately, so you can see whether one side carries the result.
The chosen exit is also drawn on the chart. Each trade gets an entry line and its result in R, and the stop of the latest trade is drawn as a dotted line.
What it found on gold
XAUUSD, MetaQuotes-Demo data, default inputs. The 2025 run scores the 360 days up to 31 December 2025. The 2026 run scores the 260 days up to 18 September 2026.
| XAUUSD | Trades | Win rate | PF | Sum |
|---|---|---|---|---|
| H4 2025, exit A (ATR trail) | 129 | 43.4% | 1.45 | +23.08R |
| H4 2025, exit B (10-bar channel) | 129 | 41.1% | 2.34 | +66.20R |
| H4 2025, exit C (2R target) | 129 | 45.7% | 1.68 | +47.83R |
| H4 2026, exit A | 76 | 35.5% | 1.10 | +3.46R |
| H4 2026, exit B | 76 | 35.5% | 1.70 | +22.35R |
| H4 2026, exit C | 75 | 38.7% | 1.26 | +11.99R |
| H1 2025, exit A | 465 | 37.6% | 1.32 | +70.32R |
| H1 2025, exit B | 465 | 37.8% | 1.23 | +51.18R |
| H1 2025, exit C | 465 | 37.8% | 1.21 | +60.32R |
| H1 2026, exit A | 270 | 39.6% | 1.21 | +25.14R |
| H1 2026, exit B | 270 | 40.4% | 1.29 | +35.15R |
| H1 2026, exit C | 269 | 38.3% | 1.23 | +39.06R |
All twelve are positive. On H4 the Turtle exit channel was the best exit in both years, and the ATR trail was the weakest. On H1 there was no clear winner: the trail led in 2025 and the fixed target led in 2026. That is the reason the panel exists. The "best exit" changed with the timeframe and the year even on one symbol.
Now the part that matters before anyone gets excited. Gold went up a lot in 2025, and it shows in the split. With exit B on H4, the 99 longs made +79.4R and the 30 shorts lost -13.2R. In 2026 gold swung both ways, and both sides were positive: 42 longs made +14.9R and 34 shorts made +7.5R.
To see how much of this is gold's trend, I ran the same defaults on three forex pairs on H4 over the same 2026 window:
| H4 2026 | Exit A sum (PF) | Exit B sum (PF) | Exit C sum (PF) |
|---|---|---|---|
| EURUSD | -11.74R (0.68) | -3.86R (0.89) | -5.97R (0.88) |
| GBPUSD | -9.21R (0.77) | -3.15R (0.91) | +6.90R (1.13) |
| USDJPY | +1.30R (1.03) | +0.73R (1.02) | +3.03R (1.06) |
Flat to negative. Breakouts need a market that trends, and in this period gold did while these pairs mostly didn't. So I read the gold numbers as "breakouts worked while gold trended", not as proof that they always will.
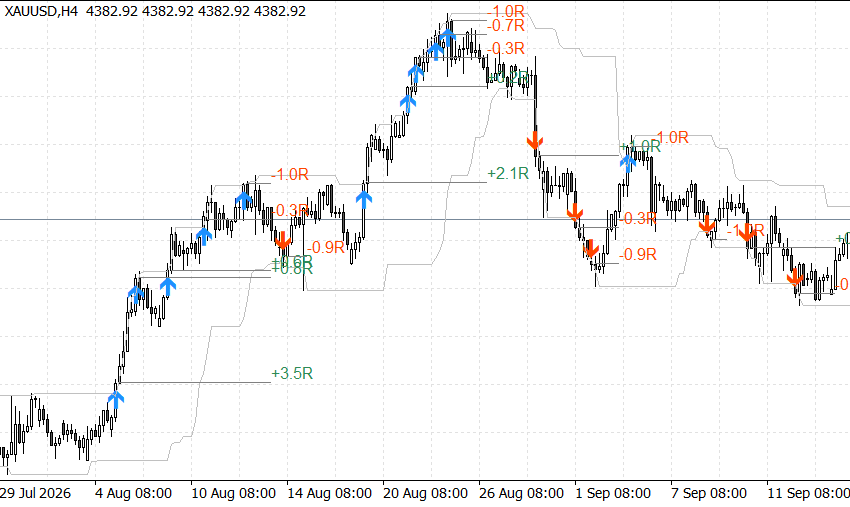
Fig. 1. XAUUSD H4, late July to mid-September 2026: breakout arrows, the entry channel and each trade's result under exit B
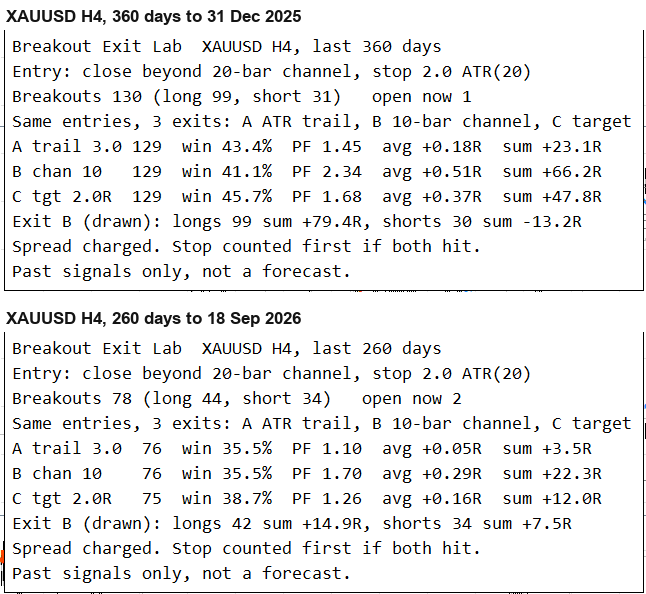
Fig. 2. The panel for XAUUSD H4 in 2025 and 2026, with exit B drawn
Inputs
| Input | Default | What it does |
|---|---|---|
| InpEntryBars | 20 | Entry channel length in bars |
| InpExitBars | 10 | Exit channel length for exit B |
| InpATRPeriod | 20 | ATR period |
| InpStopATR | 2.0 | Initial stop, ATR multiples |
| InpTrailATR | 3.0 | Exit A trail distance, ATR multiples |
| InpTargetR | 2.0 | Exit C take profit, R multiples |
| InpUseTrend | false | Keep only breakouts on the side of the trend EMA |
| InpTrendEMA | 200 | Trend EMA period, chart timeframe |
| InpDrawExit | A. ATR trail | Exit drawn on the chart and sent to buffers 6 to 9 |
| InpDaysBack | 365 | Days of history in the scorecard |
| InpDrawDays | 60 | Days with trade lines drawn |
| InpShowPanel | true | Show the panel |
| InpPanelCorner | left upper | Panel corner |
| InpAlertPopup | true | Popup alert on a new breakout |
| InpAlertPush | false | Push notification on a new breakout |
For the classic Turtle System 2, set InpEntryBars to 55 and InpExitBars to 20.
Using it from an Expert Advisor
A breakout is written on the bar that closed beyond the channel, so an EA reads it at shift 1 once that bar has closed. Arrows are kept on the whole loaded history, not only inside the scored window. I checked in the strategy tester that the signals an EA saw live were exactly the ones in the buffers at the end of the run: 473 of 473 on H1 and 131 of 131 on H4 for gold in 2025.
| Buffer | Content |
|---|---|
| 0 | Buy breakout, value is the planned entry (next bar's open), EMPTY_VALUE otherwise |
| 1 | Sell breakout, same format |
| 2, 3 | Entry channel high and low |
| 4 | Stop of the latest trade under the drawn exit |
| 5 | Initial stop on the breakout bar |
| 6 to 9 | Scorecard of the drawn exit on the last closed bar: closed trades, wins, sum in R, sum of losing R |
int      handle;
datetime lastBar = 0;

int OnInit()
  {
   handle = iCustom(_Symbol, PERIOD_H4, "BreakoutExitLab");
   return(handle == INVALID_HANDLE ? INIT_FAILED : INIT_SUCCEEDED);
  }

void OnTick()
  {
   //--- breakouts are confirmed on closed bars, so check once per new bar
   datetime bar = iTime(_Symbol, PERIOD_H4, 0);
   if(bar == lastBar)
      return;
   lastBar = bar;

   double buy[1], sell[1], stop[1];
   if(CopyBuffer(handle, 0, 1, 1, buy) < 1 || CopyBuffer(handle, 1, 1, 1, sell) < 1 ||
      CopyBuffer(handle, 5, 1, 1, stop) < 1)
      return;

   if(buy[0] != EMPTY_VALUE)
      Print("Breakout buy, initial stop ", stop[0]);
   if(sell[0] != EMPTY_VALUE)
      Print("Breakout sell, initial stop ", stop[0]);
  }
The indicator has no input groups on purpose. MQL5 counts each "input group" as a parameter of iCustom(), and every value after it would shift by one.
One small thing I learned while building the panel: a chart label holds at most 63 characters. My first panel rows were longer and MetaTrader cut them off in the middle of a number, so the rows are now kept short.
Limits
The results come from bar data, so the order of events inside one bar is unknown. Only the spread is charged, with no commission and no slippage beyond gaps through the stop. Trades are scored one by one and can overlap, so the sums are not an equity curve. Every number above is from one broker's data over two periods in which gold trended strongly.
Ali Rajput
 Gold Breakout EA for XAUUSD H4 +90 Percent in a 2020 to 2026 Backtest
A Turtle-style breakout EA for gold. It buys when an H4 bar closes above the 20-bar high in an uptrend, with a 2 ATR stop and a 2R target. Backtested on XAUUSD from January 2020 to September 2026: +9,029.72 on 10,000 at 1% risk, profit factor 1.77, max drawdown 11.38%, 6 of 7 years profitable.
CME Gap Tracker for Gold and Bitcoin: Open Gaps, Fill Rate and a Fade-Trade Test
Finds the weekend CME gap on gold and on 24/7 Bitcoin charts, keeps every unfilled gap on the chart until price returns to it, and shows how often gaps filled, how fast, how far price ran first, and what fading them would have made. Non-repainting, with buffers for an Expert Advisor.
ATS Confirmed Swings - non-repainting swing highs and lows
Marks swing highs and lows only after N closed bars have confirmed them, so a drawn swing never moves or disappears.
Price Action Volumetric Order Blocks MT5
Open-source MT5 indicator for confirmed market structure, volumetric order blocks and estimated buy/sell activity.