 MetaTrader 5
 Experts
 지표
지표
 스크립트
스크립트
 라이브러리
라이브러리
 보관함
보관함
당사 팬 페이지에 가입하십시오

Any Indicator Alert - alerts, push notifications and multi-timeframe for any custom indicator, no source code needed - MetaTrader 5용 지표

- 조회수:
- 101
- 평가:
- 게시됨:
-
 이 코드를 기반으로 한 로봇이나 지표가 필요하신가요? 프리랜스로 주문하세요
프리랜스로 이동
이 코드를 기반으로 한 로봇이나 지표가 필요하신가요? 프리랜스로 주문하세요
프리랜스로 이동


이 포럼에서 가장 인기 있는 두 가지 주제는 “알림/신호가 있는 지표”와 “다중 시간대 지표”입니다. 수년이 지났음에도 이 주제들이 여전히 열려 있는 이유는, 해답이 항상 똑같기 때문입니다. 바로 소스 코드를 구해서 수정하고, 다시 컴파일하면 됩니다. 하지만 .ex5 파일만 있고 소스 코드가 없다면 이 방법은 도움이 되지 않으며, 여러 지표를 사용하는 경우에는 이 방법이 실용적이지 않습니다.
이 도구는 외부에서 이 문제를 해결해 줍니다. iCustom은 소스 코드 없이도 이름으로 어떤 지표든 불러와 버퍼를 읽을 수 있으므로, 하나의 도구로 모든 지표를 처리할 수 있습니다.
EXPLORE 모드에서 시작하세요
사람들이 iCustom을 꺼리는 이유는 버퍼 번호를 입력해야 하는데, 차트에서 보이는 내용이 어느 번호의 버퍼에 저장되어 있는지 알려주는 정보가 전혀 없기 때문입니다. 따라서 기본 모드는 이 문제를 먼저 해결해 줍니다. 버퍼를 탐색하여 각 버퍼에 무엇이 들어 있는지 집계한 뒤, 최근 몇 개의 막대 옆으로 그 내용을 표시해 줍니다.
거의 모든 막대에 값이 있는 버퍼는 추세선(line)이므로, 레벨 크로스(level cross)나 두 번째 버퍼를 기준으로 한 크로스를 사용하세요. 지표가 무언가를 그린 부분을 제외하고는 비어 있는 버퍼는 신호(signal)이므로, “값이 나타남(a value appears)”을 사용하세요. 표에서 번호를 확인한 후, WATCH 모드로 전환하고 트리거를 선택하세요.
EXPLORE가 출력하는 내용의 예시
이것은 실제 XAUUSDm H1 차트에서 표준 RSI를 관찰한 실제 실행 결과입니다. 지표가 가진 모든 버퍼가 나열되어 있으며, 샘플링된 바 중 실제 값을 가진 바의 수, 정확히 0인 바의 수, 빈 바의 수가 표시되고, 그 뒤에 바별로 값이 나열됩니다.
Buffers found: 3   (checked up to 16, on XAUUSDm PERIOD_H1)
------------------------------------------------------------------
  buffer  values  zeros  blank  what it looks like                     range of the values
       0      12      0      0  a line - a value on almost every bar   31.47608 .. 55.28984
       1      12      0      0  a line - a value on almost every bar   4.11585 .. 6.11288
       2      12      0      0  a line - a value on almost every bar   3.86003 .. 8.96028
------------------------------------------------------------------
  bar  time               buf0         buf1         buf2
    0  2026.09.04 20:00     45.61107     5.40493     6.44511
    1  2026.09.04 19:00     46.88624     5.82069     6.59381
    2  2026.09.04 18:00     43.33095     5.42967     7.10102
    3  2026.09.04 17:00     40.80179     5.27080     7.64725
------------------------------------------------------------------
Read it like this: the buffer that is empty on most bars and carries a value
only where the indicator drew its signal is the one to watch. Put its number
in 'Buffer to watch', set Mode to WATCH, and pick a trigger.
A buffer that has a value on every bar is a line - use a level or buffer cross. 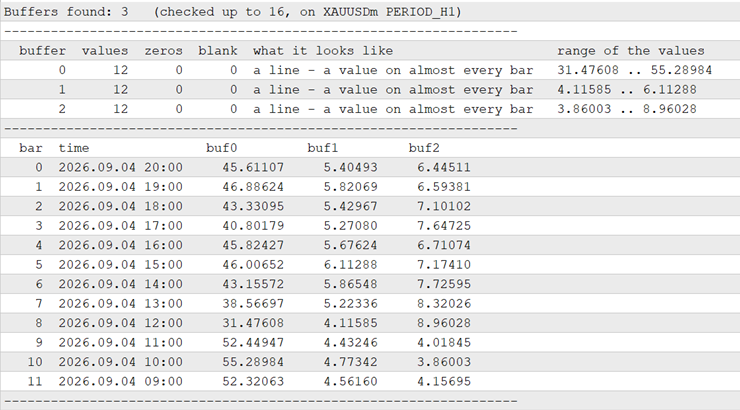
여기서는 세 버퍼 모두 선으로 표시되는데, 이것이 바로 RSI의 특성입니다. 화살표나 신호 지표의 경우 표가 다르게 보이며, 바로 그 차이가 핵심입니다:
  buffer  values  zeros  blank  what it looks like                     range of the values
       0       0      0      8  nothing here on these bars             -
      11       8      0      0  a line - a value on almost every bar   16.08798 .. 16.25192
      14       7      1      0  sparse - looks like a signal           4166.06000 .. 4166.06000
여기서 주목해야 할 것은 버퍼 14입니다. 이 버퍼는 대부분의 바에서 비어 있으며, 지표가 무언가를 표시한 곳에서만 가격을 담고 있으므로, “값이 나타나는 것”이 이 버퍼의 트리거가 됩니다. 버퍼 11은 내부 라인이며, 버퍼 0은 이 바들에서 아무것도 담고 있지 않습니다.
지연된 값과 재그리기(repaint)는 서로 다른 개념이므로 별도로 집계됩니다.
마감된 모든 봉의 값은 저장되어 있으며, 새로운 봉이 생성될 때마다 다시 읽힙니다. 마감된 봉의 값이 변경된 경우, 그 이유는 크게 두 가지로 나뉩니다.
늦게 표시된 값. 해당 바는 비어 있었으나 이제 값을 갖게 되었습니다. 지표는 이 바를 표시하기 전에 이후의 바들을 필요로 했습니다. 프랙탈은 설계상 이러한 방식으로 작동하며, 대부분의 스윙 및 구조 마커도 마찬가지입니다. 이는 속임수가 아니지만, 해당 신호가 가리키는 바에서는 신호가 전혀 보이지 않았음을 의미하며, 눈으로 전략을 판단할 때 이는 중요한 사항입니다.
재그리기. 이전에 존재하던 값이 이동했거나 사라졌습니다. 거래를 실행할 수 있었던 근거가 사라진 것입니다.
두 경우 모두 해당 바의 시간, 이전 값 및 새로운 값과 함께 보고되며, 차트 주석에는 각각의 누적 횟수가 기록됩니다. 형성 중인 바가 변하는 것은 정상적인 현상이므로, 형성 중인 바로부터는 어떠한 추론도 이루어지지 않습니다.
이 구분은 단순히 주장된 것이 아니라 테스트를 통해 검증되었습니다. 2026년 8월 1일부터 20일까지의 XAUUSD H1 차트(299개 봉)에서 각 지표의 버퍼 0을 관찰한 결과:
| 관찰 대상 지표 | 지연된 값 | 재그리기 |
|---|---|---|
| 예시\프랙탈(Fractals): 바가 마감된 지 두 바 후에 표시됨 | 40 | 0 |
| 예제\지그재그, 설계상 마지막 구간을 다시 그립니다 | 0 | 83, 각각 사라진 값 |
| 예제\RSI, 바가 마감되면 값이 확정됨 | 0 | 0 |
따라서 지연되는 지표에 대해서는 “late”라고 표시하고, 재그림 현상이 있는 지표에 대해서는 “repaint”라고 표시하지만, 두 가지 모두 해당되지 않는 지표에 대해서는 아무런 표시도 하지 않습니다. 같은 실행에서 RSI가 30 아래로 떨어질 때(28.38과 29.21) 레벨 트리거가 두 번 발동했습니다; MACD의 메인 라인은 시그널 라인을 9번 상향 교차하고 9번 하향 교차했습니다; 또한 H1 차트에서 H4 데이터를 기반으로 한 RSI는 H4 바당 한 번씩, 총 77회의 알림을 생성했으며, 각 알림에는 PERIOD_H4라는 태그가 찍혔습니다. 또한 157KB 크기의 타사 Smart Money Concepts 지표와 비교 실행한 결과, 16개의 버퍼를 발견했으며, 두 개의 드문 신호 버퍼에서 세 개의 내부 선을 분리해 냈습니다.
트리거
값은 막 마감된 막대나, 지연 지표의 경우 이제야 표시된 이전 막대에 나타납니다. 또한 특정 수준을 상향 또는 하향으로 교차하거나, 한 버퍼가 다른 버퍼를 어느 방향으로든 교차하거나, 단순히 값이 변경되는 경우에도 알림이 발생합니다. 알림은 팝업, 소리, 푸시 알림 또는 이메일로 전송되며, 바당 한 번씩 발생합니다. 기본적으로 마감된 바만 판단 대상으로 삼습니다. 이 기능을 해제하면 형성 중인 바가 매 틱마다 판단되어 알림이 더 빨리 전송되며, 추세가 반전될 수도 있지만, 어느 경우든 바당 한 번의 알림만 발생합니다.
더 높은 시간대
"이 시간대에서 읽기"를 설정하면, 관찰 중인 지표가 차트의 시간대 대신 해당 시간대에 로드됩니다. 봉, 트리거 및 리페인트 확인은 모두 이 설정에 따릅니다.
실제 적용 사례 두 가지
예시 1 - RSI가 70을 상향 돌파할 때 알려주세요. 이 지표는 이미 잘 알고 계시므로, ‘EXPLORE’는 단순히 확인용입니다.
| 입력 | 값 |
|---|---|
| 지표 파일 | Examples\RSI |
| 입력 항목 | 14 |
| 이 시간대에서 읽기 | 현재 시간대 |
| 모드 | 관찰 |
| 시청할 버퍼 | 0 |
| 트리거 | 버퍼가 레벨을 상향 돌파할 때 |
| 레벨 | 70 |
| 팝업 알림 | true |
75.04, 76.31, 70.38, 74.83에서 4건의 알림이 발생한 테스트 데이터에서 확인된 결과입니다. 1시간 차트를 보고 있는 동안 4시간 차트에서도 동일한 결과를 얻으려면, "이 시간대에서 읽기"를 H4로 설정하고 다른 설정은 변경하지 마십시오.
예시 2 - 다운로드했지만 출처를 알 수 없는 화살표 지표. 여기서는 EXPLORE가 실제 작업을 수행하고 있습니다.
- 모드를 EXPLORE로 설정하고 “지표 파일”을 해당 지표의 이름으로 지정하여 연결하십시오. “입력값”은 비워두면 지표 자체의 기본값이 사용됩니다.
- 툴박스(Toolbox)의 '전문가(Experts)' 탭을 열고, 대부분의 막대에서 비어 있지만 차트에 화살표가 표시되는 값이 있는 버퍼를 찾으세요. 이를 버퍼 2라고 가정해 봅시다.
- 모드를 WATCH로 설정하고, 감시할 버퍼를 2로, 트리거를 “값이 나타남”으로, 푸시 알림을 켜서 다시 연결하세요.
- EXPLORE에서 버퍼가 대부분 정확한 0으로 구성되어 있다는 알림이 표시되었다면, "이 지표는 의미가 없는 곳에 0을 기록합니다"를 켜고 선택하기 전에 표를 다시 확인하십시오.
각 입력값의 역할
| 입력 항목 | 기능 |
|---|---|
| 지표 파일 | MQL5\Indicators 폴더 내의 경로(확장자 제외). 백슬래시(\)가 하나 포함되어야 하며, 예를 들어 Examples\RSI 또는 MyFolder\MyArrows와 같습니다. 이 필드는 의도적으로 비어 있는 상태로 시작됩니다. 모든 터미널에 반드시 존재하는 지표는 없기 때문이며, 이 필드를 채우기 전까지는 아무런 동작도 발생하지 않습니다. |
| 입력 항목 | 감시 대상 지표의 자체 입력값을 쉼표로 구분하여, 선언된 순서대로 입력합니다. 공백은 기본값을 사용함을 의미합니다. 정수는 int로, 소수점이 포함된 숫자는 double로, true와 false는 bool로, 그 외의 모든 값은 텍스트로 전달됩니다. 로그에는 처리 결과가 출력되므로 확인할 수 있습니다. |
| 이 타임프레임에서 읽기 | 차트의 타임프레임이 아닌 이 타임프레임에 모니터링 대상 지표를 로드합니다. 현재 타임프레임은 차트 자체의 타임프레임을 의미합니다. |
| 이 지표는 “아무것도 없음”을 의미하는 곳에 0을 기록합니다. | 정확히 0인 값은 빈 값으로 처리합니다. ZigZag와 같은 지표에 필요합니다. EXPLORE는 이 기능을 켜야 할 시점을 알려줍니다. |
| 모드 | EXPLORE는 버퍼 목록을 표시하며 알림을 보내지 않습니다. WATCH는 선택한 버퍼에 대해 알림을 보냅니다. |
| 탐색할 버퍼 수 | EXPLORE는 여기서 중단됩니다. 제한에 도달했다는 메시지가 표시되면 이 수치를 늘리십시오. |
| 표시할 최근 바 수 | EXPLORE가 표시하고 집계하는 바 수입니다. |
| 감시할 버퍼 | EXPLORE 테이블에서 확인한 버퍼 번호입니다. |
| 두 번째 버퍼 | 두 개의 버퍼 교차 트리거에서만 사용됩니다. |
| 트리거 | 값이 나타나거나, 레벨 위나 아래로 교차하거나, 버퍼 A가 버퍼 B를 어느 방향으로든 교차하거나, 단순히 값이 변경되는 경우입니다. |
| 레벨 | 두 개의 레벨 교차 트리거에서만 사용됩니다. |
| 종료된 봉만 판단 | 기본값은 '켜기'입니다: 바가 마감될 때 한 번만 판단하며, 결과가 뒤집힐 수 없습니다. '끄기'를 선택하면 형성 중인 바가 매 틱마다 판단되므로 더 빨리 알림을 받을 수 있지만, 결과가 취소될 수도 있습니다. |
| 팝업, 소리, 푸시 알림, 이메일 | 알림 방식입니다. 임의의 조합이 가능합니다. 푸시 알림을 받으려면 ‘도구 > 옵션 > 알림’에서 MetaQuotes ID를 설정해야 합니다. |
| 마감된 바 재읽기 및 변경 사항 보고 | 지연된 값 및 재그리기 보고 기능을 켭니다. |
| 계속 모니터링할 마감된 봉의 수 | 검사가 얼마나 과거까지 거슬러 올라가는지 설정합니다. 이 설정보다 더 과거의 변경 사항은 감지되지 않습니다. |
| 이보다 작은 변경 사항은 무시 | 모든 변경 사항을 포착하려면 0으로 둡니다. 지표의 소수점 마지막 자릿수에서 미세한 변동이 발생하는 경우 이 값을 높입니다. |
사람들을 당황하게 만드는 세 가지 사항과 이에 대한 처리 방법
일부 지표는 “여기에는 아무것도 없음”을 의미할 때 EMPTY_VALUE 대신단순한 0을 기록합니다. ZigZag가 그 예입니다. 표면적으로만 보면, 이러한 버퍼는 0으로만 이루어진 연속된 줄처럼 보입니다. 이에 대한 입력 옵션이 마련되어 있으며, EXPLORE는 버퍼가 대부분 0이지만 소수의 실제 값이 포함된 경우 알림을 표시하므로 사용자가 판단할 수 있습니다. 이는 의도적으로 추측하지 않는 방식입니다. 실제로 0에 머무르는 오실레이터는 외부에서 볼 때 똑같이 보이기 때문입니다.
지표가 아직 기록하지 않은 막대는 정확히 0.0으로 읽힙니다. 이는 터미널이 새로 생성된 버퍼에 넣는 값이며, 지연 지표는 필요한 후속 막대를 확보할 때까지 의도적으로 최신 막대를 그대로 둡니다. Fractals는 마지막 세 막대를 절대 건드리지 않습니다. 표면적으로만 보면, 이러한 바들은 나중에 모두 “변경”되는 것으로 보이며, 이 도구의 초기 버전은 실제로 리페인팅이 전혀 없는 지표에서 300건의 리페인팅을 보고하기도 했습니다. 0.0에서 빈 값으로 바뀌는 바는 이제 초기화로 처리되며, 0.0에서 특정 값으로 바뀌는 바는 늦게 도착한 것으로 처리됩니다.
입력 그룹은 위치 매개변수 슬롯을 차지합니다. iCustom이나 IndicatorCreate를 사용하여 자체 코드에서 이 지표를 호출하는 경우, 6개의 그룹 레이블을 실제 입력과 함께 문자열로 계산해야 하며, 그렇지 않으면 핸들이 오류 4002로 실패합니다. 이는 추측이 아닌 측정된 결과입니다. 버퍼 0은 감시 대상 버퍼의 값을 담고 있으므로, EA는 복잡한 연결 과정을 반복할 필요 없이 이를 직접 읽을 수 있습니다. 이 기능은 299개 바 중 299개 바에 대해 감시 대상 RSI와 대조하여 검증되었습니다.
지정한 지표가 로드되지 않는 경우(오타나 아직 컴파일되지 않은 파일 등)에는 지표가 자동으로 분리되지 않습니다. 차트와 전문가 로그에 해당 사실이 표시되며, 몇 초 간격으로 계속 시도하므로 이름을 수정하기만 하면 됩니다.
이 기능이 수행하지 않는 작업
이 도구는 지표 버퍼를 읽습니다. 차트 객체로만 그리기를 수행하는 지표는 버퍼를 노출하지 않으므로, 이 도구가 읽을 수 있는 내용이 없습니다. 지표 외부에서는 이를 변경할 수 있는 방법이 없습니다.
"200 바 동안 리페인팅이 관찰되지 않음"은 해당 바들에 대한 관찰 결과일 뿐, 앞으로 형성될 모든 바에 대한 보장은 아닙니다. 이는 증거이며, 대부분의 지표에 포함된 주장보다는 낫지만, 증명이라고 할 수는 없습니다. 이 검사는 “계속 관찰할 종가 바 수”에서 설정한 종가 바의 수를 대상으로 하며, 그보다 더 과거의 변화는 감지되지 않습니다.
이 기능은 버퍼가 무엇을 의미하는지 알려줄 수는 없습니다. 버퍼 3이 14개의 바에서 1.0을 유지하고 있음을 보여줄 뿐이며, 이것이 매수 신호인지 여부는 여러분이 판단해야 합니다.
정확히 0.0의 값으로 신호를 보내는 지표는 “값이 나타남”을 트리거하지 않습니다. 이는 아직 작성되지 않은 봉의 수치이기 때문입니다. 신호 버퍼는 가격이나 플래그를 포함하며, 절대 0.0을 포함하지 않으므로 실제로는 비용이 들지 않지만, 이는 규칙이므로 반드시 알아두어야 합니다.
버퍼 0은 관찰 대상 타임프레임이 차트 자체의 타임프레임일 때만 해당 버퍼를 반영합니다. 더 높은 타임프레임을 모든 차트 바에 매핑하는 것은 별개의 작업이므로 시도되지 않습니다.
알림 채널 자체(팝업, 소리, 푸시, 이메일)는 각각 하나의 호출로 이루어지며, 이를 전달하지 않는 전략 테스터에서는 실행되지 않았습니다. 해당 호출 이전에 도구가 결정한 모든 사항은 정상적으로 처리되었습니다.
설치 방법
- AnyIndicatorAlert.mq5 파일을 터미널의 데이터 폴더 내 MQL5\Indicators 폴더에 복사하십시오. MetaTrader에서 ‘파일’ > ‘데이터 폴더 열기’를 선택하면 해당 폴더로 이동할 수 있습니다.
- MetaEditor에서 파일을 열고 F7 키를 누르십시오. 오류 0개, 경고 0개가 표시되어야 합니다.
- 터미널로 돌아가서 Ctrl+N을 눌러 네비게이터를 열고, ‘지표(Indicators)’를 선택한 뒤 AnyIndicatorAlert를 차트로 드래그하세요. 목록에 표시되지 않으면 네비게이터에서 마우스 오른쪽 버튼을 클릭하고 ‘새로 고침’을 선택하세요.
- "지표 파일"을 입력하세요(처음에는 비어 있습니다). 모드는 EXPLORE로 둔 채 OK를 누르세요. Examples\RSI를 먼저 시도해 보세요.
- Ctrl+T를 눌러 툴박스를 열고 Experts 탭을 엽니다. 버퍼 테이블이 여기에 있습니다.
이 내용은 MetaTrader 5 빌드 6140에서 작성 및 검증되었습니다. 이 지표는 주문을 체결하지 않으며, 어떤 설정도 변경하지 않습니다.
MetaQuotes Ltd에서 영어로 번역함.
원본 코드: https://www.mql5.com/en/code/77003
 SuperTrend TV EA
iCustom을 통해 SuperTrend TV 지표를 기반으로 종가 봉만 대상으로 거래하는 전문가 자문가(EA)로, 모든 거래가 신호와 일치하며 단 하나의 신호도 놓치지 않았음을 입증하는 감사 보고서가 함께 제공됩니다.
 ATS Trade Management Library - break-even, trailing stop and partial closes for any EA
Look after open positions in an Expert Advisor: break-even, trailing stop, two partial closes, and a stop and target for positions that have none. It never opens a trade.
CajasTF – Integrated Multi-Timeframe Side Panel for MT5
Real-time multi-timeframe side panel mini-chart with smart color matching, independent price scale, and candle countdown timer.
Session Levels - Asian range, PDH/PDL, VWAP, swings and round numbers
Session Levels draws the reference levels intraday traders watch most: Asian range, London and New York sessions, previous day and week high/low, daily VWAP, swing points and round numbers. Hover any level to read what it is and why it matters. Optional alerts when price breaks the Asian range or the previous day high/low.