 MetaTrader 5
 Experts
 지표
지표
 스크립트
스크립트
 라이브러리
라이브러리
 보관함
보관함
당사 팬 페이지에 가입하십시오
- 게시자:
- 조회수:
- 179
- 평가:
- 게시됨:
-
 이 코드를 기반으로 한 로봇이나 지표가 필요하신가요? 프리랜스로 주문하세요
프리랜스로 이동
이 코드를 기반으로 한 로봇이나 지표가 필요하신가요? 프리랜스로 주문하세요
프리랜스로 이동


CajasTF is a lightweight MT5 indicator that displays a real-time mini-chart in a right-side panel, allowing you to monitor any timeframe (M1 to MN1) on a single screen. It automatically matches your chart’s color palette, features an independent price scale, candle countdown timer, live OHLC metrics, and auto-shift margin so your active trading candles are never hidden.
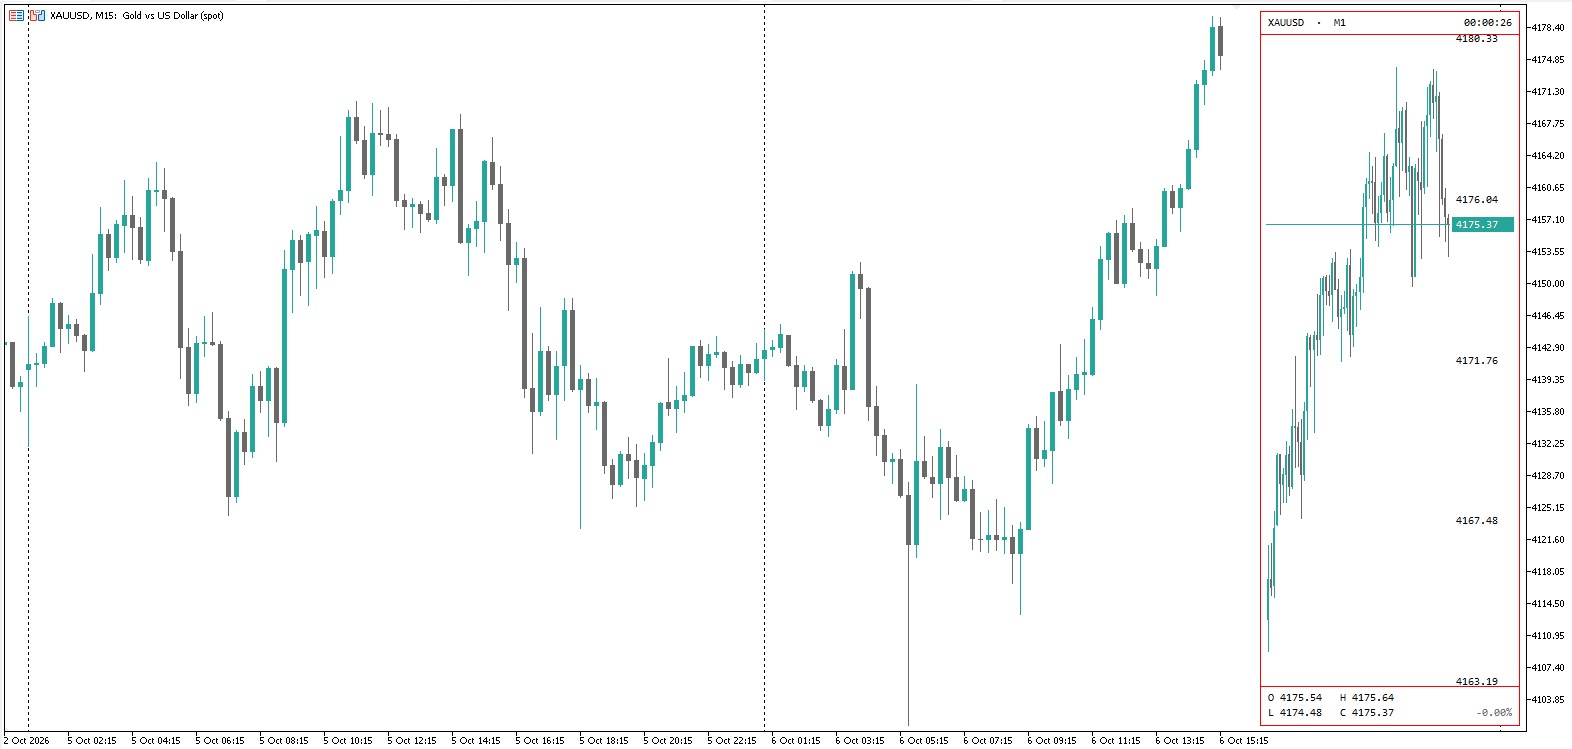
CajasTF is a lightweight, visual indicator for MetaTrader 5 that renders a secondary mini-chart directly on the right side of your main chart, allowing you to monitor real-time price action across any higher or lower timeframe without switching tabs or opening additional windows.
Engineered with native visual integration, the panel automatically inherits your chart’s existing color palette (background, bullish/bearish candles, wicks, dojis, and Bid line), delivering a clean, modern, and uncluttered trading workspace.
Key Features
-
Instant Multi-Timeframe (MTF) View:
- Select any timeframe (from M1 up to MN1) and view the last N candles of that period directly on your working chart.
- The active candle updates tick-by-tick in real-time as it forms.
-
Smart Palette & Automatic Color Matching:
- Detects and adapts instantly to your chart template: background, grid, labels, candle bodies, and wick outlines. If you switch themes (light/dark mode), the panel updates seamlessly.
-
Independent Price Scale:
- Features its own dedicated vertical scale with a 5-level grid, ensuring the mini-chart proportions remain optimal regardless of the zoom level on your main chart.
-
Intelligent Chart Auto-Shift:
- Automatically adjusts the right margin (chart shift) so the panel never covers active price action. When the indicator is removed, your original shift settings are automatically restored.
-
Real-Time Market Data & Metrics:
- Bar Countdown Timer: Accurate timer showing the time remaining until the active candle closes.
- Current Price Line: Live visual Bid price marker projected onto the panel's scale.
- OHLC Data Footer: Live Open, High, Low, Close metrics and current candle percentage change (% gain/loss).
 ATS Trade Management Library - break-even, trailing stop and partial closes for any EA
Look after open positions in an Expert Advisor: break-even, trailing stop, two partial closes, and a stop and target for positions that have none. It never opens a trade.
 Session Reality Auditor
Checks the broker's session table against the M1 history. For every minute of the week it counts on how many of the last N days the symbol really has a bar, and sets that next to SymbolInfoSessionQuote and SymbolInfoSessionTrade: declared minutes that are usually empty (rollover holes), bars in minutes the table calls closed, trade and quote tables that disagree, and one-off outages such as an early holiday close. Prints the real sessions per weekday, writes every finding to CSV and prints its own arithmetic. Read only: no trade function, no DLL, no network.
 Session Levels - Asian range, PDH/PDL, VWAP, swings and round numbers
Session Levels draws the reference levels intraday traders watch most: Asian range, London and New York sessions, previous day and week high/low, daily VWAP, swing points and round numbers. Hover any level to read what it is and why it matters. Optional alerts when price breaks the Asian range or the previous day high/low.
Multi-Indicator Divergence Detector
Regular and hidden divergences between price and ten oscillators calculated inside the indicator: MACD, MACD histogram, RSI, Stochastic, CCI, Momentum, OBV, VWMACD, Chaikin Money Flow and MFI. Lines on price, a box naming every oscillator that agrees, and alerts.