 MetaTrader 5
 Experts
 지표
지표
 스크립트
스크립트
 라이브러리
라이브러리
 보관함
보관함
당사 팬 페이지에 가입하십시오

Draw On Liquidity + Kill Zone - MetaTrader 5용 지표

2014년부터 복잡한 트레이딩 아이디어를 고성능 알고리즘 시스템으로 구현해 왔습니다. 저는 금융 시장에서 10년 넘게 활동해 온 전업 트레이더이자 개발자입니다. 2014년 여정을 시작한 이래, 고전적인 기술적 분석부터 최신 ICT 및 SMC(Smart Money Concepts) 방법론에 이르기까지 다양한 트레이딩 기법을 깊이 있게 연구해 왔습니다.
- 조회수:
- 27
- 평가:
- 게시됨:
- 업데이트됨:
-
 이 코드를 기반으로 한 로봇이나 지표가 필요하신가요? 프리랜스로 주문하세요
프리랜스로 이동
이 코드를 기반으로 한 로봇이나 지표가 필요하신가요? 프리랜스로 주문하세요
프리랜스로 이동


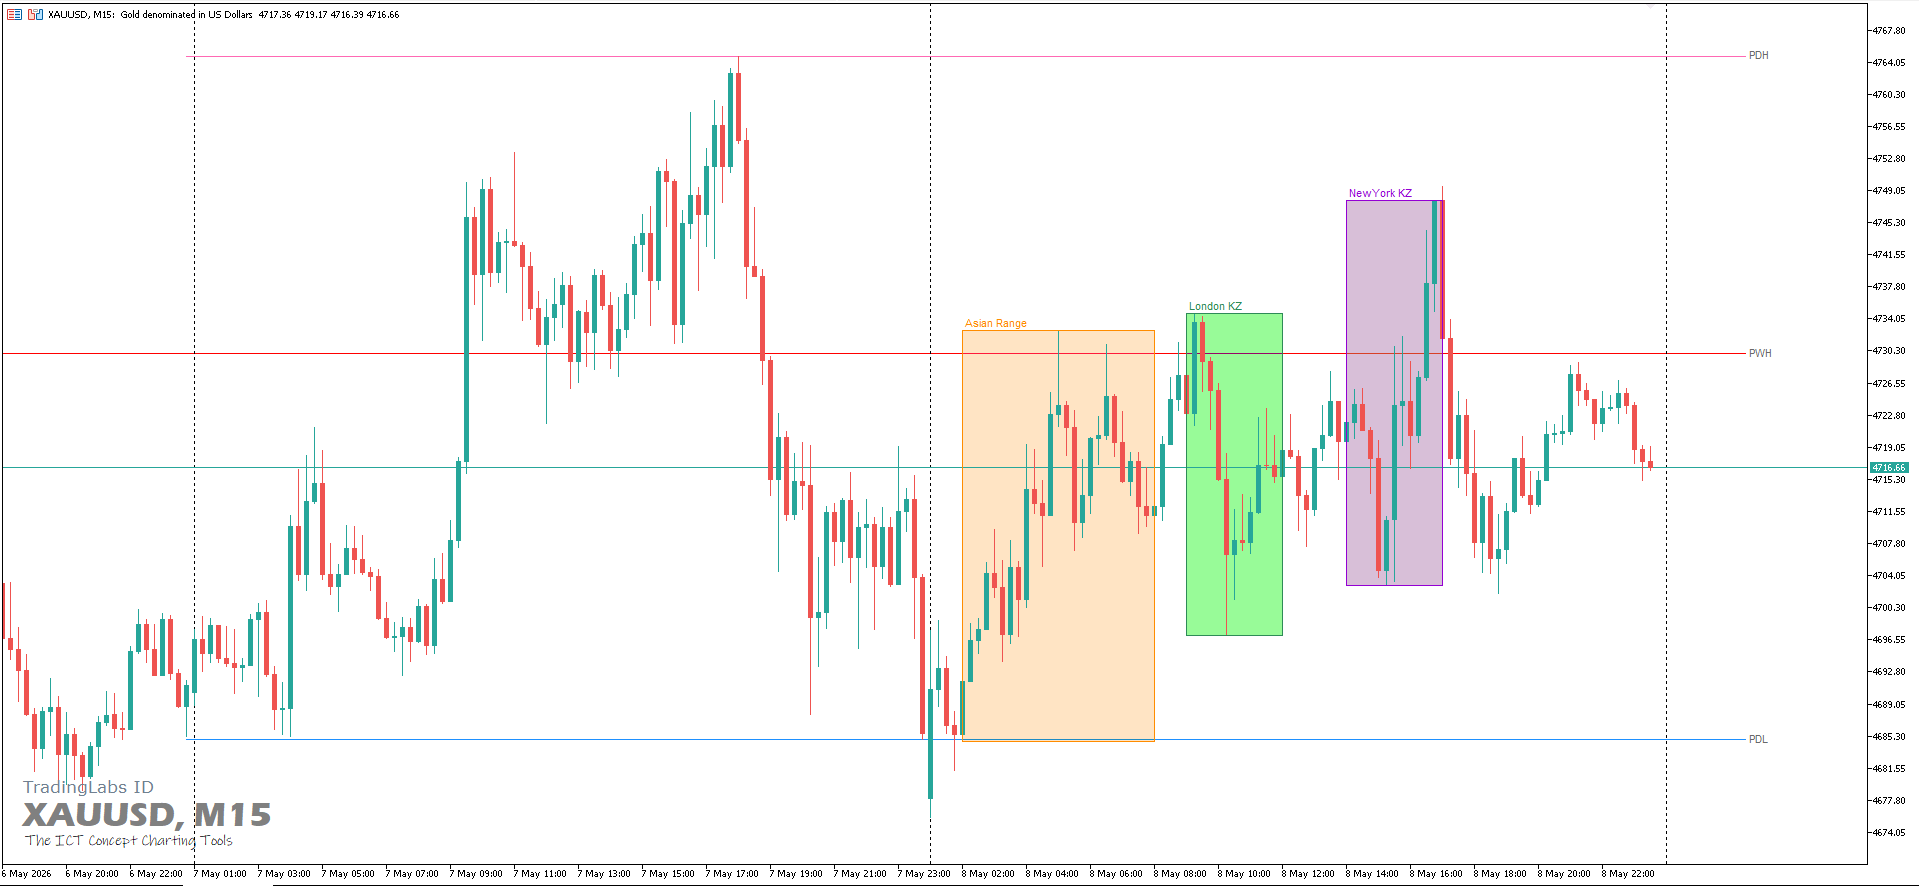
유동성 수준은 종종 가격 변동의 촉매제 역할을 합니다. 전날(PDHL)과 지난주(PWHL)의 고점과 저점은 스톱 주문과 기관 투자자의 매수·매도 활동이 집중되는 주요 기준점이 됩니다. 이러한 수준을 수동으로 파악하는 것은 시간이 많이 소요될 뿐만 아니라 오류가 발생하기 쉽습니다.
‘유동성 활용(DOL)’ 지표는 차트에 이러한 필수 수준을 자동으로 표시하고, 세션 킬 존을 통해 성공 확률이 높은 거래 기회를 강조합니다. 다양한 사용자 지정 옵션을 통해 깔끔하고 전문적이며 정보가 풍부한 화면을 제공하여, 여러분의 거래 결정을 지원합니다.
주요 기능 :-
자동 PDHL 및 PWHL 표시 – 전날 및 지난 주의 고가/저가를 정확하게 즉시 표시합니다.
-
유동성 구역 시각화 – 가격이 유동성 풀을 공략할 가능성이 높은 지점을 명확하게 파악할 수 있습니다.
-
세션 킬 존 – 사용자 정의 가능한 시간대를 설정하여 도쿄, 런던, 뉴욕 세션을 표시함으로써 가장 활발한 거래 시간대에 집중할 수 있습니다.
-
완벽한 사용자 정의 – 선호하는 차트 설정에 맞춰 색상, 선 스타일, 굵기 및 레이블을 조정할 수 있습니다.
-
깔끔하고 사용자 친화적 – 모든 입력 항목이 논리적으로 그룹화되어 차트가 복잡해지지 않으면서 빠르게 설정할 수 있습니다.
-
수동으로 선을 그릴 필요가 없어 시간을 절약할 수 있습니다.
-
주요 유동성 수준 주변의 가격 변동을 예측할 수 있습니다.
-
거래 기회를 위해 가장 관련성 높은 세션에 집중할 수 있습니다.
-
전문적이고 체계적인 차트 레이아웃을 유지할 수 있습니다.
-
이전 일별 및 주별 고점/저점 표시/숨기기
-
선 스타일, 두께 및 색상 조정 가능
-
사용자 정의 가능한 텍스트 레이블 (색상 및 크기)
-
시작/종료 시간이 표시된 세션 마커 (도쿄, 런던, 뉴욕)
-
과거 세션 표시 일수
MetaQuotes Ltd에서 영어로 번역함.
원본 코드: https://www.mql5.com/en/code/75244
 BlueMoon
BlueMoon EA는 EMA 엔벨로프 진입 전략을 적응형 바스켓 관리, 점진적 포지션 크기 조정, 스프레드 필터링, 손실 제한 기능, 그리고 헤징 계정을 위한 자동 거래 복구 기능과 결합한 MT5 전문가 자문가(EA)입니다.
Breakout Distance - Donchian channel with distance-to-trigger panel in ATR units
대부분의 채널 지표는 돌파 수준이 어디에 있는지 알려줍니다. 이 지표는 현재 그 수준에서 얼마나 떨어져 있는지, 바로 행동으로 옮길 수 있는 형태로 알려줍니다. 이 패널은 채널의 상단 및 하단 경계선 모두에 대해 다음 정보를 표시합니다: 해당 수준 자체, 현재 가격과의 거리(해당 종목의 가격 단위 기준), ATR 단위로 표시된 동일한 거리, 가격이 트리거에 가까워질수록 채워지는 근접도 막대, ATR 열이 중요한 이유. 브레이크아웃까지의 거리가 8달러라는 것은 완전히 다른 의미를 띱니다. 이 거리를 현재 ATR로 나누면 그 수치를 세션 간, 변동성 구간 간, 종목 간에 비교할 수 있게 됩니다. 0.30 ATR이라는 수치는 금(Gold)에서든 EURUSD에서든 동일한 의미를 가집니다. 색상 구분: 일반 텍스트 : InpNearATR 이상 떨어져 있음 (기본값 1.0 ATR) 금 : InpNearATR 이내 주황색/빨간색 : InpVeryNearATR 이내 (기본값 0.5 ATR)
Nikkei 225 Gap Continuation EA
‘닛케이 225 갭 지속 EA’는 현물 시장 개장 갭 발생 후 나타나는 상승 및 하락 지속 추세를 거래하는 메타트레이더 5(MetaTrader 5) 전문가 자문가(EA)입니다. 이 EA는 개장 범위 돌파 신호와 VWAP(시간 가중 평균 가격) 확인, 자동 위험 기반 포지션 크기 조정, 부분적 이익 실현, 손익분기점 관리 및 강제 세션 종료 기능을 결합하고 있습니다. 이 EA는 네팅 계좌와 헤징 계좌를 모두 지원합니다.
Asian Session Breakout / BhanuCodeLab
‘아시아 세션 브레이크아웃’은 아시아 거래 세션 동안 형성된 가격 범위를 파악하고, 해당 세션이 종료된 후 가격의 움직임을 모니터링합니다. ‘아시아 고가’와 ‘아시아 저가’는 브로커의 거래일이 끝날 때까지 유효합니다. 따라서 이 가격 범위는 유럽 및 미국 세션 동안 일중 지지선 및 저항선으로 유용하게 활용될 수 있습니다. 간결한 대시보드에는 현재 범위 값, 설정된 세션 시간, 돌파 상태, 돌파 확인 방법 및 확인 시간대가 표시됩니다. 이 지표는 매매를 개시하거나 관리하지 않습니다. 재량 거래나 EA 개발을 위해 시장 구조 및 돌파 정보를 제공합니다.