 MetaTrader 5
 Experts
 지표
지표
 스크립트
스크립트
 라이브러리
라이브러리
 보관함
보관함
당사 팬 페이지에 가입하십시오

Pivot SuperTrend / BhanuCodeLab - MetaTrader 5용 지표

MQL4, MQL5, TradingView Pine Script, NinjaTrader/NinjaScript, TradeStation EasyLanguage, Python을 활용하여 개발합니다. Expert Advisor(EA), 사용자 정의 지표, 대시보드, 알림, 거래 관리 도구, 플랫폼 간 변환, 브로커 API 연동 및 완전한 트레이딩 전략 자동화를 개발합니다.
- 조회수:
- 22
- 평가:
- 게시됨:
- 업데이트됨:
-
 이 코드를 기반으로 한 로봇이나 지표가 필요하신가요? 프리랜스로 주문하세요
프리랜스로 이동
이 코드를 기반으로 한 로봇이나 지표가 필요하신가요? 프리랜스로 주문하세요
프리랜스로 이동

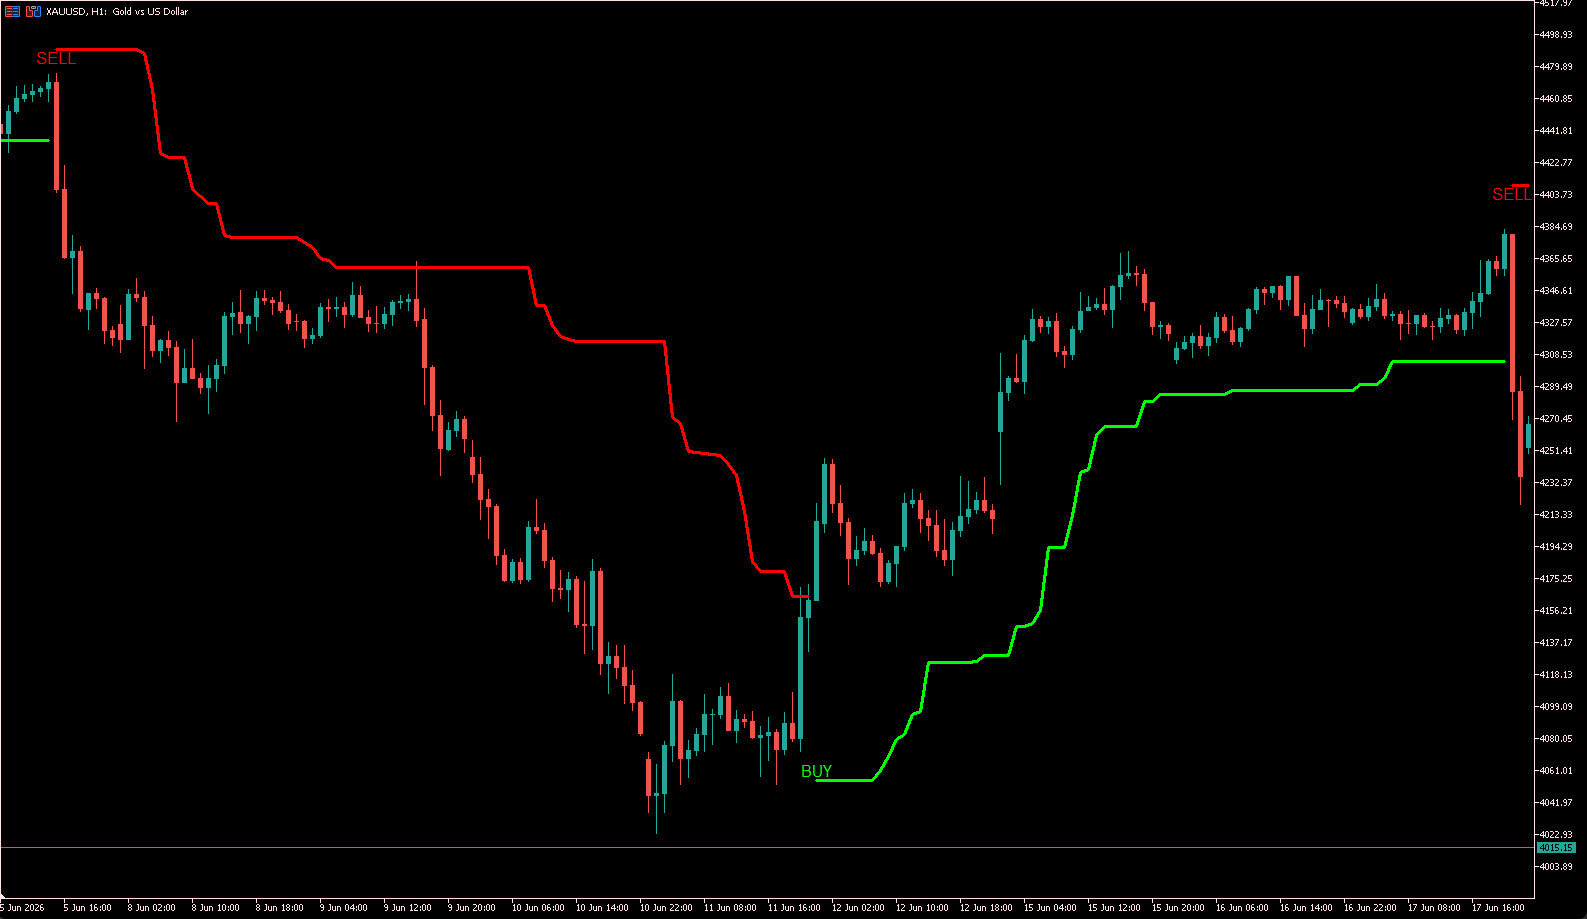
이 지표는 확인된 스윙 고점과 스윙 저점을 계산한 후, 이를 바탕으로 가중 피벗 중심점을 산출합니다. 이 중심점을 기준으로 ATR 기반의 적응형 트레일을 계산하여 현재 추세 방향을 판단합니다.
강세 추세는 강세 트레일 색상으로 표시되며, 약세 추세는 약세 트레일 색상으로 표시됩니다. 추세 방향이 바뀌면 이 지표는 ‘매수(BUY)’ 또는 ‘매도(SELL)’ 태그를 표시하고, 터미널, 푸시 또는 이메일 알림을 생성할 수 있습니다.
선택적 기능으로는 다음이 있습니다:
- 확인된 스윙 고점 및 스윙 저점 마커
- 가중 피벗 중심선
- 최신 확인된 지지선 및 저항선
- 매수(BUY) 및 매도(SELL) 신호 태그
- 종가 캔들 또는 실시간 캔들 알림
- EA에서 접근 가능한 신호 및 추세 버퍼
이 지표는 누구를 위한 것인가?
이 지표는 다음의 트레이더에게 적합합니다:
- 추세 추종 트레이더
- 스윙 트레이더
- 일중 트레이더
- 체계적인 추세 반전 신호를 찾는 트레이더
- 시장 구조 분석을 위해 피벗 고점과 저점을 활용하는 트레이더
- 사용하기 쉬운 추세 및 신호 버퍼가 필요한 EA 개발자
- 변화하는 변동성에 반응하는 ATR 조정 신호를 원하는 트레이더
이 도구는 외환, 귀금속, 지수, 암호화폐 및 MetaTrader 5에서 이용 가능한 기타 상품에 사용할 수 있습니다.
신호 확인 방법
매수(BUY) 신호
지표가 하락 추세에서 상승 추세로 전환될 때 매수 신호가 나타납니다.
다음 사항을 확인하세요:
- 트레일이 강세 색상으로 바뀌는 것
- 차트에 ‘매수(BUY)’ 태그가 표시됨
- 추세 방향 버퍼가 -1에서 1 로 바뀌는 것
매수 신호는 캔들이 마감된 후 확인되면 신뢰도가 높아집니다.
매도 신호
지표가 강세 추세에서 약세 추세로 전환되면 매도 신호가 나타납니다.
다음 사항을 확인하세요:
- 트레일이 약세 색상으로 바뀌는 것
- 차트에 ‘매도(SELL)’ 태그가 표시되는 경우
- 추세 방향 버퍼가 1에서 -1 로 바뀌는 경우
매도 신호는 캔들이 마감된 후 확인될 때 신뢰도가 높아집니다.
권장 신호 확인 방법
신호를 더 안전하게 확인하려면:
- 종가 알림 기능을 활성화하세요.
- 신호 캔들이 마감될 때까지 기다리세요.
- 가격이 트렌드 트레일의 올바른 쪽에 머무르는지 확인하십시오.
- 더 높은 시간대의 추세를 확인하십시오.
- 변동성이 낮거나 횡보하는 시장 상황에서는 신호 진입을 피하십시오.
- 적절한 손절매 및 리스크 관리 규칙을 따르십시오.
이 지표는 그 자체로 완전한 거래 시스템으로 사용되어서는 안 됩니다. 신호는 시장 구조, 지지선과 저항선, 변동성 또는 기타 적절한 거래 방법을 통해 확인되어야 합니다.
권장 시간대
이 지표는 모든 MetaTrader 5 시간대에서 사용할 수 있지만, 일반적으로 다음 시간대에서 더 나은 성과를 보입니다:
- 일중 매매의 경우M15 및 M30
- 스윙 트레이딩 및 보다 안정적인 추세 신호를 위한H1 및 H4
- 장기 추세 분석용D1
대부분의 사용자에게는 H1이 시장 잡음이 적으면서도 추세 변화를 더 명확하게 보여주기 때문에 가장 균형 잡힌 시간대입니다.
M1이나 M5와 같은 더 짧은 시간대에서는 신호가 더 빈번하게 발생할 수 있지만, 횡보장이나 변동성이 매우 높은 시장 상황에서는 허위 반전 신호가 더 많이 발생할 수도 있습니다.
실용적인 접근 방식은 M15 또는 H1에서 주요 신호를 확인한 후, H1 또는 H4를 사용하여 더 넓은 범위의 추세를 확인하는 것입니다.
MetaQuotes Ltd에서 영어로 번역함.
원본 코드: https://www.mql5.com/en/code/75110
Smart Trend Score
스마트 트렌드 스코어(Smart Trend Score)는 여러 가지 추세 및 모멘텀 필터를 활용하여 고품질의 매매 기회를 파악하도록 설계된, 간결하고 가벼운 메타트레이더 5 지표입니다.
 Chaos Theory Lyapunov Exponent EA
Quantitative MT5 Expert Advisor that filters market noise using Chaos Theory and the Largest Lyapunov Exponent (LLE). Trades momentum EMA crossovers only during deterministic market regimes, with built-in ATR risk management.
 Hidden Risk of Ruin Auditor
청산된 포지션의 거래 내역(CSV 파일 또는 동반 스크립트인 RuinExport.mq5가 현재 계좌의 거래 내역에서 자동으로 생성한 파일)을 읽어들이고, 다음 네 가지 독립적인 위험 지표를 보고합니다: 손실 발생 후 거래량 증가, 평균 가격이 더 나빠지는 중복된 동일 방향 포지션, 수익과 손실 간의 수익 비대칭성, 그리고 거래당 지정된 위험 수준에 따른 고전적인 파산 위험 추정치입니다. 이 네 가지 점수는 하나의 A~F 등급으로 통합되며, 평이한 언어로 된 권장 사항이 함께 제공됩니다. CSV 파일이 발견되지 않으면 스크립트가 재현 가능한 데모 거래 내역을 자동으로 생성하므로, 첫 실행 시에도 보고서를 확인할 수 있습니다.
SessionRangeBreakout
런던 세션의 돌파 수준을 반영한 아시아 거래 범위 지표. 진입 화살표, 알림, 푸시 알림. XAUUSD M15에 최적화되어 있습니다.