Produits publiés
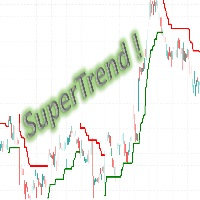
L'indicateur populaire "SuperTrend" est un outil d'analyse technique qui aide à identifier la direction d'une tendance et les points d'entrée ou de sortie potentiels sur les marchés financiers. L'indicateur est basé sur la Moyenne de la Vraie Portée (ATR), qui mesure la volatilité du marché en fonction des gammes de prix. Il est gratuit sur d'autres plateformes et il n'y a aucune raison pour qu'il ne le soit pas ici aussi ! Il est couramment utilisé de trois manières : Pour identifier la tendanc
FREE

UT Bot Alerts — ATR Trailing Stop System Faithful MQL5 & MQL4 conversion of the legendary "UT Bot Alerts" indicator by QuantNomad from TradingView. Originally developed by Yo_adriiiiaan with the core idea by HPotter, and refined into Pine Script v4 with alerts by QuantNomad (Vadim Cissa) — one of the most followed quant developers on TradingView with over 100K followers. The original script has accumulated 1.1 million+ views and 35,500+ favorites on TradingView, making it one of the most popular
FREE

UT Bot Alerts — ATR Trailing Stop System Faithful MQL5 & MQL4 conversion of the legendary "UT Bot Alerts" indicator by QuantNomad from TradingView. Originally developed by Yo_adriiiiaan with the core idea by HPotter, and refined into Pine Script v4 with alerts by QuantNomad (Vadim Cissa) — one of the most followed quant developers on TradingView with over 100K followers. The original script has accumulated 1.1 million+ views and 35,500+ favorites on TradingView, making it one of the most popular
FREE

### Donchian Channels Trend v1.0 A trend-following breakout indicator that encapsulates price action within a dynamic envelope based on historical highs and lows. Originally conceptualized for TradingView, this tool provides a clear visualization of the directional bias using state memory.
**How it works** The algorithm calculates the absolute maximum and minimum values over a specified lookback period. It utilizes a finite state machine (FSM) to maintain the current trend direction based on s
FREE

### Impulse MACD [ LazyBear ] v1.0
Port of LazyBear's open-source TradingView indicator, which has accumulated over 8,700 favorites since its publication in 2015. It filters out false MACD signals by measuring momentum only when price breaks outside a smoothed moving average channel.
#### How it works
The indicator builds a channel using two Smoothed Moving Averages (SMMA) applied to the High and Low. A Zero-Lag EMA (mathematically equivalent to DEMA) is computed on the typical price (HLC3).
FREE

### ADX and DI v1.00
Faithful MQL4/MQL5 port of BeikabuOyaji's "ADX and DI" indicator from TradingView, one of the most widely used ADX implementations on the platform with over 43,000 users. It displays +DI, −DI, and ADX in a single subwindow, using a hybrid smoothing approach — Wilder's method for the Directional Indexes and a simple moving average for the ADX line.
#### How it works
The indicator implements Welles Wilder's Directional Movement System with one notable variation in the fina
FREE

### Donchian Channels Trend v1.0 A trend-following breakout indicator that encapsulates price action within a dynamic envelope based on historical highs and lows. Originally conceptualized for TradingView, this tool provides a clear visualization of the directional bias using state memory.
**How it works** The algorithm calculates the absolute maximum and minimum values over a specified lookback period. It utilizes a finite state machine (FSM) to maintain the current trend direction based on s
FREE

### Bollinger + RSI, Double Strategy v1.1
Faithful MQL4/MQL5 port of ChartArt's popular TradingView strategy (41,800+ users, 990+ favorites). Generates buy and sell signals only when **both indicators confirm simultaneously** — RSI momentum shift + Bollinger Band breakout on the same candle.
**How it works**
The strategy uses an unconventional configuration: a fast RSI(6) with its crossover level set at 50 (acting as a momentum direction filter, not an overbought/oversold detector), combined
FREE

The popular "SuperTrend" indicator is a technical analysis tool designed to help identify trend direction and potential entry or exit points in financial markets. This indicator is built upon the Average True Range (ATR) , which gauges market volatility based on price ranges. It is available for free on other platforms, and this should be no exception! Common Use Cases The SuperTrend is typically utilized in three primary ways: Trend Identification: When the price is trading above the indicator
FREE
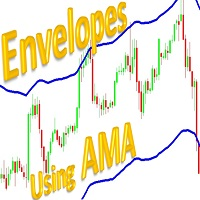
L'indicateur "Envelope of Adaptive Moving Average" est un outil conçu pour vous aider à prendre des décisions éclairées sur le marché financier. Il a été développé pour vous offrir une vue claire de la direction de la tendance et des points d'entrée et de sortie potentiels dans vos transactions.
Cet indicateur repose sur une moyenne mobile adaptative, ce qui signifie qu'il s'ajuste automatiquement aux variations de la volatilité du marché. Cela le rend particulièrement utile sur des marchés à l
FREE

### Bollinger + RSI, Double Strategy v1.1
Faithful MQL4/MQL5 port of ChartArt's popular TradingView strategy (41,800+ users, 990+ favorites). Generates buy and sell signals only when **both indicators confirm simultaneously** — RSI momentum shift + Bollinger Band breakout on the same candle.
**How it works**
The strategy uses an unconventional configuration: a fast RSI(6) with its crossover level set at 50 (acting as a momentum direction filter, not an overbought/oversold detector), combined
FREE
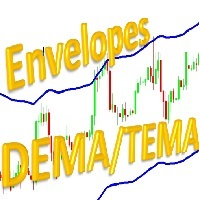
L'indicateur des enveloppes des moyennes mobiles exponentielles (double ou triple) est un outil d'analyse technique conçu pour vous aider à identifier les tendances et les points potentiels de retournement sur les marchés financiers. Cet indicateur offre aux traders la flexibilité de choisir entre deux types de moyennes mobiles exponentielles : la moyenne mobile exponentielle double (DEMA) ou la moyenne mobile exponentielle triple (TEMA).
Principales caractéristiques :
- Double ou triple expon
FREE

### Coral Trend Indicator v1.0
The Coral Trend Indicator is a faithful port of LazyBear's TradingView script (10,900+ favorites) to MetaTrader 4 and MetaTrader 5. It applies Tim Tillson's T3 Moving Average algorithm (1998) as a color-coded trend filter on the price chart.
#### How it works
The indicator passes the price through six cascaded Exponential Moving Averages, then combines stages 3 through 6 using binomial polynomial coefficients derived from the Constant D parameter. This pro
FREE

### ADX and DI v1.00
Faithful MQL4/MQL5 port of BeikabuOyaji's "ADX and DI" indicator from TradingView, one of the most widely used ADX implementations on the platform with over 43,000 users. It displays +DI, −DI, and ADX in a single subwindow, using a hybrid smoothing approach — Wilder's method for the Directional Indexes and a simple moving average for the ADX line.
#### How it works
The indicator implements Welles Wilder's Directional Movement System with one notable variation in the fina
FREE

Heikin Ashi Trend Indicator v2.1
MQL5/MQL4 port of the Heikin Ashi Trend Indicator originally published on TradingView by dman103 (2,300+ likes, 80,000+ views). It combines Heikin Ashi candle smoothing with the Tilson T3 moving average to produce clean, noise-reduced trend signals directly on the price chart.
#### How it works
The indicator processes price data in two stages. First, it computes Heikin Ashi OHLC values from the regular candlestick data. Then, it applies the Tilson T3 moving a
FREE

### Impulse MACD [ LazyBear ] v1.0
Port of LazyBear's open-source TradingView indicator, which has accumulated over 8,700 favorites since its publication in 2015. It filters out false MACD signals by measuring momentum only when price breaks outside a smoothed moving average channel.
#### How it works
The indicator builds a channel using two Smoothed Moving Averages (SMMA) applied to the High and Low. A Zero-Lag EMA (mathematically equivalent to DEMA) is computed on the typical price (HLC3).
FREE

### Heikin Ashi Trend Indicator v2.1
MQL5/MQL4 port of the Heikin Ashi Trend Indicator originally published on TradingView by dman103 (2,300+ likes, 80,000+ views). It combines Heikin Ashi candle smoothing with the Tilson T3 moving average to produce clean, noise-reduced trend signals directly on the price chart.
#### How it works
The indicator processes price data in two stages. First, it computes Heikin Ashi OHLC values from the regular candlestick data. Then, it applies the Tilson T3
FREE

### Coral Trend Indicator v1.0
The Coral Trend Indicator is a faithful port of LazyBear's TradingView script (10,900+ favorites) to MetaTrader 4 and MetaTrader 5. It applies Tim Tillson's T3 Moving Average algorithm (1998) as a color-coded trend filter on the price chart.
#### How it works
The indicator passes the price through six cascaded Exponential Moving Averages, then combines stages 3 through 6 using binomial polynomial coefficients derived from the Constant D parameter. This pro
FREE

Exobeacon Telemetry est une surcouche d'analyse de sentiment qui montre en temps réel comment l'actualité actuelle impacte les marchés que vous tradez. Le produit utilise le backend Exobeacon Labs (backend propriétaire à api.exobeacon.com ), qui surveille 49 sources d'actualités et traite chaque batch via une analyse sémantique LLM. Le résultat : un score de sentiment consolidé par actif, mis à jour chaque minute, visualisé directement sur votre graphique. Contrairement aux calendriers économiqu
FREE

## Français
### Correlated MT5 v8.1
Correlated MT5 v8.1 est un Expert Advisor multi-symboles pour MetaTrader 5 qui analyse les paniers d’actifs, la corrélation et le retour à la moyenne. Il peut être utilisé comme tableau de lecture du marché ou comme système automatique avec gestion de l’exposition, de la taille de position et du risque.
#### Fonctionnement
- Construit un panier de 3 à 10 symboles et normalise leurs prix. - Calcule une matrice de corrélation et peut filtrer le bruit a

Français
### ExoPanels v7.1
ExoPanels v7.1 est un panneau d’analyse pour MetaTrader 5 qui affiche les corrélations, les rendements et les métriques statistiques de plusieurs symboles dans une seule vue. Son objectif principal est d’aider à repérer une surexposition entre actifs et à comparer le comportement du marché sans changer constamment de graphique.
#### Fonctionnement
L’indicateur lit les symboles configurés, charge les données historiques de l’unité de temps active et calcule u