• Panoramica
  • Recensioni
  • Commenti

Murrey Math Line

Murrey Math Lines

The concept of this technical analysis system was developed by T. Henning Murrey in 1995 and described in The Murrey Math Trading System; For All Markets. The main concept here is that all markets behave in the same manner based upon the observations made by W.D. Gann. To date, the Murrey Math Line X it is one the most popular methods of Forex analysis and trading.

Formula

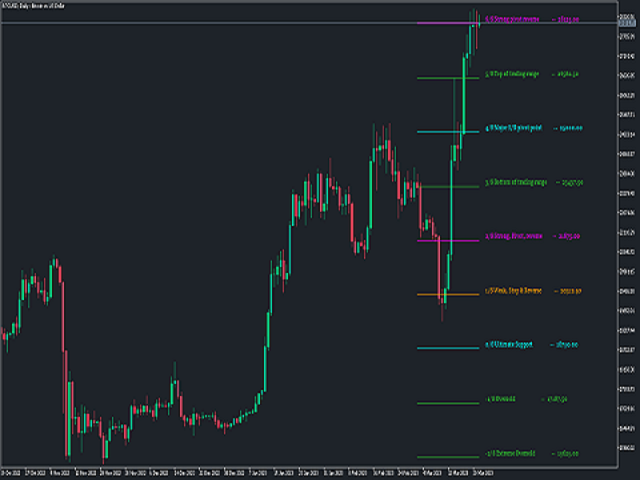
The Murrey Math Line X is calculated with the help of price movement segment, which, in accordance to Gann, is divided into 9 sections. So, the indicator makes 9 levels in the proportion of 0%, 12.5%, 25%, 37.5%, 50%. 62.5%, 75%. 87.5%, and 100%.

Trading use

The Murrey Math Line X is a complex indicator, which may be applied independently or together with other methods of technical analysis. It has become popular in Russia.

The indicator contains several lines from 0/8 to 8/8. Every line has its own operating conditions. Some of them act as points of price support and resistance, the other ones, as a magnets for price.

Line 1/8. This is a weak line. If a price declines too fast and stops near this line, there is a high possibility that it will reverse upwards. If a price does not stop near this line, it will continue moving to the 0/8 line.

Lines 2/8 and 6/8. These two lines are very strong levels of resistance and support and are inferior only to the 4/8 line in their ability to reverse the price movement.

Line 3/8. If a price is below this line and goes up, so it will be difficult for it to break this level. If a price hits the level of 3/8 and stays there for two trading weeks, so it will stay above the line and spend some time moving in the 3/8-5/8 corridor.

Line 4/8. This is a key line; it provides the best support or resistance.

Line 5/8. If a price moves around the 5/8 line and stays near this line for about two trading weeks, so the best selling level is between the 3/8 and 5/8 lines. In case a price falls below the 5/8 line, it will probably will drop further until the next resistance level.

Line 7/8. This is the weakest resistance/support level. If a price slides too fast and stops at this level, it is likely to reverse downwards. In case a price does not stop near the line, it will move up to the 8/8 line.

Lines 8/8 and 0/8. These are the strongest levels; they provide great resistance and support.


Prodotti consigliati
mql4 version:  https://www.mql5.com/en/market/product/44606   Simple indicator to calculate profit on fibonacci retracement levels with fixed lot size, or calculate lot size on fibonacci levels with fixed profit. Add to chart and move trend line to set the fibonacci retracement levels. Works similar as default fibonacci retracement line study in Metatrader. Inputs Fixed  - select what value will be fix, lot or profit Fixed value  - value that will be fix on all levels Levels  - levels for which
Questo indicatore di tendenza multi time frame e multi simbolo invia un avviso quando è stata identificata una forte tendenza o inversione di tendenza. Può farlo selezionando di costruire il cruscotto usando Media mobile (singola o doppia (crossover MA)), RSI, bande di Bollinger, ADX, indice composito (Constance M. Brown), Awesome (Bill Williams), MACD (linea di segnale ), Heiken Ashi livellato, media mobile di Hull, crossover stocastici, attivatore di Gann HiLo e indice dinamico dei trader. Può
- It is 39$ now - 50% Discount (Real price is 80$) Contact me for instruction, any questions! Introduction The breakout and retest strategy is traded support and resistance levels. it involves price breaking through a previous level.  The strategy is designed to help traders do two main things, the first is to avoid false breakouts. Many false breakouts start with a candlestick that breaks out of a level but ends with an immediate candlestick that brings the price back into the level. The secon
To get access to MT4 version please click here . This is the exact conversion from TradingView: "RedK_Supply/Demand Volume Viewer v3.0" by "RedKTrader" This is a light-load processing and non-repaint indicator. All input options are available.  Buffers are available for processing in EAs. You can message in private chat for further changes you need. Thanks for downloading
The indicator ‘Probability Range Bands’ gives a prediction of the amount, how much the asset is moving from its current price. The range bands give probabilities, that the candle close will not exceed this certain price level. It is also called the expected move for the current candle close.   This Indicator is based on statistical methods, probabilities and volatility. Asset price is assumed to follow a log-normal distribution. Therefore, log returns are used in this indicator to determine the
Heikin Ashi Heikin Ashi is a charting technique that can be used to predict future price movements. It is similar to traditional candlestick charts. However, unlike a regular candlestick chart, the Heikin Ashi chart attempts to filter out some of the market noise by smoothing out strong price swings to better identify trend movements in the market. To create Heiken Ashi, a formula is used in which price data is entered, while ordinary candles are built only on bare numbers, without using any
Considering the main theories of Forex (Dow Theory, support lines, chart patterns, and Fibonacci retracements), It tells you the price range where whales (large investors) are likely to appear. You can trade at the price points that professionals also aim for. You no longer have to warry about where to aim next. We are live-streaming the actual operation of the system. Please check for yourself if it is usable. Please check it out for yourself. https://www.youtube.com/@ganesha_forex We do n
The Rubdfx swing indicator is a useful tool for traders looking to identify trend changes in a particular instrument they are trading. It is designed to draw a line on the main chart, and the signals are indicated by color changes with signal alerts. The color green is used to indicate a bullish trend, while the color pink is used to indicate a bearish trend. These colors can be customized to fit the trader's preferences or theme. The Rubdfx swing indicator has the ability to spot both long-te
Simple indicator to calculate fibonacci retracement levels on time. Add to chart and move trend line to set the fibonacci retracement levels. Inputs Levels  - levels for which to calculate values, separated by space, default are fibonacci levels Show time  - if true, time will be shown on levels Show date  - if true, date will be shown on levels Show fibonacci level  - if true, value of levels will be shown Fibonacci lines color  - color of levels Trend line color  - color of trend line which de
FREE
Siamo entusiasti di presentare la nostra più recente innovazione negli indicatori MetaTrader 5, progettata per migliorare notevolmente i vostri processi di trading grazie ad un alto grado di funzionalità e facilità d'uso. Incorpora un robusto set di funzioni volte a semplificare la vostra analisi dei grafici e a sfruttare al massimo le vostre decisioni di trading. Ecco un breve riassunto delle sue incredibili caratteristiche: 1. **Disegno Rapido degli Oggetti (ab T)**: Risparmiate tempo prezi
Displays trends in current chart. You can display trends of multiple timeframes in one chart by inserting this indicator as often as you want. Key features: displays trend line by finding highs and lows counts number of high/low of current trend in different color (long/short) allows you to display multiple timeframe trends in one chart Settings: Indicator Name: if you want to show M5 and H1 on one chart add TITrend twice to your current chart and rename M5 to "TITrendM5" and H1 to "TITrendH1" C
Stock Trend Navigator
Mohammad Taher Halimi Tabrizi
In the fast-paced and ever-evolving world of stock trading, having a reliable compass is essential for navigating the complexities of the financial markets. Meet the Stock Trade Navigator, your trusted partner in the quest for investments. Unlock the Power of Data: Our Stock Trade Navigator is not just a tool; it's your data-driven co-pilot. Harnessing cutting-edge algorithms and real-time market data, it empowers you with a comprehensive view of the financial landscape, enabling you to make inf
FIlter Profesional
Ignacio Agustin Mene Franco
Filter Professional , Safari pack indicator 3, It has an indicator that is a type of moving average with color that will mark the entrance perfect at different times, when it marks the green line, an upward trend is coming and it is entry for purchase, when it marks the gold line it is a downtrend gives bearish entry zone. It is used for the Forex markets and synthetic indices all pairs! All temporalities! Good profit!
AI Forecast MT5
Leonardo Antonio Camacaro Armas
The "AI Forecast" indicator is the result of a unique experiment in which I asked an AI how to create the best indicator to anticipate the market. The AI suggested measuring the past history of the price and its reactions to different levels, and then calculating the probabilities of the price reaction in the future. With this idea, I designed with the help of another AI the "AI Forecast" indicator, which adapts to any MetaTrader chart and shows you three lines: one for entry and two for poss
OHLC Volume
Mahmoud Helmy Sedik Mohamed Mansour
OHLC Volume Histogram displays the difference between two streams of the  OHLC Volume volume indicator  as a colored histogram. There are no input parameters. Calculation: Histogram = StreamUP - StreamDN where: StreamUP = Volume * UP_Coeff / (UP_Coeff+DN_Coeff) StreamDN = Volume * DN_Coeff / (UP_Coeff+DN_Coeff) UP_Coeff = High-Open DN_Coeff = Close-Low Volume - tick volume
Rocket Trend
Andriy Sydoruk
The Rocket Trend indicator is trending. The indicator draws two-color points connected by lines along the chart. This is a trend indicator, it is an algorithmic indicator. It is easy to work and understand when a blue circle appears, you need to buy, when a red one appears, sell. The indicator is used for scalping and pipsing, and has proven itself well. Rocket Trend is available for analyzing the direction of the trend for a specific period of time. Ideal for novice traders learning the laws o
The indicator is the advanced form of the MetaTrader 4 standard Fibonacci tool. It is unique and very reasonable for serious Fibonacci traders. Key Features Drawing of Fibonacci retracement and expansion levels in a few seconds by using hotkeys. Auto adjusting of retracement levels once the market makes new highs/lows. Ability to edit/remove any retracement & expansion levels on chart. Auto snap to exact high and low of bars while plotting on chart. Getting very clear charts even though many ret
This is the spike indicator , determining the highest high and lowest lows of price in the given period ,  it is also a zigzag indicator , to it may recalculate the values  or repaint if a new higher high or lower low forms in that given period,so beware How ever the indicator can be very powerful when used with other technical indicators for entry confirmation  Be sure to check out some of my other premium products   
Patternist
Ziya Gurkan Badem
* Zigzag corretto e accelerato. (È possibile modificare l'intervallo) * Lo zigzag viene aggiornato con ogni nuova candela/barra. * Se vuoi, attivando il pulsante, solo quando fai clic sul pulsante, cerca un motivo. Se lo fai automaticamente, cerca ogni volta che il grafico viene aggiornato. * 17 modelli armonici usati di frequente e un modello speciale che puoi definire le tue proporzioni. * Puoi mantenere il grafico semplice con la visualizzazione dei prezzi. Puoi creare una rappresentazione t
KT Price Border MT5
KEENBASE SOFTWARE SOLUTIONS
KT Price Border creates a three-band price envelope that identifies potential swing high and low areas in the market. These levels can also be used as dynamic market support and resistance. The mid-band can also be used to identify the trend direction. As a result, it also functions as a trend-following indicator. In addition, its ease of use and more straightforward conveyance of trade signals significantly benefit new traders. Features It works well on most of the Forex currency pairs. It
Presentazione       Quantum Breakout PRO   , l'innovativo indicatore MQL5 che sta trasformando il modo in cui scambi le zone di breakout! Sviluppato da un team di trader esperti con un'esperienza di trading di oltre 13 anni,       Quantum Breakout PRO       è progettato per spingere il tuo viaggio di trading a nuovi livelli con la sua strategia innovativa e dinamica della zona di breakout. Quantum Breakout Indicator ti fornirà frecce di segnalazione sulle zone di breakout con 5 zone target
L'On-Balance Volume (OBV) è un indicatore tecnico che mette in relazione volume e prezzo per identificare i movimenti di prezzo. L'idea di base dell'OBV è che le variazioni di volume generalmente precedono le variazioni di prezzo. L'indicatore accumula i volumi per i periodi in cui il prezzo chiude in rialzo e sottrae i volumi per i periodi in cui il prezzo chiude in ribasso. Il risultato è un valore utilizzato per identificare la direzione del trend dell'asset. L'interpretazione dell'OBV è s
Signals Supply and Demand Force
Claudio Angelo Chumpitaz Flores
Este Indicador esta basado en el rebote de un soporte o resistencia fuerte con un indicador que tiene interno de fuerza de movimiento. Tiene la opción de ver el soporte y resistencia actual y ver la fuerza que tiene dicho soporte o resistencia.(Activando el parámetro Ver_Sop_Res ) Parámetros: Sop o Res, Fuerza Mayor a...: Con este parámetro podrás ajustar la fuerza del soporte o resistencia, con la cual el indicador evaluara si es una señal bajista o alcista. Velas Historial: Con este parámetro
PivotePoint MT5
Kambiz Shahriarynasab
Unlike many other indicators including the moving average indicator, Pivot Point can be a leading indicator. In these systems, the price levels of the previous period are used to determine the critical points instead of relying on the current price performance. Such an approach provides a clear framework for traders to plan their trades in the best possible way. You can use this method and its combination with the methods you want to build and use a powerful trading setup. MT4 version Let us k
Fibo Ruby
Ignacio Agustin Mene Franco
Fibo Ruby indicator 5/5 pack ruby fibo ruby ​​has the strategy of a programmed fibonacci to capture the bullish trend as bass player ideal for grabbing rebounds at the points of 23.6, 38.2, 50.0 and 61.8 It adapts to any temporality, be it for scalping or intraday. works for forex markets, all pairs It is used for synthetic index markets, all pairs great for boom and crash!
Dragon Multi Indicator MT5
Mansour Babasafary
5 (1)
74% discount for the next 10 buyers (original price $605): 1 left Get a 50% bonus by buying (or even renting) any of our products. After buying (or renting), send a message for more information. 3 Indicators in 1 indicator Strategy based on price action Made specifically for the best forex currency pairs Can be used in the best time frame of the market at a very reasonable price This indicator is basically 3 different indicatos . But we have combined these 3 indicators in 1 indicator so th
The indicator monitors the Dinapoli MACD trend in multiple timeframes for the all markets filtered and shows the results on Dashboard. Key Features Indicator can be used for all markets Monitors every timeframe, from 1 Min to Monthly Parameters UseMarketWatch: Set true to copy all symbols available in market watch MarketWatchCount : Set the number of symbols that you want to copy from the market watch list. CustomSymbols: Enter the custom symbols that you want to be available in dashboard.
Xtrade Trend Detector
Dago Elkana Samuel Dadie
Xtrade Trend Detector is an indicator capable of finding the best opportunities to take a position in any stock market. Indeed, it is a great tool for scalpers but also for Daytraders. You could therefore use it to identify areas to trade, it fits easily on a chart. I use it to detect trends on Big timeframes and take positions on Small timeframes. Don't hesitate to give me a feedback if you test it.
The principle of this indicator is very simple: detecting the trend with Moving Average, then monitoring the return point of graph by using the crossing of Stochastic Oscillator and finally predicting BUY and SELL signal with arrows, alerts and notifications. The parameters are fixed and automatically calculated on each time frame. Example: If you install indicator on EURUSD, timeframe M5: the indicator will detect the main trend with the Moving Average on this timeframe (for example the Moving
One of the simplest Pivot Point indicator, easy to operate, and most complete for a single chart in determining   Resistance   and   Support  level lines. In single chart,  it will show R&S Level Line with 5 popular types of Pivot Point, Highest&Lowest of closing price Include the Trend and up to 3 Time Frames. Five   types   (Floor, Woodie, Camarilla, DeMark, & Fibonacci)   of popular   Pivot Points   in determining   Resistance   and   Support   levels. With just using simple button on th
Gli utenti di questo prodotto hanno anche acquistato
Atomic Analyst MT5
Issam Kassas
5 (13)
Innanzitutto, vale la pena sottolineare che questo indicatore di trading non è repaint, non è ridisegno e non presenta ritardi, il che lo rende ideale sia per il trading manuale che per quello automatico. Manuale utente: impostazioni, input e strategia. L'Analista Atomico è un indicatore di azione del prezzo PA che utilizza la forza e il momentum del prezzo per trovare un miglior vantaggio sul mercato. Dotato di filtri avanzati che aiutano a rimuovere rumori e segnali falsi, e aumentare il pote
Innanzitutto è importante sottolineare che questo sistema di trading è un indicatore Non-Repainting, Non-Redrawing e Non-Lagging, il che lo rende ideale sia per il trading manuale che per quello automatico. Corso online, manuale e download di preset. Il "Sistema di Trading Smart Trend MT5" è una soluzione completa pensata sia per i trader principianti che per quelli esperti. Combina oltre 10 indicatori premium e offre più di 7 robuste strategie di trading, rendendolo una scelta versatile per div
Quantum Trend Sniper
Bogdan Ion Puscasu
5 (39)
Presentazione       Quantum Trend Sniper Indicator   , l'innovativo indicatore MQL5 che sta trasformando il modo in cui identifichi e scambi le inversioni di tendenza! Sviluppato da un team di trader esperti con un'esperienza di trading di oltre 13 anni,       Indicatore Quantum Trend Sniper       è progettato per spingere il tuo viaggio di trading verso nuove vette con il suo modo innovativo di identificare le inversioni di tendenza con una precisione estremamente elevata. *** Acquista Quant
FX Volume MT5
Daniel Stein
4.94 (17)
Ricevi il tuo aggiornamento quotidiano sul mercato con dettagli e schermate tramite il nostro Morning Briefing qui su mql5 e su Telegram ! FX Volume è il PRIMO e UNICO indicatore di volume che fornisce una visione REALE del sentiment del mercato dal punto di vista del broker. Fornisce informazioni straordinarie su come gli operatori di mercato istituzionali, come i broker, sono posizionati sul mercato Forex, molto più velocemente dei rapporti COT. Vedere queste informazioni direttamente sul vo
Innanzitutto, vale la pena sottolineare che questo Strumento di Trading è un Indicatore Non-Ridipingente, Non-Ridisegnante e Non-Laggante, il che lo rende ideale per il trading professionale. Corso online, manuale utente e demo. L'Indicatore Smart Price Action Concepts è uno strumento molto potente sia per i nuovi che per i trader esperti. Racchiude più di 20 utili indicatori in uno solo, combinando idee di trading avanzate come l'Analisi del Trader del Circolo Interno e le Strategie di Trad
A key element in trading is zones or levels from which decisions to buy or sell a trading instrument are made. Despite attempts by major players to conceal their presence in the market, they inevitably leave traces. Our task was to learn how to identify these traces and interpret them correctly. Reversal First Impulse levels (RFI)   -  Version MT4                  INSTRUCTIONS                 RUS                 ENG                         R ecommended to use with an indicator   -  TREND PRO  
TPSproTREND PrO MT5
Roman Podpora
5 (7)
TPSpro TRENDPRO  - is a trend indicator that automatically analyzes the market and provides information about the trend and each of its changes, as well as giving signals for entering trades without redrawing! The indicator uses each candle, analyzing them separately. referring to different impulses - up or down impulse. Exact entry points into transactions for currencies, crypto, metals, stocks, indices!  -  Version MT4                  DETAILED DESCRIPTION        /       TRADING SETUPS       
Trend Screener Pro MT5
STE S.S.COMPANY
4.87 (62)
Indicatore di tendenza, soluzione unica rivoluzionaria per il trading di tendenze e il filtraggio con tutte le importanti funzionalità di tendenza integrate in un unico strumento! È un indicatore multi-timeframe e multi-valuta al 100% non ridipingibile che può essere utilizzato su tutti i simboli/strumenti: forex, materie prime, criptovalute, indici e azioni. Trend Screener è un indicatore di tendenza che segue un indicatore efficiente che fornisce segnali di tendenza a freccia con punti nel gra
Quantum Heiken Ashi PRO MT5
Bogdan Ion Puscasu
4.5 (8)
Ti presentiamo   Quantum Heiken Ashi PRO Progettate per fornire informazioni chiare sulle tendenze del mercato, le candele Heiken Ashi sono rinomate per la loro capacità di filtrare il rumore ed eliminare i falsi segnali. Dì addio alle confuse fluttuazioni dei prezzi e dai il benvenuto a una rappresentazione grafica più fluida e affidabile. Ciò che rende il Quantum Heiken Ashi PRO davvero unico è la sua formula innovativa, che trasforma i dati tradizionali delle candele in barre colorate di faci
AW Trend Predictor MT5
AW Trading Software Limited
4.77 (56)
La combinazione di trend e livelli di rottura in un unico sistema. Un algoritmo di indicatore avanzato filtra il rumore del mercato, determina la tendenza, i punti di ingresso e i possibili livelli di uscita. I segnali indicatori sono registrati in un modulo statistico, che permette di selezionare gli strumenti più adatti, mostrando l'efficacia dello storico dei segnali. L'indicatore calcola i segni Take Profit e Stop Loss. Manuale e istruzioni ->   QUI   / versione MT4 ->   QUI Come fare tradi
ICT, SMC, SMART MONEY CONCEPTS, SMART MONEY, Smart Money Concept, Support and Resistance, Trend Analysis, Price Action, Market Structure, Order Blocks, BOS/CHoCH,   Breaker Blocks ,  Momentum Shift,   Supply&Demand Zone/Order Blocks , Strong Imbalance,   HH/LL/HL/LH,    Fair Value Gap, FVG,  Premium  &   Discount   Zones, Fibonacci Retracement, OTE, Buy Side Liquidity, Sell Side Liquidity, BSL/SSL Taken, Equal Highs & Lows, MTF Dashboard, Multiple Time Frame, BigBar, HTF OB, HTF Market Structure
FX Power MT5 NG
Daniel Stein
5 (5)
Ricevi il tuo aggiornamento quotidiano sul mercato con dettagli e schermate tramite il nostro Morning Briefing qui su mql5 e su Telegram ! FX Power MT5 NG è la nuova generazione del nostro popolare misuratore di forza delle valute, FX Power. Cosa offre questo misuratore di forza di nuova generazione? Tutto ciò che avete amato dell'FX Power originale IN PIÙ Analisi della forza di ORO/XAU Risultati di calcolo ancora più precisi Periodi di analisi configurabili individualmente Limite di calcolo pe
Professional Scalping Tool on Deriv Attention! The indicator will be sold in limited quantities!!! The previous 5 copies were sold for $250 The remaining 4 copies will be sold for $350 The next price is $500 Description: This trading indicator is designed for professional traders focused on scalping. Designed with the market in mind, it provides highly accurate spike trading signals. It works on the M1 timeframe and supports the following symbols: Boom 300 Index, Boom 500 Index, Boom 1000 I
IX Power MT5
Daniel Stein
5 (3)
IX Power   porta finalmente l'imbattibile precisione di FX Power ai simboli non-Forex. Determina con precisione l'intensità delle tendenze a breve, medio e lungo termine dei vostri indici preferiti, azioni, materie prime, ETF e persino criptovalute. Potete   analizzare tutto ciò che   il vostro terminale ha da offrire. Provatelo e sperimentate come   il vostro tempismo migliori significativamente   durante il trading. Caratteristiche principali di IX Power Risultati di calcolo precisi al
TrendDecoder Premium MT5
Christophe, Pa Trouillas
5 (2)
Identificare i range e le prossime mosse probabili     |    Ottenere i primi segnali e la forza delle tendenze     |    Ottenere uscite chiare prima dell'inversione     |    Individuare i livelli di Fibo che il prezzo testerà   |  Indicatore non tracciante e non ritardato - ideale per il trading manuale e automatizzato - adatto a tutti gli asset e a tutte le unità temporali 50% di sconto   - per il lancio poi torna a   >>   149 $ Dopo l'acquisto,   contattatemi su questo canale  per le impostazi
Introducing the South African Sniper indicator created by a small group of traders with a few years trading trading the financial market profitably . This is a plug and play indicator that provides you with  BUY and SELL (SNIPER ENTRY) signals with TARGET and trail stops. The indicator Works with all MT5 trading instruments. The indicator uses previous  chart data as receipt to speculate on future market moves.
Auto Order Block with break of structure based on ICT and Smart Money Concepts Futures Break of Structure ( BoS )             Order block ( OB )            Higher time frame Order block / Point of Interest ( POI )    shown on current chart           Fair value Gap ( FVG ) / Imbalance   ,  MTF      ( Multi Time Frame )    Volume Imbalance     ,  MTF          vIMB Gap’s Equal High / Low’s     ,  MTF             EQH / EQL Liquidity               Current Day High / Low           HOD /
RelicusRoad Pro MT5
Relicus LLC
4.82 (22)
Ora $ 147 (aumentando a $ 499 dopo alcuni aggiornamenti) - account illimitati (PC o MAC) Manuale utente di RelicusRoad + Video di formazione + Accesso al gruppo Discord privato + Stato VIP UN NUOVO MODO DI GUARDARE IL MERCATO RelicusRoad è l'indicatore di trading più potente al mondo per forex, futures, criptovalute, azioni e indici, fornendo ai trader tutte le informazioni e gli strumenti di cui hanno bisogno per rimanere redditizi. Forniamo analisi tecniche e piani di trading per aiutar
Blahtech Supply Demand MT5
Blahtech Limited
4.57 (14)
Was: $299  Now: $99   Supply Demand uses previous price action to identify potential imbalances between buyers and sellers. The key is to identify the better odds zones, not just the untouched ones. Blahtech Supply Demand indicator delivers functionality previously unavailable on any trading platform. This 4-in-1 indicator not only highlights the higher probability zones using a multi-criteria strength engine, but also combines it with multi-timeframe trend analysis, previously confirmed swings
Was: $249  Now: $99   Market Profile defines a number of day types that can help the trader to determine market behaviour. A key feature is the Value Area, representing the range of price action where 70% of trading took place. Understanding the Value Area can give traders valuable insight into market direction and establish the higher odds trade. It is an excellent addition to any system you may be using. Inspired by Jim Dalton’s book “Mind Over Markets”, this indicator is designed to suit the
Top indicator for MT5   providing accurate signals to enter a trade without repainting! It can be applied to any financial assets:   forex, cryptocurrencies, metals, stocks, indices .  Watch  the video  (6:22) with an example of processing only one signal that paid off the indicator! MT4 version is here It will provide pretty accurate trading signals and tell you when it's best to open a trade and close it. Most traders improve their trading results during the first trading week with the help of
Advanced Supply Demand MT5
Bernhard Schweigert
4.53 (15)
La migliore soluzione per qualsiasi principiante o trader esperto! Questo indicatore è uno strumento di trading unico, di alta qualità e conveniente perché abbiamo incorporato una serie di funzionalità proprietarie e una nuova formula. Con questo aggiornamento, sarai in grado di mostrare fusi orari doppi. Non solo potrai mostrare una TF più alta, ma anche entrambe, la TF del grafico, PIÙ la TF più alta: SHOWING NESTED ZONES. Tutti i trader di domanda di offerta lo adoreranno. :) Informazioni imp
Innanzitutto, è importante sottolineare che questo sistema di trading è un indicatore non repainting, non redrawing e non lagging, il che lo rende ideale per il trading professionale. Corso online, manuale utente e demo. Il "Sistema di Trading di Supporto e Resistenza Intelligente" è un indicatore avanzato progettato per trader nuovi ed esperti. Permette ai trader di ottenere precisione e fiducia sul mercato forex. Questo sistema completo combina più di 7 strategie, 10 indicatori e varie approc
Trend Forecaster
Alexey Minkov
5 (3)
The Trend Forecaster indicator utilizes a unique proprietary algorithm to determine entry points for a breakout trading strategy. The indicator identifies price clusters, analyzes price movement near levels, and provides a signal when the price breaks through a level. The Trend Forecaster indicator is suitable for all financial assets, including currencies (Forex), metals, stocks, indices, and cryptocurrencies. You can also adjust the indicator to work on any time frames, although it is recommen
Matrix Arrow Indicator MT5
Juvenille Emperor Limited
5 (14)
Matrix Arrow Indicator MT5   è un trend unico 10 in 1 che segue un indicatore multi-timeframe al   100% non ridipinto   che può essere utilizzato su tutti i simboli/strumenti:   forex ,   materie prime ,   criptovalute ,   indici ,   azioni .  Matrix Arrow Indicator MT5  determinerà la tendenza attuale nelle sue fasi iniziali, raccogliendo informazioni e dati da un massimo di 10 indicatori standard, che sono: Indice di movimento direzionale medio (ADX) Indice del canale delle materie prime (CCI
Gartley Hunter Multi
Siarhei Vashchylka
5 (6)
Gartley Hunter Multi - An indicator for searching for harmonic patterns simultaneously on dozens of trading instruments and on all classic timeframes: (m1, m5, m15, m30, H1, H4, D1, Wk, Mn). Manual (Be sure to read before purchasing) | Version for MT4 Advantages 1. Patterns: Gartley, Butterfly, Shark, Crab. Bat, Alternate Bat, Deep Crab, Cypher 2. Simultaneous search for patterns on dozens of trading instruments and on all classic timeframes 3. Search for patterns of all possible sizes. Fr
Wolfe Waves are naturally occurring trading patterns present in all financial markets and represent a fight towards an equilibrium price. These patterns can develop over short and long-term time frames and are one of the most reliable predictive reversal patterns in existence, normally preceding strong and long price movements. [ Installation Guide | Update Guide | Troubleshooting | FAQ | All Products ] Clear trading signals Amazingly easy to trade Customizable colors and sizes Implements perfo
Volume by Price MT5
Brian Collard
5 (3)
The Volume by Price Indicator for MetaTrader 5 features Volume Profile and Market Profile TPO (Time Price Opportunity). Volume and TPO histogram bar and line charts. Volume Footprint charts. TPO letter and block marker collapsed and split structure charts. Session filtering and grouping. Static, dynamic and flexible range segmentation and compositing methods with relative and absolute visualizations. Graphical layering, positioning and styling options to suit the user's analytic and aesthetic n
Italo Volume Indicator MT5
Italo Santana Gomes
4.73 (15)
BUY INDICATOR AND GET EA FOR FREE AS A BONUS + SOME OTHER GIFTS! ITALO VOLUME INDICATOR  is the best volume indicator ever created, and why is that? The Indicator works on all time-frames and assets, indicator built after 7 years of experience on forex and many other markets. You know many volume indicators around the internet are not complete, does not help, and it's difficult to trade, but the Italo Volume Indicator is different , the Italo Volume Indicator shows the wave volume, when market
MetaForecast M5
Vahidreza Heidar Gholami
5 (2)
MetaForecast predice e visualizza il futuro di qualsiasi mercato basandosi sull'armonia dei dati dei prezzi. Sebbene il mercato non sia sempre prevedibile, se esiste un modello nei prezzi, MetaForecast può prevedere il futuro con la massima precisione possibile. Rispetto ad altri prodotti simili, MetaForecast può generare risultati più accurati analizzando le tendenze di mercato. Parametri di input Past size (Dimensione passata) Specifica il numero di barre che MetaForecast utilizza per creare
Altri dall’autore
An oscillator that shows price changes and identifies areas of overbought and oversold. It can also show trend reversal points. WaveTrend Oscillator is a port of a famous TS /MT indicator. When the oscillator is above the overbought band (red lines) and crosses down the signal (solid line), it is usually a good SELL signal. Similarly, when the oscillator crosses above the signal when below the Oversold band (green lines), it is a good BUY signal. Good luck.
Optimized Trend Tracker OTT is an indicator that provides traders to find an existing trend or in another words to ser which side of the current trend we are on. We are under the effect of the uptrend in cases where the prices are above OTT , under the influence of a downward trend, when prices are below OTT it is possible to say that we are. The first parameter in the OTT indicator set by the two parameters is the period/length. OTT will be much sensitive to trend movements if i
Filtro:
Nessuna recensione
Rispondi alla recensione