MP Impulse MACD for MT5
- Indicatori
- Pierre Ksachikian
- Versione: 1.0
- Attivazioni: 6
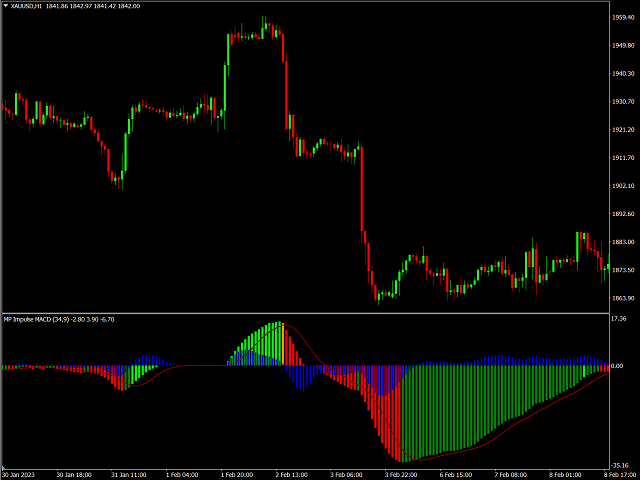
MACD (short for Moving Average Convergence/Divergence) is one of the most famous and oldest indicators ever created and is widely used among beginners. However, there is a newer version of the MACD that is named Impulse MACD which have less false signals than the standard MACD.
Classic MACD helps us to identify potential trends by displaying crossovers between two lines. If MACD line crosses above the Signal line it shows us that the market is potentially up trending and that it would be a good buying opportunity. And If MACD line crosses below the Signal line it shows us that the market is potentially down trending and that it would be a good selling opportunity. The common problem with this strategy is that it only woks on trending markets and as we all know, markets aren't always trending and can also move sideways or within a range. Because of that, the normal MACD indicator will performs terribly during this type of market.
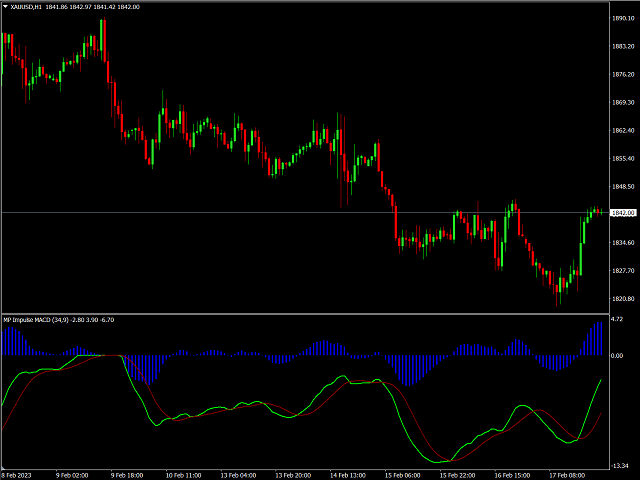
Similar to the classic MACD, the Impulse MACD is also a momentum indicator that could detect trends, however, it has its own unique feature which enables it to eliminate those false signals when the market is ranging , therefore, minimizing your loss. The difference is that unlike the normal MACD which displays multiple false signals when the market is ranging, the Impulse MACD filters out these false signals on a ranging market by going flat. So because of this unique feature you are now less likely to get trapped by these false signals.
How to use this indicator:
Similar to the classic MACD, the way to identify trends is by looking at the crossovers between the Impulse MACD line/histogram and the Signal line. If the Impulse MACD crosses above the Signal line, it indicates that the momentum is going upwards and if the Impulse MACD crosses below the Signal line, it indicates that the momentum is going downwards. However, if the two lines go flat, it indicates that the market is ranging or moving sideways and you should avoid taking any positions.
#Tags: Impulse MACD, MACD, Moving Average Convergence Divergence, Signal, Signal Line, Momentum Indicator, Momentum, Range Trading, Up trending, Down trending
___________________________________________________________________________________
Disclaimer:
Do NOT trade or invest based upon the analysis presented on this channel. Always do your own research and due diligence before investing or trading. I’ll never tell you what to do with your capital, trades or investments. I’ll also never recommend for you to buy, sell, long or short any asset, commodity, security, derivative or cryptocurrency related instrument as it's extremely HIGH RISK! You should always consult with a professional/licensed financial adviser before trading or investing in any type of assets.