Doteki Heikin Ashi for MT5
- Indicatori
- Fernando Carreiro
- Versione: 1.1
(Traduzione Google)
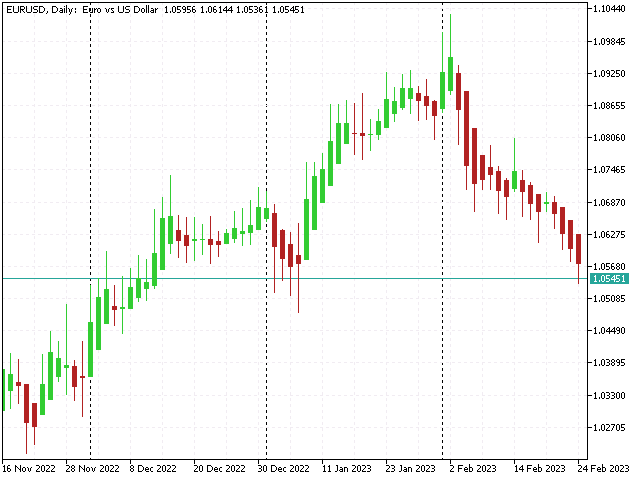
La rappresentazione standard della candela Heikin Ashi ha un valore aperto equivalente a un esponenziale Media mobile (EMA) del prezzo totale, di cui il valore alfa dell'EMA è fisso a 0,5 (equivalente a un periodo EMA di 3,0).
In questa versione dinamica, il punto può essere modificato in qualsiasi valore si desideri utilizzare, il che consente anche di farlo approssimare l'analisi multi-time frame o utilizzare il valore basso o alto come una sorta di trailing stop-loss. L'attraversamento di il prezzo di chiusura reale rispetto al valore di apertura di Heikin Ashi può essere utilizzato anche come segnale per un cambiamento in direzione del trend.
Inoltre, oltre all'EMA standard, questa versione ha anche la possibilità di utilizzare un EMA quasi zero-lag invece, che può rilevare i cambiamenti nella direzione del trend più rapidamente, soprattutto quando si utilizzano periodi più lunghi di media.
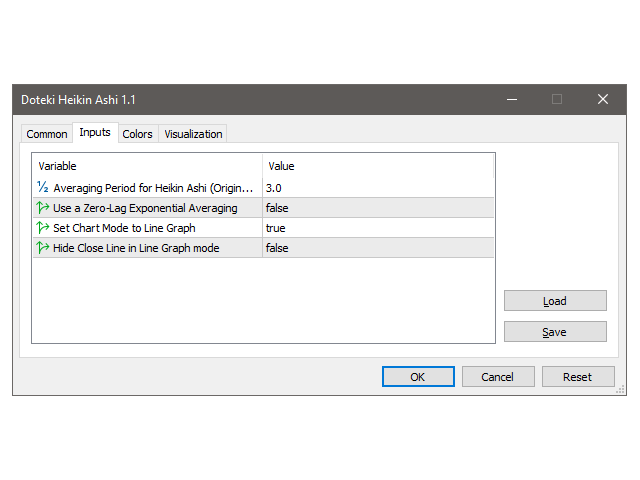
Quando alleghi l'indicatore al grafico, hai anche la possibilità di passare automaticamente dal grafico al grafico Modalità grafico a linee e facoltativamente nascondendo i prezzi di Chiusura reali dal grafico a linee, tuttavia, senza di esso, non sarai in grado di vedere i segnali di crossover tra i prezzi reali di Chiusura e il Heikin Ashi valori aperti.
(Original text)
The standard Heikin Ashi candle representation has an open value that is equivalent to an Exponential Moving Average (EMA) of the Total Price, of which the alpha value of the EMA is fixed at 0.5 (equivalent to an EMA period of 3.0).
In this dynamic version, the period can be changed to whatever value one wishes to use, which also allows one to approximate multi-time-frame analysis, or use the low or high value as a sort of trailing stop-loss. The crossing of the real Close price over the Heikin Ashi open value can also be used as a signal for a change in trend direction.
Also, besides the standard EMA, this version also has the option of using an Almost Zero-Lag EMA instead, which can detect changes in trend direction more quickly, especially when using longer periods of averaging.
When attaching the indicator to the chart, you also have the option of automatically switching the Chart into the Line Graph Mode and optionally hiding the real Close prices from the Line Graph, however, without it, you will not be able to see the cross-over signals between the real Close prices and the Heikin Ashi open values.


Banger Indicator king. Don't really like the EMA or whaterver is behind the candles. Is it possible to remove it?