• Panoramica
  • Recensioni
  • Commenti

Exponential Range Average Deviation Offset MT5

(Google Traduttore)

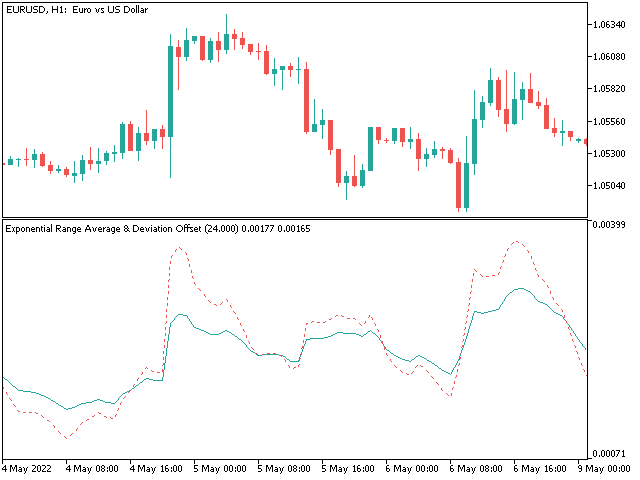
Questo indicatore è stato ispirato dall'Average True Range (ATR) di John Welles Wilder, ma con alcune informazioni extra. Allo stesso modo, calcola la media mobile esponenziale del true range, ma utilizzando il peso alfa standard invece di Wilder's. Calcola anche la deviazione media della media dell'intervallo e la visualizza come offset. Questo aiuta non solo a identificare più rapidamente un cambiamento, ma anche il suo impatto.

(Original text)

This indicator was inspired by John Welles Wilder's average true range (ATR), but with some extra information. Similarly, it calculates the exponential moving average of the true range, but using the standard alpha weight instead of Wilder's. It also calculates the average deviation of the range average, and displays it as an offset. This helps not only identify a change more quickly, but also its impact.

Prodotti consigliati
(Traduzione Google) La rappresentazione standard della candela Heikin Ashi ha un valore aperto equivalente a un esponenziale Media mobile (EMA) del prezzo totale , di cui il valore alfa dell' EMA è fisso a 0,5 (equivalente a un periodo EMA di 3,0). In questa versione dinamica, il punto può essere modificato in qualsiasi valore si desideri utilizzare, il che consente anche di farlo approssimare l'analisi multi-time frame o utilizzare il valore basso o alto come una sorta di trailing stop-loss. L'
FREE
Leave a comment if you would like me to write an EA to trade these trendlines... if enough interest, will write an EA. Automatic Trendlines, updated automatically. To Set up 3 different (or mroe) Trendlines on chart, simply load the indicator as many times and name it differntly.. the example in the picture below is indicator 1 (loaded 1st time): Name: Long, StartBar: 50, BarCount: 500, Color: Pink indicator 2 (loaded 2nd time): Name: Short, StartBar: 20, BarCount: 200, Color: Green indicator 3
FREE
Reversal Composite Candles
MetaQuotes Ltd.
3.43 (23)
The idea of the system is to indentify the reversal patterns using the calculation of the composite candle. The reversal patterns is similar to the "Hammer" and "Hanging Man" patterns in Japanese candlestick analysis. But it uses the composite candle instead the single candle and doesn't need the small body of the composite candle to confirm the reversal. Input parameters: Range - maximal number of bars, used in the calculation of the composite candle. Minimum - minimal size of the composite can
FREE
ATR Moving Average
David Gitau Gakunga
5 (3)
ATR Moving Average draws a moving average of the standard Average True Range( ATR ) in the same window. Settings Name Description ATR period Set Price per iod for ATR calculation ATR level Set ATR value for thresholding( only whole number, ignore leading zeros e.g. 0.00089 = 89 ) MA Period Set moving Average Period MA Method Set moving average method( Simple, Exponential, Smoothed and Linear Weighted ) MA Shift Set moving average shift Enable Alerts ? Generate Alert when ATR crosses
FREE
Donchian Pro
Paulo Henrique Faquineli Garcia
5 (2)
The Donchian Channel Channels are among the most popular tools of technical analysis, as they visually convey to the analyst the limits within which most price movement tends to occur. Channel users know that valuable information can be obtained at any time, whether prices are in the central region of a band or close to one of the border lines. One of the best known techniques to explore these concepts is Bollinger Bands. However, John Bollinger was not the only one to research the applicatio
FREE
Value Chart Candlesticks
Flavio Javier Jarabeck
4.67 (9)
The idea of a Value Chart indicator was presented in the very good book I read back in 2020 , " Dynamic Trading Indicators: Winning with Value Charts and Price Action Profile ", from the authors Mark Helweg and David Stendahl. The idea is simple and the result is pure genius: Present candlestick Price analysis in a detrended way! HOW TO READ THIS INDICATOR Look for Overbought and Oversold levels. Of course, you will need to test the settings a lot to find the "correct" one for your approach.
FREE
Follow The Line MT5
Oliver Gideon Amofa Appiah
4.4 (30)
This indicator obeys the popular maxim that: "THE TREND IS YOUR FRIEND" It paints a GREEN line for BUY and also paints a RED line for SELL. (you can change the colors). It gives alarms and alerts of all kinds. IT DOES NOT REPAINT and can be used for all currency pairs and timeframes. Yes, as easy and simple as that. Even a newbie can use it to make great and reliable trades. NB: For best results, get my other premium indicators for more powerful and reliable signals. Get them here: https://www.m
FREE
VolumeSpreadtompson
Vasilii Luchnikov
5 (1)
hello. The indicator shows the levels of change in the spread per unit of time when its values are higher. Practice shows that the change in volumes is associated with the warning and advance of speculative activity, especially at key moments: Fed news, oil news, speeches by leaders of the IDR countries.   We are very happy to present new developments. Thanks. 
FREE
Market Profile 3 ForexArby com
Hussien Abdeltwab Hussien Ryad
4.17 (12)
Market Profile 3 MetaTrader 5 indicator  version 4.70— is a classic Market Profile implementation that can show the price density over time, outlining the most important price levels, value area, and control value of a given trading session. This indicator can be attached to timeframes between M1 and D1 and will show the Market Profile for daily, weekly, monthly, or even intraday sessions. Lower timeframes offer higher precision. Higher timeframes are recommended for better visibility. It is als
FREE
PZ The Zone MT5
PZ TRADING SLU
5 (1)
This indicator displays buy or sell signals according to Bill Williams' definition of the Trading Zone. [ Installation Guide | Update Guide | Troubleshooting | FAQ | All Products ] Easy to use and understand Avoid trading flat markets Deterministic indicator with clear rules The indicator is non-repainting It implements alerts of all kinds It has straightforward trading implications. A blue arrow is a buy signal A red arrow is a sell signal According to Bill Williams trading in the zone helps t
FREE
Bar Color Trend
Germano Chagas
4.5 (10)
Combining the best of Price Action , Directional Movement , and Divergence/Convergence analysis, Candle Color Trend is a easy and reliable way to identify trend direction. The indicator automatically paints the candles according to the assumption that an uptrend is defined by prices that form a series of higher highs and higher lows. In contrast, a downtrend is defined by prices that form a series of lower highs and lower lows. Additionally, ADX Wilder indicator is used to measure trend weakness
FREE
Free automatic Fibonacci is an indicator that automatically plots a Fibonacci retracement based on the number of bars you select on the BarsToScan setting in the indicator. The Fibonacci is automatically updated in real time as new highest and lowest values appears amongst the selected bars. You can select which level values to be displayed in the indicator settings. You can also select the color of the levels thus enabling the trader to be able to attach the indicator several times with differe
FREE
Il Catturatore di Tendenza: La Strategia del Catturatore di Tendenza con Indicatore di Allarme è uno strumento versatile di analisi tecnica che aiuta i trader a identificare le tendenze di mercato e i potenziali punti di ingresso e uscita. Presenta una Strategia dinamica del Catturatore di Tendenza, adattandosi alle condizioni di mercato per una chiara rappresentazione visiva della direzione della tendenza. I trader possono personalizzare i parametri in base alle loro preferenze e tolleranza
FREE
Important Lines
Terence Gronowski
4.88 (26)
This indicator displays Pivot-Lines, preday high and low, preday close and the minimum and maximum of the previous hour. You just have to put this single indicator to the chart to have all these important lines, no need to setup many single indicators. Why certain lines are important Preday high and low : These are watched by traders who trade in a daily chart. Very often, if price climbs over or falls under a preday low/high there is an acceleration in buying/selling. It is a breakout out of
FREE
What is MACD? MACD is an acronym for Moving Average Convergence Divergence . This technical indicator is a tool that’s used to identify moving averages that are indicating a new trend, whether it’s bullish or bearish. There is a common misconception when it comes to the lines of the MACD. There are two lines: The " MACD Line " The " Signal Line " The two lines that are drawn are NOT moving averages of the price. The MACD Line is the difference (or distance) between two moving
FREE
Spike Catch Pro
Amani Fungo
4 (5)
Spike Catch Pro 22:03 release updates Advanced engine for searching trade entries in all Boom and Crash pairs (300,500 and 1000) Programmed strategies improvements Mx_Spikes (to combine Mxd,Mxc and Mxe), Tx_Spikes,   RegularSpikes,   Litho_System,   Dx_System,   Md_System,   MaCross,   Omx_Entry(OP),  Atx1_Spikes(OP),   Oxc_Retracement (AT),M_PullBack(AT) we have added an arrow on strategy identification, this will help also in the visual manual backtesting of the included strategies and see h
FREE
Weis Waves
Flavio Javier Jarabeck
3.15 (26)
The original author is David Weis, an expert in the Wyckoff Method. The Weis Wave is a modern adaptation of the 1930's Wyckoff Method, another expert in Tape Reading techniques and Chart Analysis. Weis Waves takes market volume and stacks it into waves according to price conditions giving the trader valuable insights about the market conditions. If you want to learn more about this subject you can find tons of videos in YouTube. Just look for "The Wickoff Method", "Weis Wave" and "Volume Spread
FREE
Are you tired of drawing trendlines every time you're analyzing charts? Or perhaps you would like more consistency in your technical analysis. Then this is for you. This indicator will draw trend lines automatically when dropped on a chart. How it works Works similar to standard deviation channel found on mt4 and mt5. It has 2 parameters: 1. Starting Bar 2. Number of bars for calculation The   starting bar   is the bar which drawing of the trend lines will begin, while the   number of bars for c
FREE
FRB Support and Resistance
Fernando Baratieri
5 (2)
FRB Trader - Our mission is to provide the best support to customers through conted and tools so that they can achieve the expected results FRB Support and Resistance - Indicator places lines on the chart to show Support and Resistance regions. - You can choose the timeframe you want to calculate, as well as the colors of the lines. - Algorithm calculates the points where the strengths of the asset are considered and are extremely important for decision making.
FREE
LT Donchian Channel
Thiago Duarte
4.75 (4)
Donchian Channel is an indicator created by Richard Donchian. It is formed by taking the highest high and the lowest low of the last specified period in candles. The area between high and low is the channel for the chosen period. Its configuration is simple. It is possible to have the average between the upper and lower lines, plus you have alerts when price hits one side. If you have any questions or find any bugs, please contact me. Enjoy!
FREE
This EA is named Dinosaur Hunter(DH) because it can capture very large trend, such as 5000-10000 pips. DH trades infrequently as it patiently waits for the right market conditions. DH can load multiple currency pairs on a single chart to increase the number of trades. Live Signal This is a demo version that only for fixed lot size of 0.01. To obtain the full version, please purchase Dinosaur Hunter Pro . This EA has been tested from 2015 to the present. The test used data from Dukascopy. If
FREE
Free version. Only works on EURUSD Do you want to always know in a quick glance where price is going? Are you tired of looking back and forth between different timeframes to understand that? This indicator might just be what you were looking for. Trend Signal Multitimeframe shows you if the current price is higher or lower than N. candles ago, on the various timeframes. It also displays how many pips higher or lower current price is compared to N. candles ago. Number N. is customizable The data
FREE
PZ Penta O MT5
PZ TRADING SLU
4 (6)
The Penta-O is a 6-point retracement harmonacci pattern which usually precedes big market movements. Penta-O patterns can expand and repaint quite a bit. To make things easier this indicator implements a twist: it waits for a donchian breakout in the right direction before signaling the trade. The end result is an otherwise repainting indicator with a very reliable trading signal. The donchian breakout period is entered as an input. [ Installation Guide | Update Guide | Troubleshooting | FAQ | A
FREE
CAP Channel Trading MT5
MEETALGO LLC
4.09 (58)
The   CAP Channel Trading   is a volatility-based indicator that makes use of the “advanced envelope theory”. These envelopes consist of two outer lines. Envelope theory states that the market price will generally fall between the boundaries of the envelope (or channel). If prices move outside the envelope, it is a trading signal or trading opportunity. Benefits of the Channel Trading Indicator CAP Channel Trading works with any asset It can be applied to any financial assets: forex, cryptoc
FREE
Automatic Trendlines
Pasi Hakamaki
4.65 (51)
The indicator draws trendlines on chart. This indicator has six inputs. User can specify alternative labels for both lines. If multiple instances of the indicator are used, the labels must differ. User can set width and color of the lines and depth which specifies what significant peaks should be used. For example, Depth=10 sets trendlines using the current peaks and valleys that have at least 10 bars to the right and to the left and that have highs/lows less/greater than the peak's high/low. In
FREE
WH Price Wave Pattern MT5
Wissam Hussein
3.82 (11)
Benvenuto nel nostro   modello di ondata di prezzo   MT5 --(modello ABCD)-- Il modello ABCD è un modello di trading potente e ampiamente utilizzato nel mondo dell'analisi tecnica. È un modello di prezzo armonico che i trader utilizzano per identificare potenziali opportunità di acquisto e vendita sul mercato. Con il modello ABCD, i trader possono anticipare potenziali movimenti di prezzo e prendere decisioni informate su quando entrare e uscire dalle negoziazioni. Versione EA:   Price Wave E
FREE
This indicator is a zero-lag indicator and displays  strength of trend change . True Trend  Oscillator Pro works best in combination with True Trend Moving Average Pro that displays exact trend as is. Oscillator value is exact price change in given direction of the trend. True Trend Moving Average Pro: https://www.mql5.com/en/market/product/103586 If you set PERIOD input parameter to 1 this indicator becomes a sharpshooter for binary options. Developers can use True Trend Oscillator in E
FREE
RSI Chart Levels
Nikolay Mitrofanov
5 (6)
The indicator draws levels based on the overbought and oversold values ​​of the RSI indicator. The maximum values ​​are taken into account, which are equal to or exceeded certain limits. That is, for example, when the price has gone into the overbought zone, the highest price is selected from all prices in this zone for this period of time, and as soon as the indicator value returns to a value below the overbought value, the level is fixed and the calculation of new values ​​begins. The sam
FREE
QuantumAlert RSI Navigator is a free indicator available for MT4/MT5 platforms, its work is to provide "alerts" when the market is inside "overbought and oversold" regions in the form of "buy or sell" signals. This indicator comes with many customization options mentioned in the parameter section below, user can customise these parameters as needful. Join our MQL5 group , where we share important news and updates. You are also welcome to join our private channel as well, contact me for the priva
FREE
O Afastamento da Média Móvel, é uma poderosa ferramenta de análise técnica projetada para fornecer uma representação visual do afastamento entre o preço atual e uma média móvel específica. Este indicador, desenvolvido para o MetaTrader, oferece aos traders uma perspectiva clara das mudanças na dinâmica de preço em relação à tendência de médio prazo. Versão MT4:  https://www.mql5.com/pt/market/product/111705
FREE
Gli utenti di questo prodotto hanno anche acquistato
Atomic Analyst MT5
Issam Kassas
5 (14)
Innanzitutto, vale la pena sottolineare che questo indicatore di trading non è repaint, non è ridisegno e non presenta ritardi, il che lo rende ideale sia per il trading manuale che per quello automatico. Manuale utente: impostazioni, input e strategia. L'Analista Atomico è un indicatore di azione del prezzo PA che utilizza la forza e il momentum del prezzo per trovare un miglior vantaggio sul mercato. Dotato di filtri avanzati che aiutano a rimuovere rumori e segnali falsi, e aumentare il pote
Innanzitutto è importante sottolineare che questo sistema di trading è un indicatore Non-Repainting, Non-Redrawing e Non-Lagging, il che lo rende ideale sia per il trading manuale che per quello automatico. Corso online, manuale e download di preset. Il "Sistema di Trading Smart Trend MT5" è una soluzione completa pensata sia per i trader principianti che per quelli esperti. Combina oltre 10 indicatori premium e offre più di 7 robuste strategie di trading, rendendolo una scelta versatile per div
Quantum Trend Sniper
Bogdan Ion Puscasu
5 (41)
Presentazione       Quantum Trend Sniper Indicator   , l'innovativo indicatore MQL5 che sta trasformando il modo in cui identifichi e scambi le inversioni di tendenza! Sviluppato da un team di trader esperti con un'esperienza di trading di oltre 13 anni,       Indicatore Quantum Trend Sniper       è progettato per spingere il tuo viaggio di trading verso nuove vette con il suo modo innovativo di identificare le inversioni di tendenza con una precisione estremamente elevata. *** Acquista Quant
Trend Screener Pro MT5
STE S.S.COMPANY
4.88 (64)
Indicatore di tendenza, soluzione unica rivoluzionaria per il trading di tendenze e il filtraggio con tutte le importanti funzionalità di tendenza integrate in un unico strumento! È un indicatore multi-timeframe e multi-valuta al 100% non ridipingibile che può essere utilizzato su tutti i simboli/strumenti: forex, materie prime, criptovalute, indici e azioni. Trend Screener è un indicatore di tendenza che segue un indicatore efficiente che fornisce segnali di tendenza a freccia con punti nel gra
Innanzitutto, vale la pena sottolineare che questo Strumento di Trading è un Indicatore Non-Ridipingente, Non-Ridisegnante e Non-Laggante, il che lo rende ideale per il trading professionale. Corso online, manuale utente e demo. L'Indicatore Smart Price Action Concepts è uno strumento molto potente sia per i nuovi che per i trader esperti. Racchiude più di 20 utili indicatori in uno solo, combinando idee di trading avanzate come l'Analisi del Trader del Circolo Interno e le Strategie di Trad
Reversal First Impulse levels (RFI)      INSTRUCTIONS        RUS       -       ENG              R ecommended to use with an indicator   -   TREND PRO -  Version MT4                 A key element in trading is zones or levels from which decisions to buy or sell a trading instrument are made. Despite attempts by major players to conceal their presence in the market, they inevitably leave traces. Our task was to learn how to identify these traces and interpret them correctly. Main functions:: Di
Gold Stuff mt5
Vasiliy Strukov
4.89 (175)
Gold Stuff mt5 è un indicatore di tendenza progettato specificamente per l'oro e può essere utilizzato anche su qualsiasi strumento finanziario. L'indicatore non ridisegna e non è in ritardo. Periodo consigliato H1. Contattami subito dopo l'acquisto per avere le impostazioni e un bonus personale!   I risultati in tempo reale possono essere visualizzati qui.  Puoi ottenere una copia gratuita del nostro indicatore Strong Support e Trend Scanner, per favore scrivi in ​​privato. M   IMPOSTAZION
FxaccurateLS
Shiv Raj Kumawat
WHY IS OUR FXACCCURATE LS MT5 THE PROFITABLE ? PROTECT YOUR CAPITAL WITH RISK MANAGEMENT Gives entry, stop and target levels from time to time. It finds Trading opportunities by analyzing what the price is doing during established trends. POWERFUL INDICATOR FOR A RELIABLE STRATEGIES We have made these indicators with a lot of years of hard work. It is made at a very advanced level. Established trends provide dozens of trading opportunities, but most trend indicators completely ignore them!
IVISTscalp5
Vadym Zhukovskyi
5 (4)
We present you the iVISTscalp5 indicator, which is not only unique, but also effective in the analysis of trading operations. This indicator is based on time data and is the result of many years of experience and deep analysis of financial markets. The iVISTscalp5 indicator is an excellent assistant for manual trading. Convenience, simplicity and visualization. All the most difficult is hidden inside. We have simplified the settings and use of the iVISTscalp5 indicator as much as possible. The i
Quantum Heiken Ashi PRO MT5
Bogdan Ion Puscasu
4.5 (8)
Ti presentiamo   Quantum Heiken Ashi PRO Progettate per fornire informazioni chiare sulle tendenze del mercato, le candele Heiken Ashi sono rinomate per la loro capacità di filtrare il rumore ed eliminare i falsi segnali. Dì addio alle confuse fluttuazioni dei prezzi e dai il benvenuto a una rappresentazione grafica più fluida e affidabile. Ciò che rende il Quantum Heiken Ashi PRO davvero unico è la sua formula innovativa, che trasforma i dati tradizionali delle candele in barre colorate di faci
ICT, SMC, SMART MONEY CONCEPTS, SMART MONEY, Smart Money Concept, Support and Resistance, Trend Analysis, Price Action, Market Structure, Order Blocks, BOS/CHoCH,   Breaker Blocks ,  Momentum Shift,   Supply&Demand Zone/Order Blocks , Strong Imbalance,   HH/LL/HL/LH,    Fair Value Gap, FVG,  Premium  &   Discount   Zones, Fibonacci Retracement, OTE, Buy Side Liquidity, Sell Side Liquidity, BSL/SSL Taken, Equal Highs & Lows, MTF Dashboard, Multiple Time Frame, BigBar, HTF OB, HTF Market Structure
FX Volume MT5
Daniel Stein
4.94 (17)
Ricevi il tuo aggiornamento quotidiano sul mercato con dettagli e schermate tramite il nostro Morning Briefing qui su mql5 e su Telegram ! FX Volume è il PRIMO e UNICO indicatore di volume che fornisce una visione REALE del sentiment del mercato dal punto di vista del broker. Fornisce informazioni straordinarie su come gli operatori di mercato istituzionali, come i broker, sono posizionati sul mercato Forex, molto più velocemente dei rapporti COT. Vedere queste informazioni direttamente sul vo
Il profitto dalla struttura del mercato cambia quando il prezzo si inverte e si ritira. L'indicatore di avviso di inversione della struttura del mercato identifica quando una tendenza o un movimento di prezzo si sta avvicinando all'esaurimento e pronto a invertire. Ti avvisa dei cambiamenti nella struttura del mercato che in genere si verificano quando stanno per verificarsi un'inversione o un forte pullback. L'indicatore identifica inizialmente i breakout e lo slancio del prezzo, ogni volta
Volume by Price MT5
Brian Collard
5 (4)
The Volume by Price Indicator for MetaTrader 5 features Volume Profile and Market Profile TPO (Time Price Opportunity). Volume and TPO histogram bar and line charts. Volume Footprint charts. TPO letter and block marker collapsed and split structure charts. Session filtering and grouping. Static, dynamic and flexible range segmentation and compositing methods with relative and absolute visualizations. Graphical layering, positioning and styling options to suit the user's analytic and aesthetic n
TPSproTREND PrO MT5
Roman Podpora
4.86 (7)
TPSpro TRENDPRO  - is a trend indicator that automatically analyzes the market and provides information about the trend and each of its changes, as well as giving signals for entering trades without redrawing! The indicator uses each candle, analyzing them separately. referring to different impulses - up or down impulse. Exact entry points into transactions for currencies, crypto, metals, stocks, indices!  -  Version MT4               DETAILED DESCRIPTION               R ecommended to use with
Introducing the Power Trade Plus indicator designed by a small group of traders with a few years of experience trading the market profitably.  The Power Trade Plus is derived from the Power Trade indicator,  the indicator strive in powerful sniper entries and take profit levels,  with an algorithm that's can determine the markets volatility and Provides entries based on the current market volatility. This indicator is much more effective in stock ,currencies and indices.
AW Trend Predictor MT5
AW Trading Software Limited
4.78 (58)
La combinazione di trend e livelli di rottura in un unico sistema. Un algoritmo di indicatore avanzato filtra il rumore del mercato, determina la tendenza, i punti di ingresso e i possibili livelli di uscita. I segnali indicatori sono registrati in un modulo statistico, che permette di selezionare gli strumenti più adatti, mostrando l'efficacia dello storico dei segnali. L'indicatore calcola i segni Take Profit e Stop Loss. Manuale e istruzioni ->   QUI   / versione MT4 ->   QUI Come fare tradi
Presentazione       Quantum Breakout PRO   , l'innovativo indicatore MQL5 che sta trasformando il modo in cui scambi le zone di breakout! Sviluppato da un team di trader esperti con un'esperienza di trading di oltre 13 anni,       Quantum Breakout PRO       è progettato per spingere il tuo viaggio di trading a nuovi livelli con la sua strategia innovativa e dinamica della zona di breakout. Quantum Breakout Indicator ti fornirà frecce di segnalazione sulle zone di breakout con 5 zone target
RelicusRoad Pro MT5
Relicus LLC
4.83 (23)
Ora $ 147 (aumentando a $ 499 dopo alcuni aggiornamenti) - account illimitati (PC o MAC) Manuale utente di RelicusRoad + Video di formazione + Accesso al gruppo Discord privato + Stato VIP UN NUOVO MODO DI GUARDARE IL MERCATO RelicusRoad è l'indicatore di trading più potente al mondo per forex, futures, criptovalute, azioni e indici, fornendo ai trader tutte le informazioni e gli strumenti di cui hanno bisogno per rimanere redditizi. Forniamo analisi tecniche e piani di trading per aiutar
Advanced Supply Demand MT5
Bernhard Schweigert
4.53 (15)
La migliore soluzione per qualsiasi principiante o trader esperto! Questo indicatore è uno strumento di trading unico, di alta qualità e conveniente perché abbiamo incorporato una serie di funzionalità proprietarie e una nuova formula. Con questo aggiornamento, sarai in grado di mostrare fusi orari doppi. Non solo potrai mostrare una TF più alta, ma anche entrambe, la TF del grafico, PIÙ la TF più alta: SHOWING NESTED ZONES. Tutti i trader di domanda di offerta lo adoreranno. :) Informazioni imp
TPA True Price Action indicator reveals the true price action of the market makers through 100% non-repainting signals strictly at the close of a candle! TPA shows entries and re-entries, every time the bulls are definitely stronger than the bears and vice versa. Not to confuse with red/green candles. The shift of power gets confirmed at the earliest stage and is ONE exit strategy of several. There are available now two free parts of the TPA User Guide for our customers. The first "The Basics"
Royal Scalping Indicator M5
Vahidreza Heidar Gholami
5 (8)
Royal Scalping Indicator is an advanced price adaptive indicator designed to generate high-quality trading signals. Built-in multi-timeframe and multi-currency capabilities make it even more powerful to have configurations based on different symbols and timeframes. This indicator is perfect for scalp trades as well as swing trades. Royal Scalping is not just an indicator, but a trading strategy itself. Features Price Adaptive Trend Detector Algorithm Multi-Timeframe and Multi-Currency Trend Low
Trend Line Map Pro MT5
STE S.S.COMPANY
4.67 (9)
Trend Line Map indicator is an addons for   Trend Screener Indicator . It's working as a scanner for all signals generated by Trend screener ( Trend Line Signals ) . It's a Trend Line Scanner based on Trend Screener Indicator.  If you don't have Trend Screener Pro Indicator,   the Trend Line Map Pro will not work.     LIMITED TIME OFFER : Trend Line Map Indicator is available for only 50 $ and lifetime. ( Original price 125$ ) By accessing to our MQL5 Blog,  you can find all our premium indica
Italo Trend Indicator MT5
Italo Santana Gomes
4.89 (9)
BUY INDICATOR AND GET EA FOR FREE AS A BONUS + SOME OTHER GIFTS! ITALO TREND INDICATOR  is the best trend indicator on the market, the Indicator works on all time-frames and assets, indicator built after 7 years of experience on forex and many other markets. You know many trend indicators around the internet are not complete, does not help, and it's difficult to trade, but the Italo Trend Indicator is different , the Italo Trend Indicator shows the signal to buy or sell, to confirm the signal t
Matrix Arrow Indicator MT5
Juvenille Emperor Limited
5 (14)
Matrix Arrow Indicator MT5   è un trend unico 10 in 1 che segue un indicatore multi-timeframe al   100% non ridipinto   che può essere utilizzato su tutti i simboli/strumenti:   forex ,   materie prime ,   criptovalute ,   indici ,   azioni .  Matrix Arrow Indicator MT5  determinerà la tendenza attuale nelle sue fasi iniziali, raccogliendo informazioni e dati da un massimo di 10 indicatori standard, che sono: Indice di movimento direzionale medio (ADX) Indice del canale delle materie prime (CCI
L'indicatore di inversione ADR ti mostra a colpo d'occhio dove il prezzo è attualmente scambiato in relazione al suo normale intervallo medio giornaliero. Riceverai avvisi istantanei tramite pop-up, e-mail o push quando il prezzo supera la sua gamma media e livelli superiori a tua scelta in modo da poter saltare rapidamente a pullback e inversioni. L'indicatore disegna linee orizzontali sul grafico agli estremi dell'intervallo medio giornaliero e anche estensioni al di sopra di quei livelli a c
Black Dragon indicator mt5
Ramil Minniakhmetov
4.83 (58)
L'indicatore di rilevamento delle tendenze integrerà qualsiasi strategia e può anche essere utilizzato come strumento indipendente. IMPORTANTE! Contattami subito dopo l'acquisto per ricevere istruzioni e un bonus!  Vantaggi Facile da usare, non sovraccarica il grafico con informazioni non necessarie; Possibilità di utilizzo come filtro per qualsiasi strategia; Ha livelli integrati di supporto e resistenza dinamici, che possono essere utilizzati sia per la presa di profitto che per imposta
Auto Order Block with break of structure based on ICT and Smart Money Concepts (SMC) Futures Break of Structure ( BoS )             Order block ( OB )            Higher time frame Order block / Point of Interest ( POI )    shown on current chart           Fair value Gap ( FVG ) / Imbalance   -  MTF      ( Multi Time Frame )    HH/LL/HL/LH  -  MTF      ( Multi Time Frame )  Choch  MTF      ( Multi Time Frame )  Volume Imbalance     ,  MTF          vIMB Gap’s Power of 3  ( PO3) Equ
Bill Williams Advanced
Siarhei Vashchylka
5 (5)
Bill Williams Advanced is designed for automatic chart analysis using Bill Williams' "Profitunity" system. The indicator analyzes four timeframes at once. Manual (Be sure to read before purchasing) Advantages 1. Automatically analyzes the chart using the "Profitunity" system of Bill Williams. The found signals are placed in a table in the corner of the screen. 2. Equipped with a trend filter based on the Alligator indicator. Most of the system signals are recommended to be used only accordi
Owl Smart Levels MT5
Sergey Ermolov
4.43 (37)
Versione MT4  |  FAQ L' indicatore Owl Smart Levels è un sistema di trading completo all'interno dell'unico indicatore che include strumenti di analisi di mercato popolari come i frattali avanzati di Bill Williams , Valable ZigZag che costruisce la corretta struttura a onde del mercato, e i livelli di Fibonacci che segnano i livelli esatti di entrata nel mercato e luoghi per prendere profitti. Descrizione dettagliata della strategia Istruzioni per lavorare con l'indicatore Consulente-assistente
Altri dall’autore
(Traduzione Google) La rappresentazione standard della candela Heikin Ashi ha un valore aperto equivalente a un esponenziale Media mobile (EMA) del prezzo totale , di cui il valore alfa dell' EMA è fisso a 0,5 (equivalente a un periodo EMA di 3,0). In questa versione dinamica, il punto può essere modificato in qualsiasi valore si desideri utilizzare, il che consente anche di farlo approssimare l'analisi multi-time frame o utilizzare il valore basso o alto come una sorta di trailing stop-loss. L'
FREE
(traduzione Google) Questo indicatore si basa sul " Time Segmented Volume (TSV)" originale sviluppato da Worden Brothers, Inc . Tuttavia, ho aggiunto alcune funzionalità in più a questo. Si può scegliere il prezzo da applicare, invece di avere solo il prezzo di chiusura predefinito utilizzato dall'originale. Si può anche scegliere quale ponderazione del volume utilizzare, incluso uno pseudo-volume basato sull'intervallo reale o nessuna ponderazione del volume. (Original text) This indicator is b
FREE
(traduzione Google) Questo indicatore implementa l'originale " Average True Range (ATR) " sviluppato da John Welles Wilder Jr. , come descritto nel suo libro— Nuovi concetti nei sistemi tecnici di trading [1978] . Utilizza la media mobile di Wilder , nota anche come media mobile smussata (SMMA) , invece di una media mobile semplice (SMA) come utilizzato sull'indicatore ATR integrato di MetaTrader . Il periodo predefinito applicato è 7, invece di 14, come da descrizione nel suo libro. (Original t
FREE
(Google Traduttore) Questo indicatore è stato ispirato dall' Average True Range (ATR) di John Welles Wilder , ma con alcune informazioni extra. Allo stesso modo, calcola la media mobile esponenziale del true range, ma utilizzando il peso alfa standard invece di Wilder's . Calcola anche la deviazione media della media dell'intervallo e la visualizza come offset. Questo aiuta non solo a identificare più rapidamente un cambiamento, ma anche il suo impatto. (Original text) This indicator was inspire
FREE
(Traduzione automatica) La maggior parte dei trader conosce il famoso indicatore giapponese Heikin-Ashi , creato nel 1700 da Munehisa Homma . A volte viene scritto Heiken-Ashi , ma il suo significato rimane lo stesso, ovvero “barra media” in giapponese. Questa è un'implementazione del noto indicatore Heikin Ashi , ma con alcune funzionalità aggiunte. Per prima cosa, consente che i suoi valori siano ponderati in base al volume , sia esso il volume del conteggio dei tick , il volume reale o lo pse
(Traduzione Google) Questo indicatore si basa sullo ZigZag originale fornito come esempio di codice sorgente con le installazioni di MetaTrader . L'ho riscritto con alcune funzionalità extra per la visualizzazione del canale di "profondità" e dei rispettivi breakout. Consente inoltre di osservare i precedenti punti a zig-zag. Facoltativamente, può avvisare l'utente quando si verificano dei breakout. Gli avvisi possono essere semplicemente sul terminale o anche tramite notifiche push su un dispos
Filtro:
Nessuna recensione
Rispondi alla recensione