• Panoramica
  • Recensioni
  • Commenti

UR Bands MT5

Bande UR
(con una formula utilizzata nei sistemi di Machine Learning)

UR Bands è un indicatore derivato attraverso una formula che incorpora la volatilità del mercato è simile in linea di principio a quelli utilizzati nei sistemi di apprendimento automatico. Questa rappresentazione matematica delle condizioni di mercato offre un'analisi precisa delle tendenze e delle dinamiche dei prezzi, tenendo conto della volatilità intrinseca dei mercati finanziari. Incorporando la volatilità come variabile, l'indicatore fornisce una rappresentazione più accurata e affidabile delle condizioni di mercato, consentendo a trader e investitori di prendere decisioni informate e gestire il rischio in modo efficace. Inoltre, l'uso di una formula basata sulla volatilità rende l'indicatore altamente reattivo ai cambiamenti del mercato, fornendo segnali precoci per potenziali operazioni o investimenti.

Vantaggi dell'utilizzo delle bande UR:

Bande sulle carte visivamente piacevoli e di facile comprensione
Adattato ad ogni tipo di risorsa e periodo di tempo
Bande che mostrano sempre i massimi e i minimi delle tendenze
Grande aggiunta e indicatore autonomo per i sistemi di trading di tendenza o inversione
C'è una speciale chat di Telegram su cui puoi rimanere aggiornato sugli aggiornamenti degli strumenti e anche inviare richieste se ritieni che manchi qualcosa!


Perché le bande UR?


Precisione migliorata: l'incorporazione della volatilità del mercato nella formula dell'indicatore si traduce in un'analisi più precisa delle condizioni di mercato.
Migliore valutazione del rischio: tenendo conto della volatilità, l'indicatore può aiutare i trader e gli investitori a valutare il rischio di mercato in modo più accurato.
Segnali precoci: l'uso di una formula basata sulla volatilità rende l'indicatore altamente reattivo ai cambiamenti del mercato, fornendo segnali precoci per potenziali operazioni o investimenti.
Decisioni basate sui dati: l'indicatore fornisce una rappresentazione più affidabile delle condizioni di mercato, consentendo a trader e investitori di prendere decisioni basate sui dati.
Rilevanza nei mercati dinamici: l'indicatore basato sulla volatilità è progettato per gestire la natura dinamica dei mercati finanziari, fornendo un'analisi più pertinente.

Come usare le bande UR?

UR Bands mostra un esaurimento multilivello per il prezzo. Puoi:

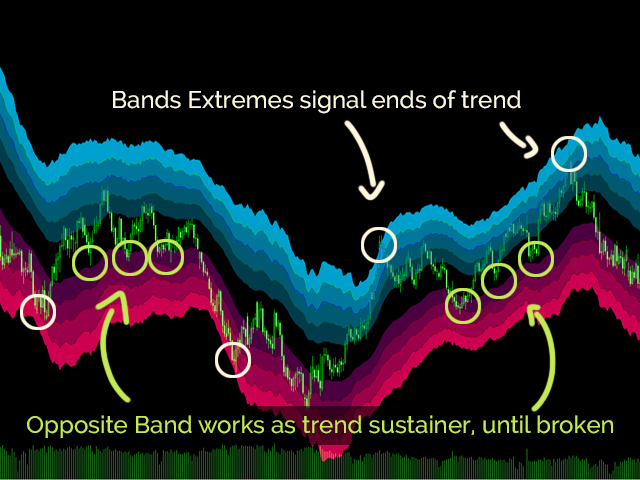
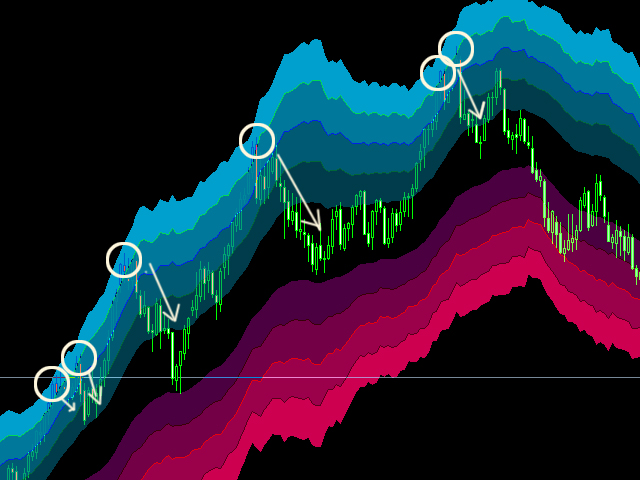
Individua gli esaurimenti estremi e il contro-scambio (trading di inversione) - fondamentalmente quando il prezzo raggiunge il bordo esterno della banda.
Individua gli inizi dei trend, quando vedi il prezzo rimbalzare su una banda o mostrare segni di inversione con minimi più alti / massimi più bassi.
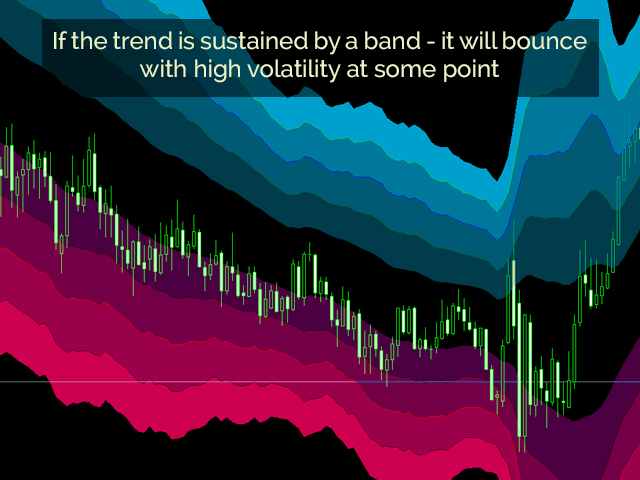
Individua la continuazione del trend in trend forti quando il prezzo rimbalza sulla banda opposta


SCHERMO

Bande a due facce: Mostra i livelli di esaurimento del trend - gli estremi sono l'esaurimento assoluto.
Prodotti consigliati
The best time to trade Using this Indicator is when the time reach exactly hour,half,45 minutes,15 minutes and sometimes 5 minutes.. This indicators is helpful to those who trade boom and crash indecies.How to read this indicator first you'll see Blue allow and Red allow all these allows used to indicate or to detect the spike which will happen so the allow happens soon before the spike happen.This indicator works properly only in boom and crash trading thing which you have to consider when
Easy GOLD MT5
Franck Martin
4.92 (12)
Easy Gold is the latest addition to the BotGPT family. It is surprising and very powerful. It is ideal for beginners due to its simplicity.  There is absolutely nothing to do, it's 100% automated, simply indicate the percentage of risk you want to take per trade and the EA is ready. Whatever your capital, the EA takes care of everything. Optimized on (XAUUSD).  Unleash all the power with the professional version (AGI Gold) and its connection to the neural network, available in my store. My othe
FREE
Perfect Sniper
Ignacio Agustin Mene Franco
Perfect Sniper! is a triple indicator with support resistance detection, downtrend channel, uptrend channel Bands included! where he hunts the rebounds in the red lines for sale, in the green lines mark purchase, in the lower bands that are the breaks gives another second entry either buy or sell, perfect to take advantage of the double entrance, It is used in any temporality, It is used to scalp and long on h1 or h4 to D1. It works for Forex markets, All pairs. It is used for the synthetic inde
The new update makes this indicator a complete tool for studying, analyzing and operating probabilistic patterns. It includes: On-chart Multi-asset percentage monitor. Configurable martingales. Twenty-one pre-configured patterns, including Mhi patterns and C3. An advanced pattern editor to store up to 5 custom patterns. Backtest mode to test results with loss reports. Trend filter. Hit operational filter. Martingale Cycles option. Various types of strategies and alerts. Confluence between patter
40% off. Original price: $50 (Ends in May 15th) ATR Scanner Pro is a multi symbol multi timeframe volatility scanner that monitors and analyzes Average True Range indicator value in up to 28 symbols and 9 timeframes   in 3 modes : ATR value:   As a volatility dashboard it shows the ATR indicator value in all pairs and timeframes and signals when the ATR value reaches a maximum or minimum in a given duration. Short term ATR/Long term ATR ratio:  It shows ratio of 2 ATRs with different periods. I
Il Catturatore di Tendenza: La Strategia del Catturatore di Tendenza con Indicatore di Allarme è uno strumento versatile di analisi tecnica che aiuta i trader a identificare le tendenze di mercato e i potenziali punti di ingresso e uscita. Presenta una Strategia dinamica del Catturatore di Tendenza, adattandosi alle condizioni di mercato per una chiara rappresentazione visiva della direzione della tendenza. I trader possono personalizzare i parametri in base alle loro preferenze e tolleranza
FREE
NagaRecoil
Haruki Teranaka
5 (1)
EA "NagaRecoil": soluzione di trading altamente durevole e altamente resiliente per accumulare risultati a lungo termine Il tanto atteso "NagaRecoil" di EA è finalmente stato rilasciato! Questo EA utilizza due indicatori ad alte prestazioni, RSI e RFTL, per catturare abilmente le fluttuazioni delle tendenze del mercato e determinare il punto di ingresso ottimale. L'RSI rileva sensibilmente il surriscaldamento del mercato e RFTL prevede i futuri movimenti dei prezzi. Questa combinazione fornis
FREE
Follow The Line MT5
Oliver Gideon Amofa Appiah
4.4 (30)
This indicator obeys the popular maxim that: "THE TREND IS YOUR FRIEND" It paints a GREEN line for BUY and also paints a RED line for SELL. (you can change the colors). It gives alarms and alerts of all kinds. IT DOES NOT REPAINT and can be used for all currency pairs and timeframes. Yes, as easy and simple as that. Even a newbie can use it to make great and reliable trades. NB: For best results, get my other premium indicators for more powerful and reliable signals. Get them here: https://www.m
FREE
Best SAR MT5
Ashkan Hazegh Nikrou
5 (1)
Descrizione:  siamo felici di presentare il nostro nuovo indicatore gratuito basato su uno degli indicatori professionali e popolari nel mercato forex (PSAR) questo indicatore è una nuova modifica sull'indicatore SAR parabolico originale, nell'indicatore pro SAR puoi vedere l'incrocio tra i punti e il grafico dei prezzi, questo il crossover non è un segnale ma parla del potenziale di fine movimento, puoi iniziare a comprare con un nuovo punto blu e posizionare lo stop loss un atr prima del pr
FREE
Quarter EMA
Jithin Sajan Sajan
5 (1)
Kindly rate and comment about the product for upgradation & Support The 5 EMA is plotted in green color ( Lime ). The 14 EMA is plotted in red color ( Red ). The 20 EMA is plotted in blue color ( Blue ). The 200 EMA is plotted in yellow color ( Yellow ). The Quarter EMA that provided calculates and plots four Exponential Moving Averages (EMAs) on the chart using different periods: 5, 14, 20, and 200. Each EMA is represented by a different color on the chart. Here's a description of each
FREE
Quintet EMA
Jithin Sajan Sajan
Kindly rate and comment about the product for upgradation & Support The   5 EMA   is plotted in   green   color ( Lime ). The  14 EMA  is plotted in  red  color ( Red ). The   20 EMA   is plotted in   blue   color ( Blue ). The  200 EMA  is plotted in  black  color ( Black ). The   200 EMA   is plotted in   yellow   color ( Yellow ). The Quarter EMA that provided calculates and plots four Exponential Moving Averages (EMAs) on the chart using different periods: 5, 14, 20, and 200. Each EMA
FREE
GIVE A LOOK TO MY OTHER PRODUCTS ! 100 % PER MONTH PROFIT---- MY NEW SIGNAL HERE ------->   https://www.mql5.com/en/signals/2162238?source=Site+Signals+My# BROKEN TRENDLINE ALERT IS A SIMPLE TOOL INDICATOR. JUST DRAW IN YOUR CHART A DYNAMIC OR STATIC TRENDLINE,AND THE INDICATOR WILL SEND YOU ALERT WHENEVER THE PRICE CROSSES BELOW OR ABOVE YOUR DRAWN TRENDLINE. IT WORKS IN ANY TIMEFRAME AND ANY CHART YOU WANT.JUST GOT A VPS AND DON'T STRESS IN FRONT OF YOUR COMPUTER. FOR ANY KIND OF QUESTION
WAPV Weis Wave Chart Forex
Eduardo Da Costa Custodio Santos
Il Weis Wave Chart Forex per MT5 è un indicatore di prezzo e volume. La lettura del prezzo e del volume è stata ampiamente diffusa tramite Richard Demille Wyckoff sulla base delle tre leggi da lui create: offerta e domanda, causa ed effetto e sforzo contro risultato. Già nel 1900 R.Wyckoff utilizzava la carta delle onde nelle sue analisi. Molti anni dopo, intorno al 1990, David Weis ha automatizzato il diagramma delle onde di R. Wyckoff e oggi vi portiamo l'evoluzione del diagramma delle onde di
Wolfe Wave Scanner MT5
Reza Aghajanpour
5 (3)
**  All Symbols  x  All Timeframes  scan just by pressing scanner button ** *** Contact me after the purchase to send you instructions and add you in "Wolfe Wave Scanner group" for sharing or seeing experiences with other users. Introduction: A Wolfe Wave is created with five-wave patterns in price. It shows supply and demand and a fight towards a balance price. T hese waves of price actions can help traders identify the boundaries of   the trend . Also  It helps forecast how the price will mo
PZ Trend Trading MT5
PZ TRADING SLU
3.67 (3)
Trend Trading is an indicator designed to profit as much as possible from trends taking place in the market, by timing pullbacks and breakouts. It finds trading opportunities by analyzing what the price is doing during established trends. [ Installation Guide | Update Guide | Troubleshooting | FAQ | All Products ] Trade financial markets with confidence and efficiency Profit from established trends without getting whipsawed Recognize profitable pullbacks, breakouts and early reversals The ind
KT Renko Patterns MT5
KEENBASE SOFTWARE SOLUTIONS
KT Renko Patterns scans the Renko chart brick by brick to find some famous chart patterns that are frequently used by traders across the various financial markets. Compared to the time-based charts, patterns based trading is easier and more evident on Renko charts due to their uncluttered appearance. KT Renko Patterns features multiple Renko patterns, and many of these patterns are extensively explained in the book titled Profitable Trading with Renko Charts by Prashant Shah. A 100% automate
Questo indicatore ti mostrerà i valori TP e SL (in quella valuta) che hai già impostato per ogni ordine sui grafici (chiuso alla riga della transazione/ordine) che ti aiuteranno molto a stimare il tuo profitto e la tua perdita per ogni ordine. E ti mostra anche i valori PIP. il formato mostrato è "Valori valutari dei nostri profitti o perdite / valori PIP". Il valore TP sarà mostrato in colore verde e il valore SL sarà mostrato in colore rosso. Per qualsiasi domanda o ulteriori informazioni,
HMA Trend Professional MT5
Pavel Zamoshnikov
4.4 (5)
Improved version of the free HMA Trend indicator (for MetaTrader 4) with statistical analysis. HMA Trend is a trend indicator based on the Hull Moving Average (HMA) with two periods. HMA with a slow period identifies the trend, while HMA with a fast period determines the short-term movements and signals in the trend direction. The main differences from the free version: Ability to predict the probability of a trend reversal using analysis of history data. Plotting statistical charts for analyz
Xtrade Trend Detector
Dago Elkana Samuel Dadie
Xtrade Trend Detector is an indicator capable of finding the best opportunities to take a position in any stock market. Indeed, it is a great tool for scalpers but also for Daytraders. You could therefore use it to identify areas to trade, it fits easily on a chart. I use it to detect trends on Big timeframes and take positions on Small timeframes. Don't hesitate to give me a feedback if you test it.
CryptoEA
Dragan Drenjanin
CryptoEA. Sticking to the same vibe, but this bot's got a bit of a twist in its crypto money management system. This is some brand-new stuff, and, only this bot's got this feature integrated. Anyways, the bot's rockin' a slick, minimalist design, but it's packing all the top-notch features – works with all order types, flips positions, makes decisions on the fly, goes for the buy or the sell, and all exit rules are calculated base on six independent ATR indicators. This robot's geared up to trad
Free automatic Fibonacci is an indicator that automatically plots a Fibonacci retracement based on the number of bars you select on the BarsToScan setting in the indicator. The Fibonacci is automatically updated in real time as new highest and lowest values appears amongst the selected bars. You can select which level values to be displayed in the indicator settings. You can also select the color of the levels thus enabling the trader to be able to attach the indicator several times with differe
FREE
Long Waiting
Aleksandr Davydov
5 (1)
Expert description Algorithm optimized for Nasdaq trading The Expert Advisor is based on the constant maintenance of long positions with daily profit taking, if there is any, and temporary interruption of work during the implementation of prolonged corrections The Expert Advisor's trading principle is based on the historical volatility of the traded asset. The values of the Correction Size (InpMaxMinusForMarginCallShort) and Maximum Fall (InpMaxMinusForMarginCallLong) are set manually. Reco
FREE
Franken
Aleksei Grebenkin
Multifunctional universal trading system . Suitable for all Forex and Crypto markets. ---- Franken.ex5 is additional executable used for trading with TS_DayTrader system. See the GUI version Frankenstein.ex5 and fast Frank.ex5 engine for optimization. You will find more info on the system in the descriptions there. Franken is built with features from both Frankenstein.ex5 and Frank.ex5: it is almost as fast as Frank(many features stripped off) but has the controls and statistics
Orders SL and TP Values Show
Nelson Queiros De Almeida
Orders SL and TP Values Show is an indicator that shows the values of Profit and Loss over the lines in the main chart. In addition, the distance in points will be shown. In the current version, the code has been remodeled and improved, now offering new options and features such as: Option to include swape values to more precise calculation of your order StopLoss and Takeprofit values. (Activated by default) Option to include the ticket number on the left of price value. This is useful to identi
Prop Firm Edge mt5
Vasiliy Strukov
4.95 (19)
Il consulente mt5 di Prop Firm Edge è progettato specificamente per superare le sfide di Prop Firm e ulteriori scambi. Sarà in grado di aderire a tutte le regole mantenendo il prelievo specificato entro i limiti prescritti e potrà anche essere utilizzato su qualsiasi conto per il trading giornaliero. Il consulente utilizza l'elevata volatilità dopo i comunicati stampa per entrare in una posizione. Il consulente utilizza l'output delle notizie per il trading e pertanto non può essere testato nel
Exclusive FOREX account HEDGE FuzzyLogicTrendEA is based on fuzzy logic strategy based on  analysis 5 indicators and filters. When the EA analysis all this indicators, it decides, based on its fuzzy strategy, which trade will be better: sell or buy. As additional functions, it´s possible defines spread maximum, stop loss and others. Recomm. Symbol: EURUSD, AUDUSD, GBPUSD, NZDUSD, USDCAD, AUDCAD, EURCAD e USDJPY Recomm. timeframe: H1. Backtest were done on EURUSD, H1, 01/07/2023 - 26/0
Questo cruscotto scopre e visualizza le zone di   domanda   e   offerta   sul grafico, sia in modalità scalping che a lungo termine, a seconda della vostra strategia di trading per i simboli selezionati. Inoltre, la modalità scanner del cruscotto vi aiuta a controllare tutti i simboli desiderati in un colpo d'occhio e a non perdere nessuna posizione adatta /   versione MT4 Indicatore gratuito:   Basic Supply Demand Caratteristiche Consente di visualizzare le opportunità di trading su pi
Noize Absorption Index - is the manual trading system that measures the difference of pressure between bears forces and bulls forces. Green line - is a noize free index that showing curent situation. Zero value of index shows totally choppy/flat market.Values above zero level shows how powerfull bullish wave is and values below zero measures bearish forces.Up arrow appears on bearish market when it's ready to reverse, dn arrow appears on weak bullish market, as a result of reverse expectation.
Harmonic Hybrid
Clemence Benjamin
Volume and RSI-based sniper entry signals for Boom and Crash synthetics feature robust entry alert systems. For more advanced filter signals, consider the Harmonic Hybrid Pro. When trading spikes, three orders are strategically placed to manage risk, with the third order positioned close to the highest probability of a spike. Signals are no longer valid fifteen minutes after the final order, and any losses should be closed promptly. For take profit (Tp), it is advisable to exit shortly after a s
FREE
Gli utenti di questo prodotto hanno anche acquistato
Atomic Analyst MT5
Issam Kassas
5 (12)
Innanzitutto, vale la pena sottolineare che questo indicatore di trading non è repaint, non è ridisegno e non presenta ritardi, il che lo rende ideale sia per il trading manuale che per quello automatico. Manuale utente: impostazioni, input e strategia. L'Analista Atomico è un indicatore di azione del prezzo PA che utilizza la forza e il momentum del prezzo per trovare un miglior vantaggio sul mercato. Dotato di filtri avanzati che aiutano a rimuovere rumori e segnali falsi, e aumentare il pote
Innanzitutto è importante sottolineare che questo sistema di trading è un indicatore Non-Repainting, Non-Redrawing e Non-Lagging, il che lo rende ideale sia per il trading manuale che per quello automatico. Corso online, manuale e download di preset. Il "Sistema di Trading Smart Trend MT5" è una soluzione completa pensata sia per i trader principianti che per quelli esperti. Combina oltre 10 indicatori premium e offre più di 7 robuste strategie di trading, rendendolo una scelta versatile per div
Presentazione       Quantum Breakout PRO   , l'innovativo indicatore MQL5 che sta trasformando il modo in cui scambi le zone di breakout! Sviluppato da un team di trader esperti con un'esperienza di trading di oltre 13 anni,       Quantum Breakout PRO       è progettato per spingere il tuo viaggio di trading a nuovi livelli con la sua strategia innovativa e dinamica della zona di breakout. Quantum Breakout Indicator ti fornirà frecce di segnalazione sulle zone di breakout con 5 zone target
FX Volume MT5
Daniel Stein
4.94 (17)
Ricevi il tuo aggiornamento quotidiano sul mercato con dettagli e schermate tramite il nostro Morning Briefing qui su mql5 e su Telegram ! FX Volume è il PRIMO e UNICO indicatore di volume che fornisce una visione REALE del sentiment del mercato dal punto di vista del broker. Fornisce informazioni straordinarie su come gli operatori di mercato istituzionali, come i broker, sono posizionati sul mercato Forex, molto più velocemente dei rapporti COT. Vedere queste informazioni direttamente sul vo
Quantum Trend Sniper
Bogdan Ion Puscasu
5 (39)
Presentazione       Quantum Trend Sniper Indicator   , l'innovativo indicatore MQL5 che sta trasformando il modo in cui identifichi e scambi le inversioni di tendenza! Sviluppato da un team di trader esperti con un'esperienza di trading di oltre 13 anni,       Indicatore Quantum Trend Sniper       è progettato per spingere il tuo viaggio di trading verso nuove vette con il suo modo innovativo di identificare le inversioni di tendenza con una precisione estremamente elevata. *** Acquista Quant
A key element in trading is zones or levels from which decisions to buy or sell a trading instrument are made. Despite attempts by major players to conceal their presence in the market, they inevitably leave traces. Our task was to learn how to identify these traces and interpret them correctly. Reversal First Impulse levels (RFI)   -  Version MT4                  INSTRUCTIONS                 RUS                 ENG                         R ecommended to use with an indicator   -  TREND PRO  
RelicusRoad Pro MT5
Relicus LLC
4.82 (22)
Ora $ 147 (aumentando a $ 499 dopo alcuni aggiornamenti) - account illimitati (PC o MAC) Manuale utente di RelicusRoad + Video di formazione + Accesso al gruppo Discord privato + Stato VIP UN NUOVO MODO DI GUARDARE IL MERCATO RelicusRoad è l'indicatore di trading più potente al mondo per forex, futures, criptovalute, azioni e indici, fornendo ai trader tutte le informazioni e gli strumenti di cui hanno bisogno per rimanere redditizi. Forniamo analisi tecniche e piani di trading per aiutar
TPSproTREND PrO MT5
Roman Podpora
5 (7)
TPSpro TRENDPRO  - is a trend indicator that automatically analyzes the market and provides information about the trend and each of its changes, as well as giving signals for entering trades without redrawing! The indicator uses each candle, analyzing them separately. referring to different impulses - up or down impulse. Exact entry points into transactions for currencies, crypto, metals, stocks, indices!  -  Version MT4                  DETAILED DESCRIPTION        /       TRADING SETUPS       
FX Power MT5 NG
Daniel Stein
5 (5)
Ricevi il tuo aggiornamento quotidiano sul mercato con dettagli e schermate tramite il nostro Morning Briefing qui su mql5 e su Telegram ! FX Power MT5 NG è la nuova generazione del nostro popolare misuratore di forza delle valute, FX Power. Cosa offre questo misuratore di forza di nuova generazione? Tutto ciò che avete amato dell'FX Power originale IN PIÙ Analisi della forza di ORO/XAU Risultati di calcolo ancora più precisi Periodi di analisi configurabili individualmente Limite di calcolo pe
Top indicator for MT5   providing accurate signals to enter a trade without repainting! It can be applied to any financial assets:   forex, cryptocurrencies, metals, stocks, indices .  Watch  the video  (6:22) with an example of processing only one signal that paid off the indicator! MT4 version is here It will provide pretty accurate trading signals and tell you when it's best to open a trade and close it. Most traders improve their trading results during the first trading week with the help of
Gartley Hunter Multi
Siarhei Vashchylka
5 (7)
Gartley Hunter Multi - An indicator for searching for harmonic patterns simultaneously on dozens of trading instruments and on all classic timeframes: (m1, m5, m15, m30, H1, H4, D1, Wk, Mn). Manual (Be sure to read before purchasing) | Version for MT4 Advantages 1. Patterns: Gartley, Butterfly, Shark, Crab. Bat, Alternate Bat, Deep Crab, Cypher 2. Simultaneous search for patterns on dozens of trading instruments and on all classic timeframes 3. Search for patterns of all possible sizes. Fr
This is arguably the most complete harmonic price formation auto-recognition indicator you can find for the MetaTrader Platform. It detects 19 different patterns, takes fibonacci projections as seriously as you do, displays the Potential Reversal Zone (PRZ) and finds suitable stop-loss and take-profit levels. [ Installation Guide | Update Guide | Troubleshooting | FAQ | All Products ] It detects 19 different harmonic price formations It plots primary, derived and complementary Fibonacci p
Advanced Supply Demand MT5
Bernhard Schweigert
4.53 (15)
La migliore soluzione per qualsiasi principiante o trader esperto! Questo indicatore è uno strumento di trading unico, di alta qualità e conveniente perché abbiamo incorporato una serie di funzionalità proprietarie e una nuova formula. Con questo aggiornamento, sarai in grado di mostrare fusi orari doppi. Non solo potrai mostrare una TF più alta, ma anche entrambe, la TF del grafico, PIÙ la TF più alta: SHOWING NESTED ZONES. Tutti i trader di domanda di offerta lo adoreranno. :) Informazioni imp
Was: $249  Now: $99   Market Profile defines a number of day types that can help the trader to determine market behaviour. A key feature is the Value Area, representing the range of price action where 70% of trading took place. Understanding the Value Area can give traders valuable insight into market direction and establish the higher odds trade. It is an excellent addition to any system you may be using. Inspired by Jim Dalton’s book “Mind Over Markets”, this indicator is designed to suit the
Blahtech Supply Demand MT5
Blahtech Limited
4.57 (14)
Was: $299  Now: $99   Supply Demand uses previous price action to identify potential imbalances between buyers and sellers. The key is to identify the better odds zones, not just the untouched ones. Blahtech Supply Demand indicator delivers functionality previously unavailable on any trading platform. This 4-in-1 indicator not only highlights the higher probability zones using a multi-criteria strength engine, but also combines it with multi-timeframe trend analysis, previously confirmed swings
XQ Indicator MetaTrader 5
Marzena Maria Szmit
5 (1)
Step into the realm of Forex trading with confidence and precision using XQ, a cutting-edge Forex indicator designed to elevate your trading game to unprecedented heights. Whether you're a seasoned trader or just stepping into the world of currency exchange, XQ Forex Indicator empowers you with the insights and signals needed to make informed trading decisions. The signal conditions are a combination of three indicators, and XQ Forex Indicator only display  medium and long-term trends . The ind
Quantum Heiken Ashi PRO MT5
Bogdan Ion Puscasu
4.5 (8)
Ti presentiamo   Quantum Heiken Ashi PRO Progettate per fornire informazioni chiare sulle tendenze del mercato, le candele Heiken Ashi sono rinomate per la loro capacità di filtrare il rumore ed eliminare i falsi segnali. Dì addio alle confuse fluttuazioni dei prezzi e dai il benvenuto a una rappresentazione grafica più fluida e affidabile. Ciò che rende il Quantum Heiken Ashi PRO davvero unico è la sua formula innovativa, che trasforma i dati tradizionali delle candele in barre colorate di faci
77% discount for the next 10 buyers (original price $605): 1 left 3 Indicators in 1 indicator Strategy based on price action Made specifically for the best forex currency pairs Can be used in the best time frame of the market at a very reasonable price This indicator is basically 3 different indicatos . But we have combined these 3 indicators in 1 indicator so that you can use 3 indicators at the lowest price. All three strategies are based on price action. But based on different trends.
Introducing the South African Sniper indicator created by a small group of traders with a few years trading trading the financial market profitably . This is a plug and play indicator that provides you with  BUY and SELL (SNIPER ENTRY) signals with TARGET and trail stops. The indicator Works with all MT5 trading instruments. The indicator uses previous  chart data as receipt to speculate on future market moves.
Golden Gate Algo MT5
James David Lane
4 (6)
40% DI SCONTO PER NATALE! AUMENTO DEL PREZZO A $250 IL 1 GENNAIO! Presentiamo GoldenGate Entries: una soluzione di trading all'avanguardia! Scopri un approccio rivoluzionario al trading con GoldenGate Entries (GGE), un indicatore avanzato progettato per migliorare la tua esperienza di trading. GGE offre un set completo di funzionalità per fornire agli utenti precisione e fiducia nelle loro decisioni di trading. Coppie: Qualsiasi (FX - Materie prime - Azioni - Azioni - Cripto) TimeFrame
FxaccurateLS
Shiv Raj Kumawat
WHY IS OUR FXACCCURATE LS MT5 THE PROFITABLE ? PROTECT YOUR CAPITAL WITH RISK MANAGEMENT Gives entry, stop and target levels from time to time. It finds Trading opportunities by analyzing what the price is doing during established trends. POWERFUL INDICATOR FOR A RELIABLE STRATEGIES We have made these indicators with a lot of years of hard work. It is made at a very advanced level. Established trends provide dozens of trading opportunities, but most trend indicators completely ignore them!
Volume by Price MT5
Brian Collard
5 (3)
The Volume by Price Indicator for MetaTrader 5 features Volume Profile and Market Profile TPO (Time Price Opportunity). Get valuable insights out of currencies, equities and commodities data. Gain an edge trading financial markets. Volume and TPO histogram bar and line charts. Volume Footprint charts. TPO letter and block marker charts including split structures. Versatile segmentation and compositing methods. Static, dynamic and flexible ranges with relative and/or absolute visualizations. Lay
Wolfe Waves are naturally occurring trading patterns present in all financial markets and represent a fight towards an equilibrium price. These patterns can develop over short and long-term time frames and are one of the most reliable predictive reversal patterns in existence, normally preceding strong and long price movements. [ Installation Guide | Update Guide | Troubleshooting | FAQ | All Products ] Clear trading signals Amazingly easy to trade Customizable colors and sizes Implements perfo
MetaForecast M5
Vahidreza Heidar Gholami
5 (2)
MetaForecast predice e visualizza il futuro di qualsiasi mercato basandosi sull'armonia dei dati dei prezzi. Sebbene il mercato non sia sempre prevedibile, se esiste un modello nei prezzi, MetaForecast può prevedere il futuro con la massima precisione possibile. Rispetto ad altri prodotti simili, MetaForecast può generare risultati più accurati analizzando le tendenze di mercato. Parametri di input Past size (Dimensione passata) Specifica il numero di barre che MetaForecast utilizza per creare
TrendMaestro5
Stefano Frisetti
nota: questo indicatore e' per METATRADER5, se vuoi la versione per  METATRADER4 questo e' il link:   https://www.mql5.com/it/market/product/108106 TRENDMAESTRO ver 2.4 TRENDMAESTRO   riconosce un nuovo TREND sul nascere, non sbaglia mai. La sicurezza di identificare un nuovo TREND non ha prezzo. DESCRIZIONE TRENDMAESTRO identifica un nuovo TREND sul nascere, questo indicatore prende in esame la volatilita' i volumi ed il momentum per identificare il momento in cui c'e' un'esplosione di uno
The TimeCycleCaptor indicator is an innovative tool for accurately visualizing the market trend and generating buy and sell signals. The market trend plays a key role in making trading decisions, and our indicator provides a reliable tool for determining it. We have made traders' dream of non-lagging moving averages come true in our indicator. TimeCycleCaptor is capable of predicting future values ​​and is designed to both identify the underlying trend and identify short-term buy or sell si
Owl Smart Levels MT5
Sergey Ermolov
4.49 (37)
Versione MT4  |  FAQ L' indicatore Owl Smart Levels è un sistema di trading completo all'interno dell'unico indicatore che include strumenti di analisi di mercato popolari come i frattali avanzati di Bill Williams , Valable ZigZag che costruisce la corretta struttura a onde del mercato, e i livelli di Fibonacci che segnano i livelli esatti di entrata nel mercato e luoghi per prendere profitti. Descrizione dettagliata della strategia Istruzioni per lavorare con l'indicatore Consulente-assistente
With Fixed Range Volume Profile,The traces left by the big players will not go unnoticed by you. Professional   Volume Profile   Indicator reveals Institutional order flow. This advanced market indicator will teach you to spot the buying and selling. Dont want to say more because its well known by most professionals  trader. This Indicator : -  Quickly Identify the Strongest Institutional S/R Zones. - W orks with all Trading Instruments (Forex, Futures, Indexes, Commodities, Stocks, Cryptocur
Renko is a well-known Japanese charting technique that removes time from the chart. Instead of drawing bars in constant intervals (time) as a normal chart would, a Renko chart does so only when price moves beyond a predefined amount. In a Renko chart, a bar is created when price exceeds the previous bar’s high or low by a predefined amount or what we call the Box Size. The result is a chart with equally sized bars running up or down in 45 degree angles. Such a chart offers the following advant
User Support Paid subscribers may request to join the WTGS Workshop @DB_WTI after emailing your Twitter handle and the proof of subscription to wtg.system.international@gmail.com . The System WTGS Navigator Saturn consists of six components: TrendFinder Saturn: Internal Trending   Confirmation   Titan: Internal Trending   Indicator Outer Ring: External Trending Indicator Inner Ring: External Trending Confirmation Data: The time-lapse of a trend on any given timeframe Disclaimers Although every
Altri dall’autore
UR TradeManager MT5
Krzysztof Jan Debski
UR_TradeManager per MetaTrader 5 Massimizza il tuo potenziale di trading con UR_TradeManager, lo strumento definitivo per migliorare il trading, progettato specificamente per la piattaforma MetaTrader 4. Realizzato con precisione e funzionalità in mente, questo strumento completo è essenziale per i trader che mirano a elevare le loro capacità di analisi di mercato, esecuzione e gestione. Caratteristiche Principali: Dashboard di Trading Visiva : Gestisci i tuoi scambi direttamente da un cruscotto
UR Control Panel
Krzysztof Jan Debski
5 (2)
Pannello di controllo dell'UR   UR Control Panel è uno strumento che voglio condividere con te GRATUITAMENTE. È un pannello interattivo che mi ha aiutato nel mio trading e ha potenziato la mia scansione del mercato ogni giorno. Spero che soddisfi anche le tue esigenze! Come utilizzare il Pannello di controllo UR? È un doppio pannello mobile e ridimensionabile di cui: - Uno di questi mostra la forza della valuta nel periodo di tempo specificato - L'altro consente alle opzioni di spostarsi
FREE
UR Basket
Krzysztof Jan Debski
Cestino UR   Il meglio che puoi fare è proteggere i tuoi ordini dal trasformarsi in perdite. Ora puoi rilassarti e lasciare che UR Basket se ne occupi. Vantaggi dell'utilizzo di UR Basket: Tutti i parametri sono modificabili dinamicamente nel pannello grafico del grafico - NON è necessario riavviare l'EA per modificare i parametri o richiamare le impostazioni utilizzate! Puoi monitorare i tuoi ordini tramite:   - Numero magico   - Commento EA   - Entrambi i precedenti   - Tutte le tue ope
UR DivergenceSpotter
Krzysztof Jan Debski
UR Divergence Spotter   UR DivergenceSpotter è il risultato di molti anni di esperienza e talvolta i modi più semplici sono i migliori. C'è una buona correlazione tra alcuni indicatori, ma quando non corrispondono - il prezzo cerca di "aggiustarsi" - ed è in quel momento che riceviamo un segnale con UR DivergenceSpotter. Vantaggi dell'utilizzo di UR Divergence Spotter: Nessun parametro Non ridipingere dopo che la candela è stata creata Segnala quando il segnale non è più valido (il che si
UR VolumeTrend
Krzysztof Jan Debski
UR VolumeTrend   UR VolumeTrend è l'indicatore di volume più chiaro che mostra la tendenza in corso in termini di volume. Funziona perfettamente con altri indicatori proprio come UR TrendExhaustion per segnalare massimi e minimi locali. Limitato a soli 2 parametri: più alti sono i valori, più lunghe saranno le tendenze che mostrerà. Gli estremi del gradiente mostrano possibili esaurimenti di volume per catturare una potenziale inversione. Due righe: l'andamento del volume e la media. Il mig
UR TrendExhaustion
Krzysztof Jan Debski
UR Trend Esaurimento   UR TrendExhaustion è la soluzione migliore per i trader che non vogliono avere a che fare con i valori dei parametri né con altre configurazioni: è facile e visivamente comprensibile per tutti. Vantaggi dell'utilizzo di UR TrendExhaustion: Nessun parametro Hai 3 linee che descrivono al meglio cosa sta succedendo sul grafico: Trend Exhaustion Line, Whale Money Line e Retail Money Line. L'interfaccia mostra l'esaurimento di entrambe le linee su entrambi gli estremi (a
UR HighsAndLows
Krzysztof Jan Debski
UR Massimi e minimi   UR Highs&Lows esegue un'analisi approfondita del movimento del prezzo e della sua volatilità e crea un canale all'interno del quale il prezzo si muove. Quel canale ora si muove come un oscillatore ed è ricoperto dalla deviazione del prezzo per segnalare potenziali esaurimenti e possibili inversioni. Vantaggi dell'utilizzo di UR Highs&Lows: Nessun parametro Hai 3 linee che descrivono il movimento del prezzo: la linea bianca che è una media del prezzo e le linee blu ch
UR Momenter
Krzysztof Jan Debski
UR Momento   UR Momenter calcola perfettamente il momentum del prezzo in correlazione all'esaurimento del movimento del prezzo rappresentato come oscillatore. Pertanto questo ci dà segnali molto precoci di potenziali inversioni o ritracciamenti. Questa formula è stata scoperta nel 2018 dopo lo scoppio della bolla di mercato. Vantaggi dell'utilizzo di UR Momenter: Nessun parametro Hai 2 linee che descrivono il movimento del prezzo - Linea bianca che è il Momentum del prezzo in correlazione
UR FrontEndBackEnd
Krzysztof Jan Debski
UR FrontEndBackEnd   UR FrontEndBackEnd è la mia formula preferita per trovare i livelli più accurati di supporto e resistenza. Li ho anche suddivisi in diverse categorie (linee tratteggiate, linee continue e aree) per evidenziare quanto sono forti. Tutto è memorizzato in buffer in modo che siano facilmente accessibili e implementabili all'interno di altri strumenti. Aggiunta: potrebbe essere necessario adattare lo strumento all'asset su cui è applicato: gli asset differiscono in termini di
UR Gamma
Krzysztof Jan Debski
UR Gamma (alimentato da calcoli simili trovati nei sistemi di Machine Learning) UR Gamma è uno strumento di analisi finanziaria all'avanguardia che offre una versione nuova e migliorata del classico indicatore WaveTrend. Incorporando tecniche avanzate di elaborazione del segnale digitale, UR Gamma risolve alcuni dei limiti degli algoritmi WaveTrend tradizionali e fornisce un approccio più accurato, robusto e dinamico per identificare e misurare le tendenze nell'azione dei prezzi. Vantaggi d
UR Bands
Krzysztof Jan Debski
Bande UR (con una formula utilizzata nei sistemi di Machine Learning) UR Bands è un indicatore derivato attraverso una formula che incorpora la volatilità del mercato è simile in linea di principio a quelli utilizzati nei sistemi di apprendimento automatico. Questa rappresentazione matematica delle condizioni di mercato offre un'analisi precisa delle tendenze e delle dinamiche dei prezzi, tenendo conto della volatilità intrinseca dei mercati finanziari. Incorporando la volatilità come variabi
UR Vortex
Krzysztof Jan Debski
UR Vortex The Probabilistic UR Vortex Formula: An Accurate System for Predictive Market Analysis using Volatility and Standard Deviation Calculations. The   UR Vortex   indicator is a technical analysis tool that uses volatility and standard deviation calculations to predict potential tops and bottoms in a market. It measures the strength of a trend by calculating the distance between the current price and a moving average, and then standardizing this distance by dividing it by the average true
UR PulseScalp
Krzysztof Jan Debski
UR PulseScalp  Un indicatore di trading calibrato per gli scalper che cercano il massimo vantaggio nei mercati frenetici UR PulseScalp è una soluzione di trading all'avanguardia per gli scalper che cercano il massimo vantaggio nei mercati frenetici. Questo indicatore innovativo si basa su una formula scientificamente calibrata che combina la potenza di Volatilità, MoneyFlow e Relative Strength per creare un segnale altamente accurato e affidabile. Vantaggi dell'utilizzo di UR PulseScalp :
UR TradeManager
Krzysztof Jan Debski
UR_TradeManager per MetaTrader 4 Massimizza il tuo potenziale di trading con UR_TradeManager, lo strumento definitivo per migliorare il trading, progettato specificamente per la piattaforma MetaTrader 4. Realizzato con precisione e funzionalità in mente, questo strumento completo è essenziale per i trader che mirano a elevare le loro capacità di analisi di mercato, esecuzione e gestione. Caratteristiche Principali: Dashboard di Trading Visiva : Gestisci i tuoi scambi direttamente da un cruscotto
UR Basket MT5
Krzysztof Jan Debski
Cestino UR   Il meglio che puoi fare è proteggere i tuoi ordini dal trasformarsi in perdite. Ora puoi rilassarti e lasciare che UR Basket se ne occupi. Vantaggi dell'utilizzo di UR Basket: Tutti i parametri sono modificabili dinamicamente nel pannello grafico del grafico - NON è necessario riavviare l'EA per modificare i parametri o richiamare le impostazioni utilizzate! Puoi monitorare i tuoi ordini tramite:   - Numero magico   - Commento EA   - Entrambi i precedenti   - Tutte le tue ope
UR Divergence Spotter   UR DivergenceSpotter è il risultato di molti anni di esperienza e talvolta i modi più semplici sono i migliori. C'è una buona correlazione tra alcuni indicatori, ma quando non corrispondono - il prezzo cerca di "aggiustarsi" - ed è in quel momento che riceviamo un segnale con UR DivergenceSpotter. Vantaggi dell'utilizzo di UR Divergence Spotter: Nessun parametro Non ridipingere dopo che la candela è stata creata Segnala quando il segnale non è più valido (il che si
UR VolumeTrend MT5
Krzysztof Jan Debski
UR VolumeTrend   UR VolumeTrend è l'indicatore di volume più chiaro che mostra la tendenza in corso in termini di volume. Funziona perfettamente con altri indicatori proprio come UR TrendExhaustion per segnalare massimi e minimi locali. Limitato a soli 2 parametri: più alti sono i valori, più lunghe saranno le tendenze che mostrerà. Gli estremi del gradiente mostrano possibili esaurimenti di volume per catturare una potenziale inversione. Due righe: l'andamento del volume e la media. Il mig
UR Trend Esaurimento   UR TrendExhaustion è la soluzione migliore per i trader che non vogliono avere a che fare con i valori dei parametri né con altre configurazioni: è facile e visivamente comprensibile per tutti. Vantaggi dell'utilizzo di UR TrendExhaustion: Nessun parametro Hai 3 linee che descrivono al meglio cosa sta succedendo sul grafico: Trend Exhaustion Line, Whale Money Line e Retail Money Line. L'interfaccia mostra l'esaurimento di entrambe le linee su entrambi gli estremi (a
UR HighsAndLows MT5
Krzysztof Jan Debski
UR Massimi e minimi   UR Highs&Lows esegue un'analisi approfondita del movimento del prezzo e della sua volatilità e crea un canale all'interno del quale il prezzo si muove. Quel canale ora si muove come un oscillatore ed è ricoperto dalla deviazione del prezzo per segnalare potenziali esaurimenti e possibili inversioni. Vantaggi dell'utilizzo di UR Highs&Lows: Nessun parametro Hai 3 linee che descrivono il movimento del prezzo: la linea bianca che è una media del prezzo e le linee blu ch
UR Momenter MT5
Krzysztof Jan Debski
UR Momento   UR Momenter calcola perfettamente il momentum del prezzo in correlazione all'esaurimento del movimento del prezzo rappresentato come oscillatore. Pertanto questo ci dà segnali molto precoci di potenziali inversioni o ritracciamenti. Questa formula è stata scoperta nel 2018 dopo lo scoppio della bolla di mercato. Vantaggi dell'utilizzo di UR Momenter: Nessun parametro Hai 2 linee che descrivono il movimento del prezzo - Linea bianca che è il Momentum del prezzo in correlazione
UR FrontEndBackEnd   UR FrontEndBackEnd è la mia formula preferita per trovare i livelli più accurati di supporto e resistenza. Li ho anche suddivisi in diverse categorie (linee tratteggiate, linee continue e aree) per evidenziare quanto sono forti. Tutto è memorizzato in buffer in modo che siano facilmente accessibili e implementabili all'interno di altri strumenti. Aggiunta: potrebbe essere necessario adattare lo strumento all'asset su cui è applicato: gli asset differiscono in termini di
UR Gamma MT5
Krzysztof Jan Debski
UR Gamma (alimentato da calcoli simili trovati nei sistemi di Machine Learning) UR Gamma è uno strumento di analisi finanziaria all'avanguardia che offre una versione nuova e migliorata del classico indicatore WaveTrend. Incorporando tecniche avanzate di elaborazione del segnale digitale, UR Gamma risolve alcuni dei limiti degli algoritmi WaveTrend tradizionali e fornisce un approccio più accurato, robusto e dinamico per identificare e misurare le tendenze nell'azione dei prezzi. Vantaggi d
UR Vortex MT5
Krzysztof Jan Debski
UR Vortex MT5 The Probabilistic UR Vortex Formula: An Accurate System for Predictive Market Analysis using Volatility and Standard Deviation Calculations. The UR Vortex MT5 indicator is a technical analysis tool that uses volatility and standard deviation calculations to predict potential tops and bottoms in a market. It measures the strength of a trend by calculating the distance between the current price and a moving average, and then standardizing this distance by dividing it by the average
UR PulseScalp MT5
Krzysztof Jan Debski
UR PulseScalp MT5 Un indicatore di trading calibrato per gli scalper che cercano il massimo vantaggio nei mercati frenetici UR PulseScalp MT5 è una soluzione di trading all'avanguardia per gli scalper che cercano il massimo vantaggio nei mercati frenetici. Questo indicatore innovativo si basa su una formula scientificamente calibrata che combina la potenza di Volatilità, MoneyFlow e Relative Strength per creare un segnale altamente accurato e affidabile. Vantaggi dell'utilizzo di UR PulseSc
Filtro:
Nessuna recensione
Rispondi alla recensione