• Panoramica
  • Recensioni
  • Commenti (3)

Trend Signals Alerts

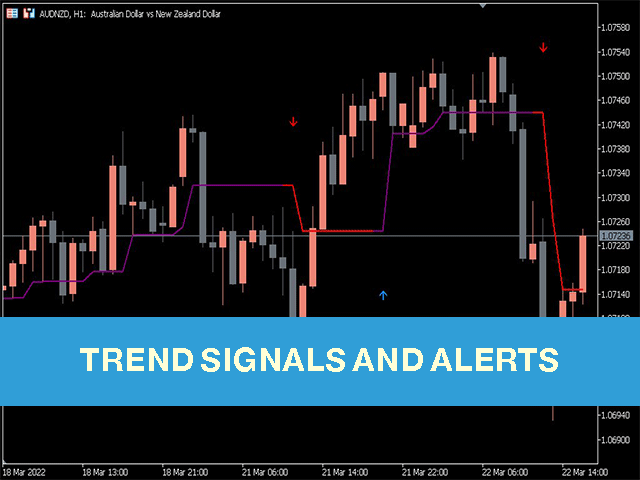
Indicatore di trading forex che segue le tendenze e non ridipinge.

I suoi segnali sono calcolati e forniti in modo totalmente automatico e si basano su intersezioni di medie mobili. È uno strumento adatto ai principianti in quanto questi segnali sono presentati sotto forma di semplici frecce di acquisto/vendita. Tuttavia, l'affidabilità del segnale è davvero solida. Puoi usarlo in combinazione con qualsiasi strategia di trading forex.


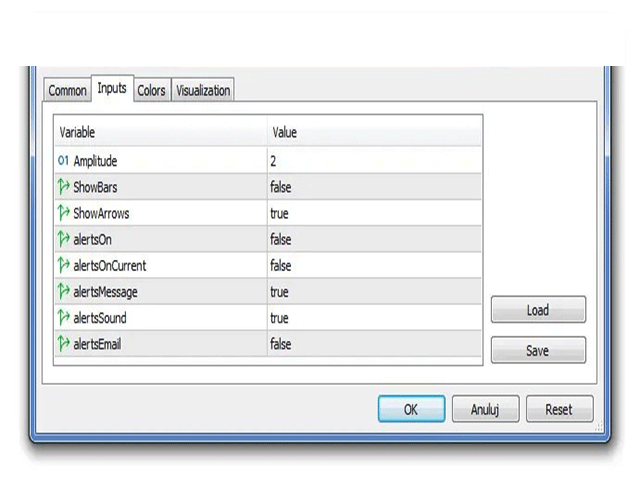
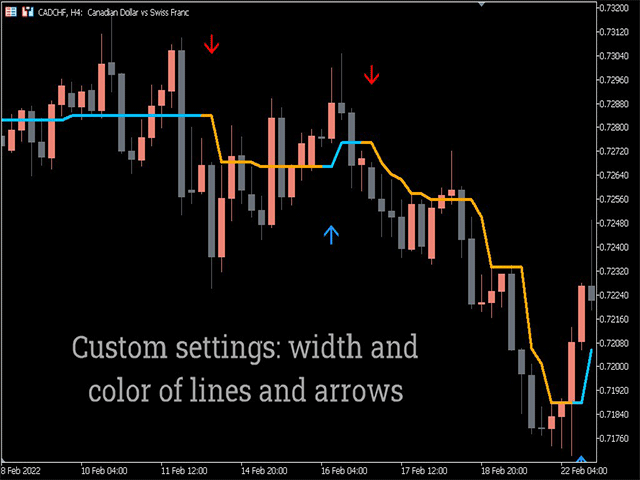
L'indicatore di avvisi dei segnali di tendenza si adatta a tutti i tipi di tempi e coppie di valute. Viene visualizzato direttamente sul grafico di trading principale. Le impostazioni predefinite possono essere modificate direttamente dalla scheda di input.

Sguardo più attento sull'indicatore di avvisi sui segnali di tendenza
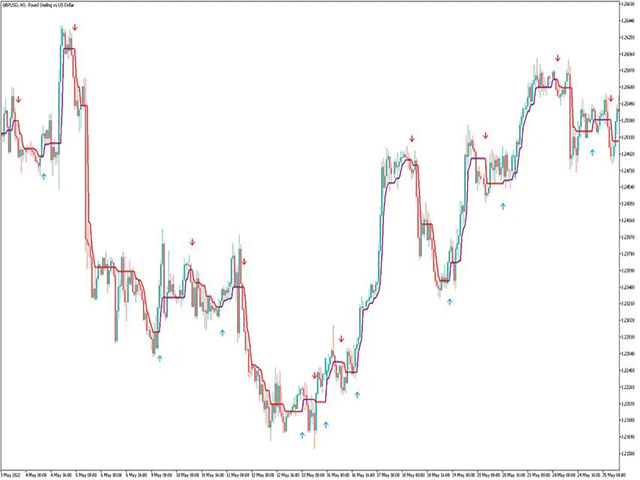
L'idea principale alla base di tale indicatore è fornire un modo semplice per dimostrare le tendenze del mercato e i segnali commerciali. Di conseguenza, sia i principianti che i trader esperti possono trarre vantaggio dallo strumento. Dai un'occhiata a come appare quando attivato in MT5 negli screenshot.

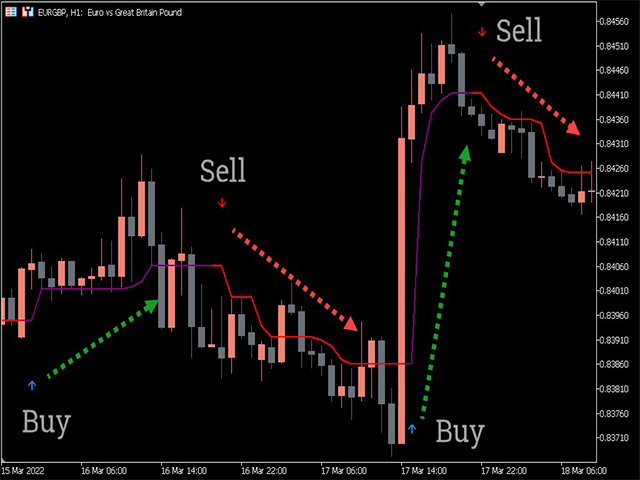
Segnali di tendenza Indicatori di avvisi Anatomia
Come puoi vedere, è solo una linea con frecce di acquisto/vendita per fare trading di conseguenza. Le frecce sono posizionate nello stesso punto in cui avviene l'intersezione delle medie mobili. Tuttavia, non è possibile modificare i periodi di queste medie mobili.

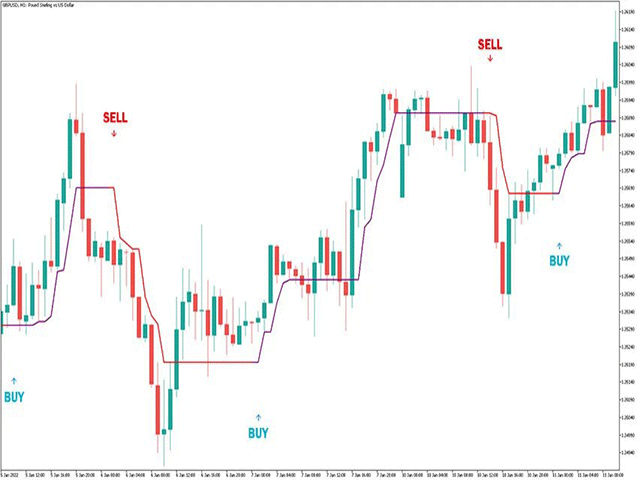
Indicatore di avvisi di segnali di tendenza: segnale di acquisto
Segui questi suggerimenti per un segnale commerciale lungo:
1. Si verifica la freccia verso l'alto
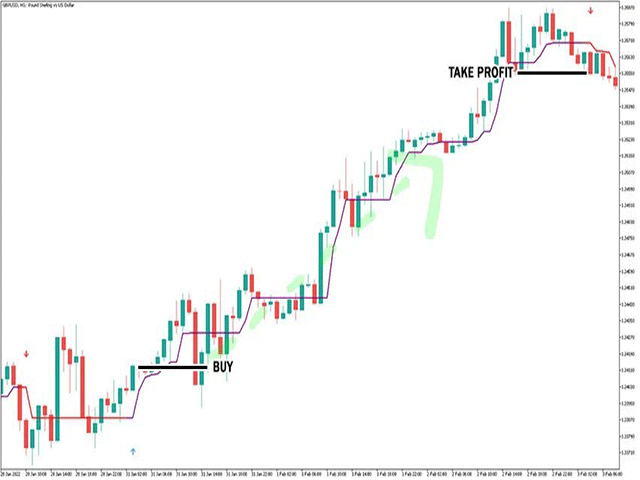
2. Aprire il commercio di acquisto dopo aver attivato la chiusura della candela
3. Impostare lo stop loss a pochi pip al di sotto del minimo di mercato più recente
4. Mantieni aperta la tua posizione fino a quando non si verifica il segnale opposto o utilizza la tua strategia di uscita commerciale


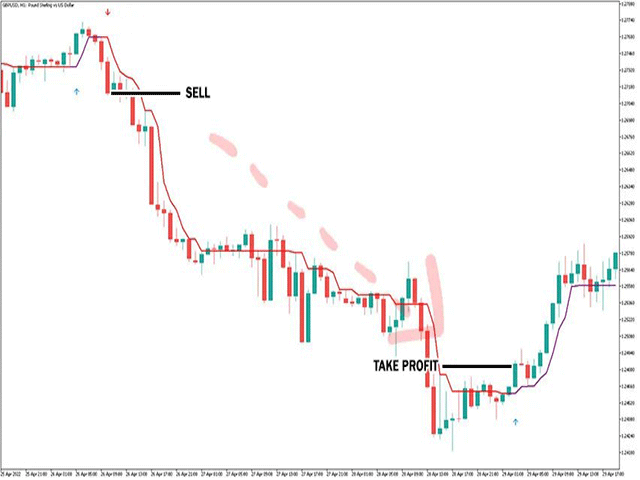
Half Trend Buy Sell Indicator: segnale di vendita
Segui questi suggerimenti per un segnale commerciale breve:
1. Si verifica la freccia verso il basso
2. Aprire il commercio di vendita dopo aver attivato la chiusura della candela
3. Impostare lo stop loss a pochi pip sopra il massimo del mercato più recente
4. Mantieni aperta la tua posizione fino a quando non si verifica il segnale opposto o utilizza la tua strategia di uscita commerciale
Prodotti consigliati
Seconds Charts
Aleksandr Goryachev
Micro  ******************* Секундные графики MT5 ********************** Более точного инструмента для входа в сделку вы не найдёте. Входные параметры: Timeframe, sek - период построения графика, секунды Displayed bars - отображаемые бары Step of price levels, pp, 0-off - шаг отрисовки ценовых уровней, пункты Scale points per bar, 0-off - масштаб в пунктах на бар Show lines - отображение текущих уровней Show comment - отображение комментария Standard color scheme - стандартная цветовая сх
Introduction to Chart Pattern MT Chart Pattern MT is a chart pattern scanner to detect the triangle pattern, falling wedge pattern, rising wedge pattern, channel pattern and so on. Chart Pattern MT uses highly sophisticated chart pattern detection algorithm. However, we have designed it in the easy to use with intuitive user interface. Chart Pattern MT will show all the patterns in your chart in the most efficient format for your trading. You do not have to do tedious manual pattern detection an
Matreshka
Dimitr Trifonov
5 (1)
Matreshka self-testing and self-optimizing indicator: 1. Is an interpretation of the Elliott Wave Analysis Theory. 2. Based on the principle of the indicator type ZigZag, and the waves are based on the principle of interpretation of the theory of DeMark. 3. Filters waves in length and height. 4. Draws up to six levels of ZigZag at the same time, tracking waves of different orders. 5. Marks Pulsed and Recoil Waves. 6. Draws arrows to open positions 7. Draws three channels. 8. Notes support and re
Introduction to Harmonic Volatility Indicator Harmonic Volatility Indicator is the first technical analysis applying the Fibonacci analysis to the financial volatility. Harmonic volatility indicator is another level of price action trading tool, which combines robust Fibonacci ratios (0.618, 0.382, etc.) with volatility. Originally, Harmonic Volatility Indicator was developed to overcome the limitation and the weakness of Gann’s Angle, also known as Gann’s Fan. We have demonstrated that Harmonic
Description The indicator uses market profile theory to show the most relevant trading zones, on a daily basis. The zones to be shown are LVN (low volume nodes) and POC (point of control). An LVN zone is one which represents price areas with the least time or volume throughout the day. Typically, these areas indicate a supply or demand initiative, and in the future, they can turn into important breakout or retracement zones. A POC zone is one which represents price areas with the most time or vo
Was: $249  Now: $99   Market Profile defines a number of day types that can help the trader to determine market behaviour. A key feature is the Value Area, representing the range of price action where 70% of trading took place. Understanding the Value Area can give traders valuable insight into market direction and establish the higher odds trade. It is an excellent addition to any system you may be using. Inspired by Jim Dalton’s book “Mind Over Markets”, this indicator is designed to suit the
Prices move for many reasons and these can vary from one operator to another: software, private and institutional traders simultaneously contribute to the formation of the price, making predictive art very difficult. However, there are measurable factors that bind the price to an underlying trend in line with the physical reality that the financial asset represents: these are the macroeconomic indicators. Large investors use this information wisely to set their strategies. Understanding these m
Introduction to X3 Chart Pattern Scanner X3 Cherart Pattern Scanner is the non-repainting and non-lagging indicator detecting X3 chart patterns including Harmonic pattern, Elliott Wave pattern, X3 patterns, and Japanese Candlestick patterns. Historical patterns match with signal patterns. Hence, you can readily develop the solid trading strategy in your chart. More importantly, this superb pattern scanner can detect the optimal pattern of its kind. In addition, you can switch on and off individu
Atomic Analyst MT5
Issam Kassas
5 (12)
Innanzitutto, vale la pena sottolineare che questo indicatore di trading non è repaint, non è ridisegno e non presenta ritardi, il che lo rende ideale sia per il trading manuale che per quello automatico. Manuale utente: impostazioni, input e strategia. L'Analista Atomico è un indicatore di azione del prezzo PA che utilizza la forza e il momentum del prezzo per trovare un miglior vantaggio sul mercato. Dotato di filtri avanzati che aiutano a rimuovere rumori e segnali falsi, e aumentare il pote
SmartTrendMt5
Andrey Spiridonov
The SmartTrendMt5 trend indicator generates signals based on the principle of combined analysis of calculated reference points within the Keltner channel. The indicator plots the Keltner channel in a separate window (by default, red lines and a blue line - the middle of the channel), and also draws the histogram of calculated reference points for each candle (by default, the histogram bars are yellow). The should be attached to a chart of any timeframe and any trading symbol in the usual way.
Trend and Signals MT5  indicator scans  30 trading Instruments (Forex, Metals and Indices).     It uses special algorithm on the  current market   based on   Pure Price Action   and display the overall trend and signal on the dashboard. When signals are produced the indicator sends alert and notification. Strategy for Signals This indicator uses the daily timeframe to determine the direction of the trend. The hourly timeframe is used to identify possible entries. Main trend and is determined by
This indicator finds AB=CD retracement patterns. The AB=CD Retracement pattern is a 4-point price structure where the initial price segment is partially retraced and followed by an equidistant move from the completion of the pullback, and is the basic foundation for all harmonic patterns. [ Installation Guide | Update Guide | Troubleshooting | FAQ | All Products ] Customizable pattern sizes Customizable AC and BD ratios Customizable breakout periods Customizable lines, colors and sizes It
This indicator can automatically scan the RSI values of all varieties on the mt5 and set an alarm. Note that it is fully automatic scanning, you do not need to enter which varieties, do not need to open the variety chart, as long as there are some varieties in the market quotation column, will be automatically scanned to reach the set rsi alarm value, will pop up the alarm, and cycle with the market changes to scan the latest RSI values of all varieties, and alarm. This is very helpful t
MarketMagnet
Kelly Adediran Raymond
Are you ready to take your trading journey to new heights? Look no further than MarketMagnet, this groundbreaking indicator designed to propel your trading success with excitement and accuracy. Powered by the convergence of Momentum and CCI (Commodity Channel Index), MarketMagnet equips traders with the ultimate tool to determine direction and entry prices for a wide range of recommended currency pairs and instruments. It is designed for traders seeking to scalp for a few pips on lower timeframe
PipFinite Exit EDGE MT5
Karlo Wilson Vendiola
4.89 (35)
Did You Have A Profitable Trade But Suddenly Reversed? In a solid strategy, exiting a trade is equally important as entering. Exit EDGE helps maximize your current trade profit and avoid turning winning trades to losers. Never Miss An Exit Signal Again Monitor all pairs and timeframes in just 1 chart www.mql5.com/en/blogs/post/726558 How To Trade You can close your open trades as soon as you receive a signal Close your Buy orders if you receive an Exit Buy Signal. Close your Sell orde
PZ Trend Trading MT5
PZ TRADING SLU
3.67 (3)
Trend Trading is an indicator designed to profit as much as possible from trends taking place in the market, by timing pullbacks and breakouts. It finds trading opportunities by analyzing what the price is doing during established trends. [ Installation Guide | Update Guide | Troubleshooting | FAQ | All Products ] Trade financial markets with confidence and efficiency Profit from established trends without getting whipsawed Recognize profitable pullbacks, breakouts and early reversals The ind
"GoldenSwing" is a comprehensive MetaTrader 5 indicator meticulously crafted by Southern Star Trading, designed to enhance your trading strategies with precision swing high and swing low identification. Harnessing the power of swing analysis, this indicator provides traders with invaluable insights into market reversals and trend continuations, enabling them to make informed trading decisions. With its advanced algorithm, GoldenSwing detects significant swing highs and swing lows in real-time
How to use Pair Trading Station Pair Trading Station is recommended for H1 time frame and you can use it for any currency pairs. To generate buy and sell signal, follow few steps below to apply Pair Trading Station to your MetaTrader terminal. When you load Pair Trading Station on your chart, Pair Trading station will assess available historical data in your MetaTrader platforms for each currency pair. On your chart, the amount of historical data available will be displayed for each currency pai
Volatility Index Pro Indicator
Savia Forex Software Solutions
Volatility Index Pro Indicator The Savia Forex Solutions Volatility Index Pro Indicator gives you highly accurate entries on all Volatility Indices and Jump Indices. The Volatility Index Pro Indicator is dynamic and powerful and is optimized for all timeframes. Trade with improved confidence and maximize your success rate. Benefits Dynamic and Powerful. Volatility Index Pro Indicator is fully optimized for all chart timeframes. Volatility Index Pro Indicator works with Volatility Indices and Jum
The indicator is designed to work on any trading platform. The program is based on proprietary algorithms and W.D.Ganna's mathematics, allowing you to calculate target levels of price movement based on three points with the highest degree of certainty. It is a great tool for stock trading. The indicator has three buttons: NEW - call up a triangle for calculation. DEL - delete the selected triangle. DELS - completely remove all constructions. The probability of achieving the goals is more than 80
Все паттерны из книги Томас Н. Булковский "Полная энциклопедия графических ценовых моделей" в одном индикаторе со сканером. Cканер включается параметром ScannerMode. При ScannerMode=false индикатор ищет один паттерн (выбирается переменной Pattern). При выявлении паттерна индикатор рисует стрелку, открывает окно сообщений, выполняет push-уведомление. У индикатора много параметров, некоторые их них задействованы всегда, некоторые выборочно. Включите переменную ShowHelp - на графике отобразится по
This indicator is used to detect spike movements in Boom and Crash pairs in Deriv company and enter into transactions. The pairs used are Boom300, Boom500, Boom1000, Crash300, Crash500, Crash1000. When the indicator gives an arrow sign in the expected direction, the transaction is entered and Stop Loss should be placed on the support/resistance areas shown by the indicator. The indicator does not repaint. It is not used for trend following, but for entering transactions in the direction of
EFW Pattern Trader is a powerful pattern scanner for Forex and Stock trading. The pattern detection in EFW Pattern Trader uses the Fractal Wave Theory, which captures the endless up and down movement of the market. Therefore, EFW Pattern Trader can be considered as the robust price action indicator. Any patterns in EFW Pattern Trader can be backtested visually in your strategy tester. Visual backtesting with pattern will show you how pattern will likely behave in the live trading. Therefore, you
RAD CRITICAL LEVES RAD indicator tracks “Relevant Volume” in real time, identifying accumulation and distribution processes, projecting them in the chart as SUPPORT or RESISTANCE zones. Natural   support   and resistance levels are generated by Volume Accumulation and Distribution processes. As these processes evolve, levels at which the relevant volume in the market place is positioned, become difficult areas to cross upwards or downwards. By using this information, traders can identify very s
Point of Interest MT5
Scott Edward Merritt
What is a Point of Interest? Traders who follow Smart Money Concepts may call this a Liquidity Point, or areas pools of liquidity have been built up by retail traders for for Big Banks to target to create large price movements in the market. As we all know, retail traders that use outdated and unreliable methods of trading like using trendlines, support and resistance, RSI, MACD, and many others to place trades and put their stop losses at keys points in the market. The "Big Banks" know these me
Naked Forex Kangaroo Tail Indicator Kangaroo Tail Indicator is a pattern recognition indicator for Forex, Stocks, Indices, Futures, Commodities and Cryptos. The Kangaroo Tail is a multi-bar pattern. The Kangaroo Tail pattern is very effective and is very simple to trade. The strategy that comes with the Kangaroo Tail is based on price action. The indicator does what it was designed for: displaying Kangaroo Tail patterns.   Don't expect to follow the up and down arrows and make money . Tr
VolumeDeltaBars
Stanislav Korotky
This indicator is a conventional analytical tool for tick volumes changes. It calculates tick volumes for buys and sells separately, and their delta on every bar, and displays volumes by price clusters (cells) within a specified bar (usually the latest one). The algorithm used internally is the same as in the indicator VolumeDeltaMT5 , but results are shown as cumulative volume delta bars (candlesticks). Analogous indicator for MetaTrader 4 exists - CumulativeDeltaBars . This is a limited substi
Gioteen Volatility Index (GVI) - your ultimate solution to overcoming market unpredictability and maximizing trading opportunities. This revolutionary indicator helps you in lowering your losing trades due to choppy market movements. The GVI is designed to measure market volatility, providing you with valuable insights to identify the most favorable trading prospects. Its intuitive interface consists of a dynamic red line representing the volatility index, accompanied by blue line that indicate
No Demand No Supply MT5
Trade The Volume Waves Single Member P.C.
No Demand No Supply   This indicator identifies   No Demand –No Supply candles  to your chart and plots volume bars colored according to the signal. It can be applied to all timeframes or to a specific one only. It can also be used as regular volume indicator  with exceptional future of WEIGHTED VOLUME. Furthermore is has an alert notification, sound and email when a signals occurs. The indicator does not repaint but the alert will come on two candles back due to the definition of No Demand No S
Introduction to EFW Analytics EFW Analytics was designed to accomplish the statement "We trade because there are regularities in the financial market". EFW Analytics is a set of tools designed to maximize your trading performance by capturing the repeating fractal geometry, known as the fifth regularity in the financial market. The functionality of EFW Analytics consists of three parts. Firstly, Equilibrium Fractal Wave Index is an exploratory tool to support your trading logic to choose which r
Gli utenti di questo prodotto hanno anche acquistato
Innanzitutto è importante sottolineare che questo sistema di trading è un indicatore Non-Repainting, Non-Redrawing e Non-Lagging, il che lo rende ideale sia per il trading manuale che per quello automatico. Corso online, manuale e download di preset. Il "Sistema di Trading Smart Trend MT5" è una soluzione completa pensata sia per i trader principianti che per quelli esperti. Combina oltre 10 indicatori premium e offre più di 7 robuste strategie di trading, rendendolo una scelta versatile per div
FX Volume MT5
Daniel Stein
4.94 (17)
Ricevi il tuo aggiornamento quotidiano sul mercato con dettagli e schermate tramite il nostro Morning Briefing qui su mql5 e su Telegram ! FX Volume è il PRIMO e UNICO indicatore di volume che fornisce una visione REALE del sentiment del mercato dal punto di vista del broker. Fornisce informazioni straordinarie su come gli operatori di mercato istituzionali, come i broker, sono posizionati sul mercato Forex, molto più velocemente dei rapporti COT. Vedere queste informazioni direttamente sul vo
Quantum Trend Sniper
Bogdan Ion Puscasu
5 (39)
Presentazione       Quantum Trend Sniper Indicator   , l'innovativo indicatore MQL5 che sta trasformando il modo in cui identifichi e scambi le inversioni di tendenza! Sviluppato da un team di trader esperti con un'esperienza di trading di oltre 13 anni,       Indicatore Quantum Trend Sniper       è progettato per spingere il tuo viaggio di trading verso nuove vette con il suo modo innovativo di identificare le inversioni di tendenza con una precisione estremamente elevata. *** Acquista Quant
Gold Stuff mt5
Vasiliy Strukov
4.89 (170)
Gold Stuff mt5 è un indicatore di tendenza progettato specificamente per l'oro e può essere utilizzato anche su qualsiasi strumento finanziario. L'indicatore non ridisegna e non è in ritardo. Periodo consigliato H1. Contattami subito dopo l'acquisto per avere le impostazioni e un bonus personale!   IMPOSTAZIONI Disegna freccia - acceso spento. disegnando frecce sul grafico. Avvisi: avvisi acustici disattivati. Notifica e-mail - on off. notifiche di posta elettronica. Notifica Puch - on of
Presentazione       Quantum Breakout PRO   , l'innovativo indicatore MQL5 che sta trasformando il modo in cui scambi le zone di breakout! Sviluppato da un team di trader esperti con un'esperienza di trading di oltre 13 anni,       Quantum Breakout PRO       è progettato per spingere il tuo viaggio di trading a nuovi livelli con la sua strategia innovativa e dinamica della zona di breakout. Quantum Breakout Indicator ti fornirà frecce di segnalazione sulle zone di breakout con 5 zone target
RelicusRoad Pro MT5
Relicus LLC
4.82 (22)
Ora $ 147 (aumentando a $ 499 dopo alcuni aggiornamenti) - account illimitati (PC o MAC) Manuale utente di RelicusRoad + Video di formazione + Accesso al gruppo Discord privato + Stato VIP UN NUOVO MODO DI GUARDARE IL MERCATO RelicusRoad è l'indicatore di trading più potente al mondo per forex, futures, criptovalute, azioni e indici, fornendo ai trader tutte le informazioni e gli strumenti di cui hanno bisogno per rimanere redditizi. Forniamo analisi tecniche e piani di trading per aiutar
TPSproTREND PrO MT5
Roman Podpora
5 (6)
TPSpro TRENDPRO  - is a trend indicator that automatically analyzes the market and provides information about the trend and each of its changes, as well as giving signals for entering trades without redrawing! The indicator uses each candle, analyzing them separately. referring to different impulses - up or down impulse. Exact entry points into transactions for currencies, crypto, metals, stocks, indices!  -  Version MT4                  DETAILED DESCRIPTION        /       TRADING SETUPS       
Innanzitutto, vale la pena sottolineare che questo Strumento di Trading è un Indicatore Non-Ridipingente, Non-Ridisegnante e Non-Laggante, il che lo rende ideale per il trading professionale. Corso online, manuale utente e demo. L'Indicatore Smart Price Action Concepts è uno strumento molto potente sia per i nuovi che per i trader esperti. Racchiude più di 20 utili indicatori in uno solo, combinando idee di trading avanzate come l'Analisi del Trader del Circolo Interno e le Strategie di Trad
FX Power MT5 NG
Daniel Stein
5 (5)
Ricevi il tuo aggiornamento quotidiano sul mercato con dettagli e schermate tramite il nostro Morning Briefing qui su mql5 e su Telegram ! FX Power MT5 NG è la nuova generazione del nostro popolare misuratore di forza delle valute, FX Power. Cosa offre questo misuratore di forza di nuova generazione? Tutto ciò che avete amato dell'FX Power originale IN PIÙ Analisi della forza di ORO/XAU Risultati di calcolo ancora più precisi Periodi di analisi configurabili individualmente Limite di calcolo pe
A key element in trading is zones or levels from which decisions to buy or sell a trading instrument are made. Despite attempts by major players to conceal their presence in the market, they inevitably leave traces. Our task was to learn how to identify these traces and interpret them correctly. Reversal First Impulse levels (RFI)   -  Version MT4                  INSTRUCTIONS                 RUS                 ENG                         R ecommended to use with an indicator   -  TREND PRO  
Advanced Supply Demand MT5
Bernhard Schweigert
4.53 (15)
La migliore soluzione per qualsiasi principiante o trader esperto! Questo indicatore è uno strumento di trading unico, di alta qualità e conveniente perché abbiamo incorporato una serie di funzionalità proprietarie e una nuova formula. Con questo aggiornamento, sarai in grado di mostrare fusi orari doppi. Non solo potrai mostrare una TF più alta, ma anche entrambe, la TF del grafico, PIÙ la TF più alta: SHOWING NESTED ZONES. Tutti i trader di domanda di offerta lo adoreranno. :) Informazioni imp
Quantum Heiken Ashi PRO MT5
Bogdan Ion Puscasu
4.5 (8)
Ti presentiamo   Quantum Heiken Ashi PRO Progettate per fornire informazioni chiare sulle tendenze del mercato, le candele Heiken Ashi sono rinomate per la loro capacità di filtrare il rumore ed eliminare i falsi segnali. Dì addio alle confuse fluttuazioni dei prezzi e dai il benvenuto a una rappresentazione grafica più fluida e affidabile. Ciò che rende il Quantum Heiken Ashi PRO davvero unico è la sua formula innovativa, che trasforma i dati tradizionali delle candele in barre colorate di faci
This is arguably the most complete harmonic price formation auto-recognition indicator you can find for the MetaTrader Platform. It detects 19 different patterns, takes fibonacci projections as seriously as you do, displays the Potential Reversal Zone (PRZ) and finds suitable stop-loss and take-profit levels. [ Installation Guide | Update Guide | Troubleshooting | FAQ | All Products ] It detects 19 different harmonic price formations It plots primary, derived and complementary Fibonacci p
Gartley Hunter Multi
Siarhei Vashchylka
5 (6)
Gartley Hunter Multi - An indicator for searching for harmonic patterns simultaneously on dozens of trading instruments and on all classic timeframes: (m1, m5, m15, m30, H1, H4, D1, Wk, Mn). Manual (Be sure to read before purchasing) | Version for MT4 Advantages 1. Patterns: Gartley, Butterfly, Shark, Crab. Bat, Alternate Bat, Deep Crab, Cypher 2. Simultaneous search for patterns on dozens of trading instruments and on all classic timeframes 3. Search for patterns of all possible sizes. Fr
MetaForecast M5
Vahidreza Heidar Gholami
5 (2)
MetaForecast predice e visualizza il futuro di qualsiasi mercato basandosi sull'armonia dei dati dei prezzi. Sebbene il mercato non sia sempre prevedibile, se esiste un modello nei prezzi, MetaForecast può prevedere il futuro con la massima precisione possibile. Rispetto ad altri prodotti simili, MetaForecast può generare risultati più accurati analizzando le tendenze di mercato. Parametri di input Past size (Dimensione passata) Specifica il numero di barre che MetaForecast utilizza per creare
Top indicator for MT5   providing accurate signals to enter a trade without repainting! It can be applied to any financial assets:   forex, cryptocurrencies, metals, stocks, indices .  Watch  the video  (6:22) with an example of processing only one signal that paid off the indicator! MT4 version is here It will provide pretty accurate trading signals and tell you when it's best to open a trade and close it. Most traders improve their trading results during the first trading week with the help of
Golden Gate Algo MT5
James David Lane
4 (6)
40% DI SCONTO PER NATALE! AUMENTO DEL PREZZO A $250 IL 1 GENNAIO! Presentiamo GoldenGate Entries: una soluzione di trading all'avanguardia! Scopri un approccio rivoluzionario al trading con GoldenGate Entries (GGE), un indicatore avanzato progettato per migliorare la tua esperienza di trading. GGE offre un set completo di funzionalità per fornire agli utenti precisione e fiducia nelle loro decisioni di trading. Coppie: Qualsiasi (FX - Materie prime - Azioni - Azioni - Cripto) TimeFrame
Good day! I present to you a trading technical indicator for Deriv broker synthetic indices. This indicator ONLY works with the following indices: Boom 300 Index Boom 500 Index Boom 1000 Index Crash 300 Index Crash 500 Index Crash 1000 Index The indicator was created to give signals to open medium-term trades in the direction of Spikes. But you can open trades in the opposite direction to Spikes, at your own risk. Trade only on M1. Other TFs do not guarantee the correct operation of the indic
FxaccurateLS
Shiv Raj Kumawat
WHY IS OUR FXACCCURATE LS MT5 THE PROFITABLE ? PROTECT YOUR CAPITAL WITH RISK MANAGEMENT Gives entry, stop and target levels from time to time. It finds Trading opportunities by analyzing what the price is doing during established trends. POWERFUL INDICATOR FOR A RELIABLE STRATEGIES We have made these indicators with a lot of years of hard work. It is made at a very advanced level. Established trends provide dozens of trading opportunities, but most trend indicators completely ignore them!
La soluzione migliore per ogni principiante o trader esperto! Questo indicatore è uno strumento di trading unico, di alta qualità e conveniente perché abbiamo incorporato una serie di caratteristiche proprietarie e una formula segreta. Con un solo grafico fornisce avvisi per tutte le 28 coppie di valute. Immaginate come migliorerà il vostro trading perché sarete in grado di individuare l'esatto punto di innesco di una nuova tendenza o opportunità di scalping! Costruito su nuovi algoritmi so
Volume by Price MT5
Brian Collard
5 (3)
The Volume by Price Indicator for MetaTrader 5 features Volume Profile and Market Profile TPO (Time Price Opportunity). Get valuable insights out of currencies, equities and commodities data. Gain an edge trading financial markets. Volume and TPO histogram bar and line charts. Volume Footprint charts. TPO letter and block marker charts including split structures. Versatile segmentation and compositing methods. Static, dynamic and flexible ranges with relative and/or absolute visualizations. Lay
Blahtech Supply Demand MT5
Blahtech Limited
4.57 (14)
Was: $299  Now: $99   Supply Demand uses previous price action to identify potential imbalances between buyers and sellers. The key is to identify the better odds zones, not just the untouched ones. Blahtech Supply Demand indicator delivers functionality previously unavailable on any trading platform. This 4-in-1 indicator not only highlights the higher probability zones using a multi-criteria strength engine, but also combines it with multi-timeframe trend analysis, previously confirmed swings
Wolfe Waves are naturally occurring trading patterns present in all financial markets and represent a fight towards an equilibrium price. These patterns can develop over short and long-term time frames and are one of the most reliable predictive reversal patterns in existence, normally preceding strong and long price movements. [ Installation Guide | Update Guide | Troubleshooting | FAQ | All Products ] Clear trading signals Amazingly easy to trade Customizable colors and sizes Implements perfo
XQ Indicator MetaTrader 5
Marzena Maria Szmit
5 (1)
Step into the realm of Forex trading with confidence and precision using XQ, a cutting-edge Forex indicator designed to elevate your trading game to unprecedented heights. Whether you're a seasoned trader or just stepping into the world of currency exchange, XQ Forex Indicator empowers you with the insights and signals needed to make informed trading decisions. The signal conditions are a combination of three indicators, and XQ Forex Indicator only display  medium and long-term trends . The ind
The iPump indicator is a versatile indicator  that combines the advantages of three categories of indicators. simultaneous trend detection on several Timeframes defining zones of resistance and support determination of overbought and oversold zones Indicator functions: Defining a trend This function will be necessary for all traders who want to objectively assess the current market direction and avoid subjectivity. It will be clear and intuitive. Determination of support and resistance levels U
Strong Support mt5
Vasiliy Strukov
5 (9)
I livelli di supporto e resistenza sono stati a lungo uno strumento potente per l'analisi del mercato. L'indicatore di supporto forte costruisce livelli di supporto ai minimi di prezzo locali e livelli di resistenza ai massimi di prezzo locali.  Gli altri miei sviluppi possono essere visualizzati qui Si consiglia di utilizzare insieme a un indicatore di tendenza, ad esempio, Gold Stuff : ciò consentirà di negoziare sulla tendenza e allo stesso tempo determinare le zone di consolidamento o i
Royal Scalping Indicator M5
Vahidreza Heidar Gholami
5 (8)
My products are currently 50% off. Explore them and build your own strategy. Royal Scalping Indicator is an advanced price adaptive indicator designed to generate high-quality trading signals. Built-in multi-timeframe and multi-currency capabilities make it even more powerful to have configurations based on different symbols and timeframes. This indicator is perfect for scalp trades as well as swing trades. Royal Scalping is not just an indicator, but a trading strategy itself. Features Price A
TrendMaestro5
Stefano Frisetti
nota: questo indicatore e' per METATRADER5, se vuoi la versione per  METATRADER4 questo e' il link:   https://www.mql5.com/it/market/product/108106 TRENDMAESTRO ver 2.4 TRENDMAESTRO   riconosce un nuovo TREND sul nascere, non sbaglia mai. La sicurezza di identificare un nuovo TREND non ha prezzo. DESCRIZIONE TRENDMAESTRO identifica un nuovo TREND sul nascere, questo indicatore prende in esame la volatilita' i volumi ed il momentum per identificare il momento in cui c'e' un'esplosione di uno
Stargogs Spike Catcher
Lorenzo Edward Beukes
4.5 (8)
Stargogs Spike Catcher V3.12 This Indicator is Developed To milk the BOOM and CRASH indices . Send me Message if you need any help with the indicator.  CHECK OUT THE STARGOGS SPIKE CATCHER EA/ROBOT V3: CLICK HERE ALSO CHECK OUT SECOND TO NONEFX SPIKE CATCHER:   CLICK HERE STARGOGS SPIKE CATCHER V3.12 WHATS NEW! Brand New Strategy. This is the Indicator you need for 2023. The Indicator Gives you an Entry at a time when conditions are met enter on every arrow and exit when it gives an X. New Tren
Trend Scanner mt5 GS
Vasiliy Strukov
4.93 (15)
Trend Scanner scansiona le tendenze del mercato da Multi-Simboli e Multi-Time frame e lo visualizza su un pannello mobile sul grafico che utilizza l'indicatore di roba Gold per l'analisi Le funzionalità includono avvisi ed e-mail, nonché notifiche push. Il trader può selezionare più coppie di sua scelta per la visualizzazione. Trend Scanner è un ottimo strumento per vedere la direzione del trend e può essere utilizzato per il trading manuale o il trading EA consentendo solo di acquistare o vend
Altri dall’autore
L'indicatore dell'oscillatore Obie fluttua sopra e sotto il livello zero. Al di sopra del livello zero, si dice che il prezzo sia rialzista e i trader cercano opportunità di acquisto. Al di sotto del livello zero, si dice che il prezzo sia ribassista e i trader cercano opportunità di vendita. Si consiglia di utilizzare questo indicatore insieme a un indicatore che segue la tendenza. Questo indicatore funziona per scalping, day trading, swing trading e trading di posizione. I segnali pro
Introduzione a Obie Sniper L'indicatore Obie Sniper fornisce i migliori punti di entrata e di uscita. La semplicità dell'indicatore Obie Sniper MT4 semplifica l'applicazione e il trading dei segnali forex con successo. Questo indicatore funziona bene per gli scalper che utilizzano i grafici M5 e M15. Allo stesso tempo, gli swing trader possono utilizzare i grafici H1 e H4 per identificare la tendenza e negoziarli con successo. Questo indicatore è più adatto ai nuovi trader forex. Perché aiuta
L'indicatore Obie Scalper Alerts per MT5 è un eccellente strumento di segnali rapidi di acquisto/vendita per scalper e day trader. I segnali sono molto facili da capire e appaiono nella finestra del grafico principale come punti colorati blu e rossi. Segnale di acquisto e vendita: Un punto blu è un segnale di acquisto. Un punto rosso è un segnale di vendita. Sentiti libero di sperimentare le diverse impostazioni e i valori di input dell'indicatore. L'indicatore funziona ugualmente bene su
Filtro:
Nessuna recensione
Rispondi alla recensione