• Panoramica
  • Recensioni
  • Commenti

KT Price Border MT4

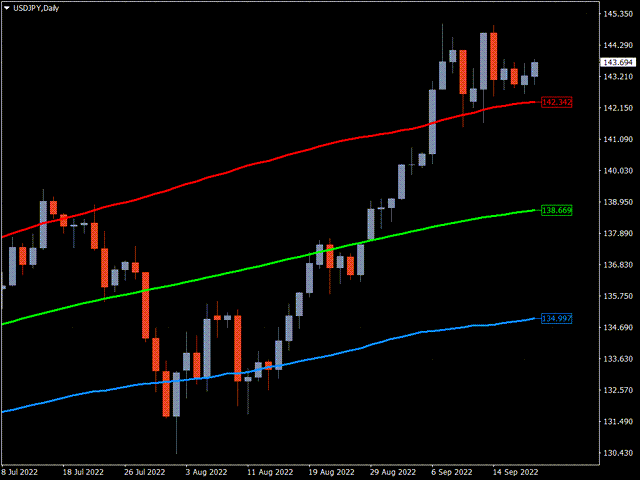
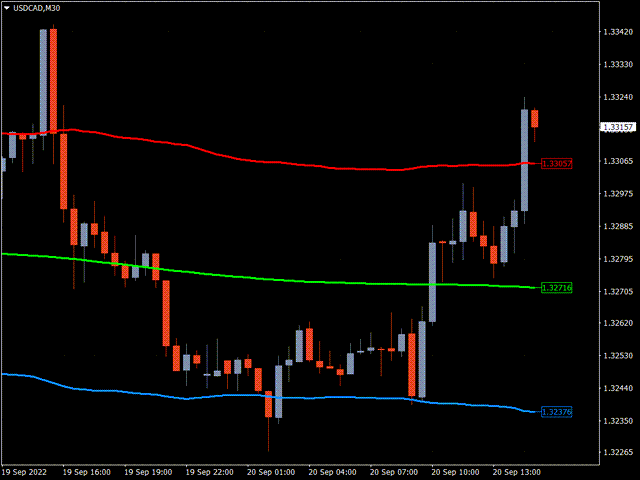
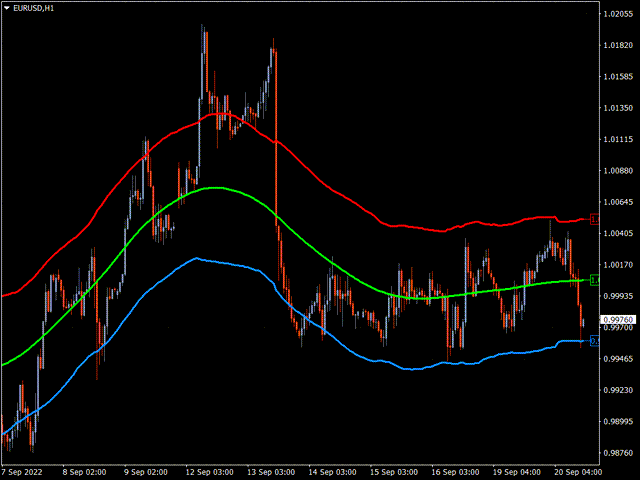
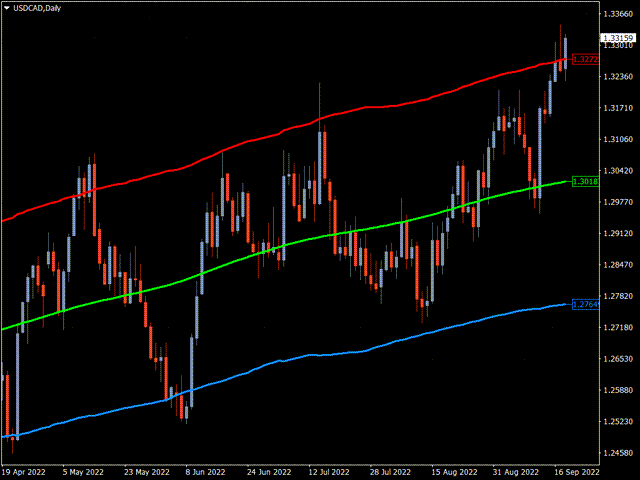
KT Price Border creates a three-band price envelope that identifies potential swing high and low areas in the market. These levels can also be used as dynamic market support and resistance.

The mid-band can also be used to identify the trend direction. As a result, it also functions as a trend-following indicator. In addition, its ease of use and more straightforward conveyance of trade signals significantly benefit new traders.

Features

  • It works well on most of the Forex currency pairs.
  • It works on both lower and higher time frames.
  • The indicator is suitable for scalping, day trading, and swing trading.
  • The price bands never repaint.
  • Support both trend and counter-trend trading strategies.
  • It can send alerts when the price crosses the price bands.
  • The price bands can also be used as dynamic support and resistance levels. 

Understanding the Price Border Concept

The indicator functions similarly to Bollinger Bands. Its bottom band symbolizes the market's oversold situation and is dynamic market support.

The upper band level represents the market's overbought position and dynamic resistance. Finally, as a trend determinant, the mid-band has been included.

Price closing above its level indicates that the market is still in an uptrend, while the reverse scenario suggests that the market's bearish trend still holds.


Pro-Tip

To trade with the KT Price Border, feel free to employ your preferred trade entry, stop loss, and take the profit method.

As with any indicator, trade follows the broader trend and initially practices on a demo account until you completely understand it. Remember that even the most exemplary trading indicator cannot guarantee a 100%-win rate over long periods.

Prodotti consigliati
The Strong Volume Trend  MT4 indicator is a powerful tool designed to help traders identify and capitalize on significant volume trends in the financial markets. With its advanced algorithm, this indicator accurately detects the strength and direction of volume movements, allowing traders to make informed trading decisions. Features: Volume Strength Analysis: The indicator analyzes the volume data and identifies strong volume trends, helping traders spot potential market reversals, breakouts, or
The Best Choice compra y venta
Sandro Israel Hernandez Zamora
¿Has escuchado decir que la tendencia es tu amiga? pues nada es mas cierto en el mundo del trading. Este indicador analiza las tendencias y su fuerza para que puedas aprovecharlas y utilizamos un conjunto de indicadores como RSI, %W, MACD y EMAS para analizar el mercado y sus movimientos, por lo que podrás mantener tu gráfico limpio sabiendo que todos estos indicadores los tienes en uno solo. Este, como cualquier indicador, no representa una certeza de compra o venta definitiva, por lo siempre r
This is a simple arrow system based on Engulfing Candlestick Pattern. It gives you alerts on your smartphone when there is an engulfing candlestick pattern happens. Which type of alerts available? 1. It paints on chart Up/Down Arrows. 2. Popup message and sound alert in trading terminal window. 3. Push notification or Alert on your Android and IOS mobile phones (requires MT4 or MT5 app installed!) *Note: Use it on higher timeframes like H4 (4 hours), D1 (1 Day) then find trade opportunities on s
Signal Arrows is an indicator that generates trade arrows. It generates trade arrows with its own algorithm. These arrows give buying and selling signals.  Can be used in all pairs. Sends a signal to the user with the alert feature. The indicator certainly does not repaint. Trade rules Enter the signal when the buy signal arrives. In order to exit from the transaction, an opposite signal must be received. It is absolutely necessary to close the operation when an opposite signal is received. Th
Cool Monkey
Sze Yu Ma
4 (1)
Cool Monkey is a fully automatic, highly customizable EA based on Volatility, MACD and RSI to select optimal entry points. It uses a specialized grid structure  to achieve a high winning rate with improved safety. All tests are performed with 99.90% tick data, with simulated spread, execution delay, commission and swap. Trading and optimization experience required if you wish to optimize it. Limited time to buy Cool Monkey for USD30 ! Recommendations: Default settings works on EURUSD M1 chart Cu
Fibonacci colores
Carlos Augusto Cedeno Rocha
Fibonacci por color en niveles para aplicar estrategia profesional inicialmente se coloca en el punto mas alto del dia y mas bajo con esto es para ubicar operaciones a una distancia exacta con lo cual se busca generar ganancias residuales internas en el mismo dia con esto las lineas fusias es para colocar las entrdas sell y las lineas verdes amarillas van los buy
About Scanner: It will show you the Higher/Lower Highs and Lows of zigzag price. Use it to keep track of best ongoing trends and price ranges. Detailed blog post with free 2 weeks demo (till Sep-2,2022): https://www.mql5.com/en/blogs/post/750232 Symbols: HH: Higher Highs HL: Higher Lows When price makes higher and higher Highs or higher Lows: It will count Zigzag in reverse and find total number of last "Higher Highs" and "Higher Lows" or "Lower Lows" and "Lower Highs". LL: Lower Lows
Description: The indicator predicts, with a specific probability, if the actual candlestick range will expand or contract compared to the range of a previous candle. Furthermore, the indicator shows the possible high or low of the actual candle, based on trend direction. (Recommended for Daily, Weekly, or Monthly timeframes). KEY LINKS:   Indicator Manual  –  How to Install  –  Frequent Questions  -  All Products  How to use the indicator: Determines, with a certain probability, if there will
OVERVIEW The Vector Candle Zones Render indicator automatically renders boxes for vector candle zones that are yet to be recovered. The indicator is an implementation of an existing PVA candles indicator. Combine it with PVSRA and MarketMakerMethod strategy. FEATURES Software: MetaTrader4 - MT4 - 600+ build Timeframes: Multi-Timeframe Markets: Forex/Cryptos/Energies/Bonds/Metals/Indices/Futures/Commodities Customizable style parameters: Change Color style Chan
KT Candlestick Patterns Scanner is a Multi-Symbol and Multi-Timeframe scanner that fetches and shows various candlestick patterns on 28 currency pairs and 9 time-frames concurrently . The scanner finds the candlestick patterns by loading the KT Candlestick Patterns indicator as a resource in the background. Features The scanner can find the candlestick patterns on 252* combinations of symbols and time-frames from a single chart. Open the signal's chart loaded with a predefined template with
TMoney OrderblockDay
Moises Orlando Urbina Sojo
The indicator is triggered at the start of each trading day and detects both bullish and bearish ORDERBLOCK potentials. These levels are of high operational probability, being able to use a minimum ratio of 3 to 1 to maximize profits. It is recommended to use TimeFrame M5 to M30 for a proper display and consider pending orders at the OB levels of the chart and place the SL up to a maximum of 20 pips from the entry price. Submit the indicator to Backtesting to become familiar with its performa
Supply and Demand Indicator + FREE Currency Strength Meter ADD-ON Looking for a powerful tool that can help you identify the most reactive zones in the forex market? Our supply and demand indicator for MetaTrader 4 and 5 is exactly what you need. With its advanced algorithms and real-time analysis, this indicator helps traders of all experience levels make informed trading decisions. The supply and demand indicator is a cutting-edge tool that helps traders identify areas where buyers and seller
Accumulated Rsi
Muhammed Emin Ugur
Introducing the Accumulated RSI,  your ultimate tool for precise trend identification and momentum analysis in the world of Forex and financial markets. This cutting-edge MetaTrader 4 (MT4) indicator, designed for traders seeking unparalleled insight and accuracy, empowers you to make well-informed trading decisions like never before. Features Accurate Trend Detection: The Accumulated RSI utilizes the Relative Strength Index (RSI) in an innovative way to pinpoint the prevailing market trends wit
Presentazione del   Bollinger Band Volume Breakout Detector   , un potente indicatore tecnico progettato per migliorare la popolare   strategia di Bollinger Band Breakout   . Questo indicatore porta il trend following al livello successivo incorporando i dati sul volume, riducendo efficacemente i falsi segnali. Aderendo al principio "il volume conferma il prezzo", questo strumento consente ai trader di identificare i breakout dei prezzi accompagnati da aumenti significativi del volume, garantend
Limitless MT4
Dmitriy Kashevich
Limitless MT4 is a universal indicator suitable for every beginner and experienced trader. works on all currency pairs, cryptocurrencies, raw stocks Limitless MT4 - already configured and does not require additional configuration And now the main thing Why Limitless MT4? 1 complete lack of redrawing 2 two years of testing by the best specialists in trading 3 the accuracy of correct signals exceeds 80% 4 performed well in trading during news releases Trading rules 1 buy signa
KT Bullish Bearish MT4
KEENBASE SOFTWARE SOLUTIONS
KT Bullish Bearish shows the bullish/bearish regime of the market in the form of a colored histogram representing both of the market states alternately. Bull Market (Blue Histogram): A bull market indicates an uptrend when an instrument price rises over a continued period like days, months, or years. Bear Market (Red Histogram): A bear market indicates a downtrend when an instrument price rises over a continued period like days, months, or years. Applications It prevents trading against the
Questo indicatore traccia fino a 6 livelli che possono essere abilitati/disabilitati per rendere il grafico più pulito secondo il requisito del trader Questi 6 livelli sono in 2 set: Alto e Basso Per ogni set, è possibile selezionare un periodo di tempo diverso Si basa sulla strategia di inversione di precedenti alti e bassi, poiché si ritiene che il prezzo di solito mostri un rifiuto in un intervallo di tempo più breve come 5 minuti quando il prezzo raggiunge il massimo giornaliero, sett
Classical Divergence , Hidden Divergence both available . Enter a trade with the arrow on lower indicator. Nexus Divergence Pro is the best Divergence tool one can imagine with trade signals you will experience the super functionality. Needless to say how accurate divergence trading can be . Do your research on google you will understand its a standalone super accurate strategy.
This indicator draws Horizontal Support and Resistance automatically. It works with any symbol and any timeframe. Stronger Support Lines are displayed in thicker green horizontal lines. In the same way, Stronger Resistance lines are displayed with thicker red lines. Change the timeframe to display the Support and Resistance Lines of various timeframes.
EForex Fibo Channel
Veridiana Adorno Kendrick
5 (1)
D1 Free Fibo Channels with support and resistences... Become a constantly profitable 5-star forex trader!  We offer a few indicators to support you understand and analyse the market! With our strategies you will improve your trading system and bacome an expert... We have indicators for trend direction, market direction and others.. for multi-time frames and that covers all majors or your favorite trading symbols! Some of them offer a customizable calculation parameters... or Graph features
FREE
This indictor is developed to help traders identify pivot levels in market . Some people also call it support and resistance levels or zones. We have finally publishing the most advanced pivot indicator in mql5 market because it is developed using accurate pivot zones only  . Remember always use bigger timeframes to get strong pivot levels. It will help you reversal trading. Visit our website from here
A useful scanner/dashboard that shows the RSI values for multiple symbols and time-frames. It can be easily hidden/displayed with a simple click on the scanner man top left of the dashboard. You can input upper and lower RSI values and the colours can be set to show when above/below these values. The default values are 70 and 30. There are also input colours for when the RSI is above or below 50 (but not exceeding the upper/lower levels Symbols and time-frames are input separated by comma
Candle Alert
Sergio D. Rocha
5 (1)
The Candle Alert indicator recognizes 27 main candlestick patterns. Indecision Early Reversal Decisive Reversal Others Doji Hammer Bullish Engulfing Bullish Harami Grave Stone Shooting Star Bearish Engulfing Bearish Harami Dragon Fly Pricing Morning Star Bullish Yin Yang Spinning top Dark Cloud Cover Evening Star Bearish Yin Yang Spinning Bottom Doji Close Low 3 White Soldiers Hanging Man Doji Close High 3 Black Crows Inverted Hammer   Tweezers Top Bullish Inside Break Out Bar     Tweezers B
Chart Analyzer
Innovicient Limited
The Chart Analyzer is an MT4 indicator that provides visual arrow signals without redrawing them. In addition, we have included trendlines to validate your entries. This indicator has been fine-tuned to work with all timeframes and instruments.  The Chart Analyzer has a number of advantages Does not fade or remove arrows when drawn Sends both email and phone alerts. It is light on computer resources Easy to install. Default setting works just fine.  If price opens above the trendline, open
Market Hour Indicator is one the most useful indicators for the traders who trade in different markets. The indicator highlights the area in the chart during which a particular market is open. It operates on four different markets i.e. New York Stock Exchange, Australian Stock Exchange, Tokyo Stock Exchange and London Stock Exchange. The indicator is intended for use on M1, M5, M15, M30 and H1 time frames only. Input Parameters NYSEMarket: Enable/Disable for NYSE market NYSEMarketOpeningTime:
Break-even Price indicator Shows Break even price tag for multiple positions on chart Multiple Levels for custom Profit/Loss Percentages of Balance, and Amounts in Deposit Currency Works for a specific Magic Number trades or all trades on chart Calculation includes Spread, Commissions and Swaps How to use The basic use of the indicator is to calculate the "break-even price level" for multiple mixed positions for the same symbol and show it on the chart. In addition to this, the indicator will
Arrows appear after Reversal-Pattern and when the confirmation-candle reaches its value, it won't disappear (no repaint). but with fix settings no additional settings necessary Entry : immediately after arrow Stop loss : a few pips above the high of the arrow - candle / below the low of the arrow - candle Take Profit : at least the next candle / move to break even after candle closed / trail the SL works on : Major Forex-pairs / M15 and higher time-frames The Value of the  confirmation-candle =>
Smart Ai Levels  Accumulation & Distribution indicator Smart Ai Levels are Ai controlled indicator which is based on Wyckoff Price cycle theory . It automatically scans the Accumulation & Distribution phases on chart and Ai draws the possible areas before Mark up and Mark down which acts as hot zones and can be traded with confirmation to catch those big price movements . It's a great tool for both Reversal and Breakout Trades suitable to all Trading Styles such as Scalping - Intraday - Swing 
KT Horizontal Lines MT4
KEENBASE SOFTWARE SOLUTIONS
In MetaTrader, plotting multiple   horizontal lines   and then tracking their respective price levels can be a hassle. This indicator automatically plots multiple horizontal lines at equal intervals for setting price alerts, plotting support and resistance levels, and other manual purposes. This indicator is suitable for Forex traders who are new and looking for chances to make quick profits from buying and selling. Horizontal lines can help traders find possible areas to start trading when the
To get access to MT5 version please click here . This is the exact conversion from TradingView: "RedK_Supply/Demand Volume Viewer v3.0" by "RedKTrader" This is a light-load processing and non-repaint indicator. All input options are available.  Buffers are available for processing in EAs. You can message in private chat for further changes you need. Thanks for downloading
Gli utenti di questo prodotto hanno anche acquistato
Gann Made Easy
Oleg Rodin
4.92 (52)
Gann Made Easy è un sistema di trading Forex professionale e facile da usare che si basa sui migliori principi del trading utilizzando la teoria di mr. WD Gann. L'indicatore fornisce segnali ACQUISTA e VENDI accurati, inclusi i livelli di Stop Loss e Take Profit. Puoi fare trading anche in movimento utilizzando le notifiche PUSH. Vi prego di contattarmi dopo l'acquisto! Condividerò i miei consigli di trading con te e fantastici indicatori bonus gratuitamente! Probabilmente hai già sentito parlar
ATTUALMENTE SCONTATO DEL 26% La soluzione migliore per ogni principiante o trader esperto! Questo indicatore è uno strumento di trading unico, di alta qualità e conveniente perché abbiamo incorporato una serie di caratteristiche proprietarie e una nuova formula. Con un solo grafico è possibile leggere la forza delle valute per 28 coppie Forex! Immaginate come migliorerà il vostro trading perché sarete in grado di individuare l'esatto punto di innesco di una nuova tendenza o di un'opportunit
Atomic Analyst
Issam Kassas
5 (2)
Innanzitutto, vale la pena sottolineare che questo indicatore di trading non è repaint, non è ridisegno e non presenta ritardi, il che lo rende ideale sia per il trading manuale che per quello automatico. L'Analista Atomico è un indicatore di azione del prezzo PA che utilizza la forza e il momentum del prezzo per trovare un miglior vantaggio sul mercato. Dotato di filtri avanzati che aiutano a rimuovere rumori e segnali falsi, e aumentare il potenziale di trading. Utilizzando più strati di in
TPSproTREND PrO
Roman Podpora
5 (15)
TPSpro TRENDPRO  - is a trend indicator that automatically analyzes the market and provides information about the trend and each of its changes, as well as giving signals for entering trades without redrawing! The indicator uses each candle, analyzing them separately. referring to different impulses - up or down impulse. Exact entry points into transactions for currencies, crypto, metals, stocks, indices!  -  Version MT5               DETAILED DESCRIPTION        /       TRADING SETUPS           
TPSpro RFI Levels
Roman Podpora
5 (13)
A key element in trading is zones or levels from which decisions to buy or sell a trading instrument are made. Despite attempts by major players to conceal their presence in the market, they inevitably leave traces. Our task was to learn how to identify these traces and interpret them correctly. Reversal First Impulse levels (RFI)   -  Version MT5                INSTRUCTIONS                 RUS                 ENG                                       R ecommended to use with an indicator   -  
Innanzitutto, vale la pena sottolineare che questo Strumento di Trading è un Indicatore Non-Ridipingente, Non-Ridisegnante e Non-Laggante, il che lo rende ideale per il trading professionale. L'Indicatore Smart Price Action Concepts è uno strumento molto potente sia per i nuovi che per i trader esperti. Racchiude più di 20 utili indicatori in uno solo, combinando idee di trading avanzate come l'Analisi del Trader del Circolo Interno e le Strategie di Trading dei Concetti del Denaro Intelligen
Scalper Vault
Oleg Rodin
5 (27)
Scalper Vault è un sistema di scalping professionale che ti fornisce tutto il necessario per scalping di successo. Questo indicatore è un sistema di trading completo che può essere utilizzato dai trader di forex e opzioni binarie. L'intervallo di tempo consigliato è M5. Il sistema fornisce segnali di freccia accurati nella direzione della tendenza. Ti fornisce anche i segnali più alti e più bassi e i livelli di mercato di Gann. Gli indicatori forniscono tutti i tipi di avvisi, comprese le notifi
Attualmente 20% di sconto! La soluzione migliore per ogni principiante o trader esperto! Questo software per cruscotti funziona su 28 coppie di valute. Si basa su 2 dei nostri indicatori principali (Advanced Currency Strength 28 e Advanced Currency Impulse). Offre un'ottima panoramica dell'intero mercato Forex. Mostra i valori di forza delle valute avanzate, la velocità di movimento delle valute e i segnali per 28 coppie Forex in tutti i (9) timeframe. Immaginate come migliorerà il vostro t
Scopri il segreto per il trading Forex di successo con il nostro indicatore MT4 personalizzato! Ti sei mai chiesto come raggiungere il successo nel mercato Forex, guadagnando costantemente profitti minimizzando il rischio? Ecco la risposta che hai cercato! Permettici di presentare il nostro indicatore MT4 proprietario che rivoluzionerà il tuo approccio al trading. Versatilità unica Il nostro indicatore è appositamente progettato per gli utenti che preferiscono le formazioni di candele Ren
Market Reversal Alerts
LEE SAMSON
4.21 (121)
Il profitto dalla struttura del mercato cambia quando il prezzo si inverte e si ritira. L'indicatore di avviso di inversione della struttura del mercato identifica quando una tendenza o un movimento di prezzo si sta avvicinando all'esaurimento e pronto a invertire. Ti avvisa dei cambiamenti nella struttura del mercato che in genere si verificano quando stanno per verificarsi un'inversione o un forte pullback. L'indicatore identifica inizialmente i breakout e lo slancio del prezzo, ogni volta
Trend Screener
STE S.S.COMPANY
4.83 (86)
Indicatore di tendenza, soluzione unica rivoluzionaria per il trading di tendenze e il filtraggio con tutte le importanti funzionalità di tendenza integrate in un unico strumento! È un indicatore multi-timeframe e multi-valuta al 100% non ridipingibile che può essere utilizzato su tutti i simboli/strumenti: forex, materie prime, criptovalute, indici e azioni. Trend Screener è un indicatore di tendenza che segue un indicatore efficiente che fornisce segnali di tendenza a freccia con punti nel gra
FX Power MT4 NG
Daniel Stein
5 (9)
Ricevi il tuo aggiornamento quotidiano sul mercato con dettagli e schermate tramite il nostro Morning Briefing qui su mql5 e su Telegram ! FX Power MT4 NG è la nuova generazione del nostro popolare misuratore di forza delle valute, FX Power. Cosa offre questo misuratore di forza di nuova generazione? Tutto ciò che avete amato dell'FX Power originale IN PIÙ Analisi della forza di ORO/XAU Risultati di calcolo ancora più precisi Periodi di analisi configurabili individualmente Limite di calcolo pe
Presentazione       Quantum Trend Sniper Indicator   , l'innovativo indicatore MQL5 che sta trasformando il modo in cui identifichi e scambi le inversioni di tendenza! Sviluppato da un team di trader esperti con un'esperienza di trading di oltre 13 anni,       Indicatore Quantum Trend Sniper       è progettato per spingere il tuo viaggio di trading verso nuove vette con il suo modo innovativo di identificare le inversioni di tendenza con una precisione estremamente elevata. *** Acquista Quant
Break and Retest
Mohamed Hassan
5 (6)
‍You can visually backtest Break & Retest to see how it behaved in the past!     Manual guide:   Click here $59  for the first 25 copies ( 1  left)! Next price is $120 .  This Indicator only places quality trades when the market is really in your favor with a clear break and retest. Patience is key with this price action strategy! After many months of hard work and dedication, we are extremely proud to present you our  Break and Retest price action indicator created from scr
Scalper Inside PRO
Alexey Minkov
4.75 (55)
SALE NOW! Limited Time Offer! An exclusive indicator that utilizes an innovative algorithm to swiftly and accurately determine the market trend. The indicator automatically calculates opening, closing, and profit levels, providing detailed trading statistics. With these features, you can choose the most appropriate trading instrument for the current market conditions. Additionally, you can easily integrate your own arrow indicators into Scalper Inside Pro to quickly evaluate their statistics and
Currency Strength Wizard è un indicatore molto potente che ti fornisce una soluzione all-in-one per un trading di successo. L'indicatore calcola la potenza di questa o quella coppia forex utilizzando i dati di tutte le valute su più intervalli di tempo. Questi dati sono rappresentati in una forma di indice di valuta facile da usare e linee elettriche di valuta che puoi utilizzare per vedere il potere di questa o quella valuta. Tutto ciò di cui hai bisogno è collegare l'indicatore al grafico che
Quantum Breakout Indicator PRO
Bogdan Ion Puscasu
4.96 (26)
Presentazione       Quantum Breakout PRO   , l'innovativo indicatore MQL5 che sta trasformando il modo in cui scambi le zone di breakout! Sviluppato da un team di trader esperti con un'esperienza di trading di oltre 13 anni,   Quantum Breakout PRO   è progettato per spingere il tuo viaggio di trading a nuovi livelli con la sua strategia innovativa e dinamica della zona di breakout. Quantum Breakout Indicator ti fornirà frecce di segnalazione sulle zone di breakout con 5 zone target di prof
Presentazione dell'indicatore Miraculous Forex: Libera il potere del trading preciso Sei stanco di cercare il miglior indicatore Forex che fornisca risultati eccezionali su tutti i timeframe? Non cercare oltre! L'indicatore Miraculous Forex è qui per rivoluzionare la tua esperienza di trading e portare i tuoi profitti a nuove vette. Basato su tecnologia all'avanguardia e anni di sviluppo accurato, l'indicatore Miraculous Forex si distingue come l'apice di potenza e precisione nel mercato delle v
FX Volume
Daniel Stein
4.6 (35)
Ricevi il tuo aggiornamento quotidiano sul mercato con dettagli e schermate tramite il nostro Morning Briefing qui su mql5 e su Telegram ! FX Volume è il PRIMO e UNICO indicatore di volume che fornisce una visione REALE del sentiment del mercato dal punto di vista del broker. Fornisce informazioni straordinarie su come gli operatori di mercato istituzionali, come i broker, sono posizionati sul mercato Forex, molto più velocemente dei rapporti COT. Vedere queste informazioni direttamente sul vo
Price Action Entry Alerts
Stephen Sanjeeve Sahayam
5 (3)
Questo indicatore controlla ogni barra per la pressione di acquisto o vendita e identifica 4 tipi di modelli di candele con il volume più alto. Queste candele vengono quindi filtrate utilizzando diversi filtri lineari per mostrare segnali di acquisto o vendita. I segnali funzionano meglio, in combinazione con una direzione temporale più elevata e quando scambiati durante le ore ad alto volume. Tutti i filtri sono personalizzabili e funzionano in modo indipendente. Può visualizzare i segnali di
GOLD Impulse with Alert
Bernhard Schweigert
4.56 (9)
Questo indicatore è una super combinazione dei nostri 2 prodotti Advanced Currency IMPULSE with ALERT  +   Currency Strength Exotics . Funziona per tutti i time frame e mostra graficamente l'impulso di forza o debolezza per le 8 valute principali più un simbolo! Questo indicatore è specializzato nel mostrare l'accelerazione della forza delle valute per qualsiasi simbolo come oro, coppie esotiche, materie prime, indici o futures. Primo nel suo genere, qualsiasi simbolo può essere aggiunto
Advanced Supply Demand
Bernhard Schweigert
4.92 (310)
CURRENTLY 26% OFF !! Best Solution for any Newbie or Expert Trader! This indicator is a unique, high quality and affordable trading tool because we have incorporated a number of proprietary features and a new formula. With this update, you will be able to show double timeframe zones. You will not only be able to show a higher TF but to show both, the chart TF, PLUS the higher TF: SHOWING NESTED ZONES. All Supply Demand traders will love it. :) Important Information Revealed Maximize the potenti
PZ Harmonacci Patterns
PZ TRADING SLU
3.43 (7)
This is arguably the most complete harmonic price formation auto-recognition indicator you can find for the MetaTrader Platform. It detects 19 different patterns, takes fibonacci projections as seriously as you do, displays the Potential Reversal Zone (PRZ) and finds suitable stop-loss and take-profit levels. [ Installation Guide | Update Guide | Troubleshooting | FAQ | All Products ] It detects 19 different harmonic price formations It plots primary, derived and complementary Fibonacci pro
TrendMaestro
Stefano Frisetti
5 (2)
nota: questo indicatore e' per METATRADER4, se vuoi la versione per  METATRADER5 questo e' il link:  https://www.mql5.com/it/market/product/108123 TRENDMAESTRO riconosce un nuovo TREND sul nascere, non sbaglia mai. La sicurezza di identificare un nuovo TREND non ha prezzo. DESCRIZIONE TRENDMAESTRO identifica un nuovo TREND sul nascere, questo indicatore prende in esame la volatilita' i volumi ed il momentum per identificare il momento in cui c'e' un'esplosione di uno  opiu' di questi dati
TrendDecoder Premium
Christophe, Pa Trouillas
5 (3)
Identificare i range e le prossime mosse probabili   |  Ottenere i primi segnali e la forza delle tendenze   |  Ottenere uscite chiare prima dell'inversione   |  Individuare i livelli di Fibo che il prezzo testerà Indicatore non tracciante e non ritardato - ideale per il trading manuale e automatizzato - adatto a tutti gli asset e a tutte le unità temporali Offerta limitata nel tempo >>   50% OFF Dopo l'acquisto, contattatemi su questo canale  per le impostazioni personalizzate. Versione   MT5 :
Indicator : RealValueIndicator Description : RealValueIndicator is a powerful tool designed specifically for trading on the EURUSD pair. This indicator analyzes all EUR and USD pairs, calculates their real currency strength values, and displays them as a single realistic value to give you a head start on price. This indicator will tell you moves before they happen if you use it right. RealValueIndicator allows you to get a quick and accurate overview of the EURUSD currency pair tops and bottoms,
Disegna automaticamente i livelli di supporto e resistenza PIÙ i gap delle candele di propulsione sul vostro grafico, in modo da poter vedere dove il prezzo potrebbe dirigersi successivamente e/o potenzialmente invertire. Questo indicatore è stato progettato per essere utilizzato come parte della metodologia di trading di posizione insegnata sul mio sito web (The Market Structure Trader) e visualizza informazioni chiave per il targeting e le potenziali entrate. L'indicatore presenta 2 funzi
Innanzitutto, è importante sottolineare che questo sistema di trading è un indicatore non repainting, non redrawing e non lagging, il che lo rende ideale per il trading professionale. Il "Sistema di Trading di Supporto e Resistenza Intelligente" è un indicatore avanzato progettato per trader nuovi ed esperti. Permette ai trader di ottenere precisione e fiducia sul mercato forex. Questo sistema completo combina più di 7 strategie, 10 indicatori e varie approcci di trading, tra cui strategie di
Trend Forecasting
Mohamed Hassan
5 (15)
This indicator is unstoppable when combined with our other indicator called Katana. After purchase, send us a message and you could get Katana for FREE as a BONUS After purchase, send us a private message for your instructions.  MT5 version: click here 3 copies left available at $39. Next price is $99. Don't miss this great deal!  The Trend Forecasting indicator is a very unique & easy tool that is able to make prediction about future price movement based on the signals generated
ICT, SMC, SMART MONEY CONCEPTS, SMART MONEY, Smart Money Concept, Support and Resistance, Trend Analysis, Price Action, Market Structure, Order Blocks, BOS/CHoCH,   Breaker Blocks ,  Momentum Shift,   Supply&Demand Zone/Order Blocks , Strong Imbalance, HH/LL/HL/LH,    Fair Value Gap, FVG,  Premium  &   Discount   Zones, Fibonacci Retracement, OTE, Buy Side Liquidity, Sell Side Liquidity, BSL/SSL Taken, Equal Highs & Lows, MTF Dashboard, Multiple Time Frame, BigBar, HTF OB, HTF Market Structure, 
Altri dall’autore
KT Stoch Divergence MT5
KEENBASE SOFTWARE SOLUTIONS
Divergence is one of the vital signals that depicts the upcoming price reversal in the market. KT Stoch Divergence shows the regular and hidden divergences build between the price and stochastic oscillator. Limitations of KT Stoch Divergence Using the Stochastic divergence as a standalone entry signal can be risky. Every divergence can't be interpreted as a strong reversal signal. For better results, try to combine it with price action and trend direction. Features Marks regular and hidde
If you trade Forex, having detailed information about the currency strength and currency pairs correlation can take your trading to new heights. The correlation will help to cut your risk in half, and strength analysis will help to maximize the profits. This indicator provides a hybrid approach for selecting the most appropriate currency pairs using the strength analysis and currency pairs correlation. How to use the Currency Strength Analysis Suppose your trading strategy provides a buying o
KT Trend Magic MT5
KEENBASE SOFTWARE SOLUTIONS
KT Trend Magic shows the trend depiction on chart using the combination of market momentum and volatility. A smoothing coefficient is used to smooth out the noise from the signal.It can be used to find out the new entries or confirm the trades produced by other EA or indicator. Features Drag n drop MTF scanner which scans for the new signals across multiple time-frames. Find new entries in the trend direction. Improve the accuracy of other indicators when used in conjunction. Can be used as a
ACB Breakout Arrows
KEENBASE SOFTWARE SOLUTIONS
4.17 (35)
The ACB Breakout Arrows indicator provides a crucial entry signal in the market by detecting a special breakout pattern. The indicator constantly scans the chart for a settling momentum in one direction and provide the accurate entry signal right before the major move.  Get multi-symbol and multi-timeframe scanner from here - Scanner for ACB Breakout Arrows MT4 Key features Stoploss and Take Profit levels are provided by the indicator. Comes with a MTF Scanner dashboard which tracks the brea
KT Currency Strength and Correlation MT5
KEENBASE SOFTWARE SOLUTIONS
5 (1)
If you trade Forex, having detailed information about the currency strength and currency pairs correlation can take your trading to new heights. The correlation will help to cut your risk in half, and strength analysis will help to maximize the profits. This indicator provides a hybrid approach for selecting the most appropriate currency pairs using the strength analysis and currency pairs correlation. How to use the Currency Strength Analysis Suppose your trading strategy provides a buying o
ACB Breakout Arrows MT5
KEENBASE SOFTWARE SOLUTIONS
5 (1)
The ACB Breakout Arrows indicator provides a crucial entry signal in the market by detecting a special breakout pattern. The indicator constantly scans the chart for a settling momentum in one direction and provide the accurate entry signal right before the major move. Get multi-symbol and multi-timeframe scanner from here - Scanner for ACB Breakout Arrows MT 5 Key features Stoploss   and Take Profit levels are provided by the indicator. Comes with a MTF Scanner dashboard which tracks the br
KT Asian Breakout MT5
KEENBASE SOFTWARE SOLUTIONS
KT Asian Breakout carefully analyzes the range-bound market during the Asian session and then fires a long or short trade after doing some preassessment based on its inbuilt technical analysis module. The executed orders are closed within a day before the completion of the next day session. The inbuilt technical analysis module checks for the session range and compares it with the last 20 days price movement. If it finds any erratic price movement within the session, the orders are not execute
KT RSI Divergence Robot MT4
KEENBASE SOFTWARE SOLUTIONS
KT RSI Divergence robot is a 100% automated expert advisor that trades regular and hidden divergence built between the price and Relative Strength Index (RSI) oscillator. The divergence signals are fetched from our freely available RSI divergence indicator. Not every divergence ends up in a successful price reversal, that's why this ea combines the raw divergences signals with its inbuilt technical analysis module to exploit the price inefficiency that occurs after some selected divergence si
KT Ichimoku Trader MT5
KEENBASE SOFTWARE SOLUTIONS
1 (1)
KT Ichimoku Trader is a fully automated expert advisor that offers five popular trading strategies based on the Ichimoku indicator. Each strategy has it's own entry and exit method without any interference to other strategies. The Ichimoku system can be applied to all major currency pairs and metals. However, we found that it performs reasonably well mainly on two pairs.   MT4 Version is available here  https://www.mql5.com/en/market/product/35041 Features Trade up to 5 famous trading strate
KT Auto Fibo MT5
KEENBASE SOFTWARE SOLUTIONS
5 (1)
KT Auto Fibo draws Fibonacci retracement levels based on the ongoing trend direction. The Highs and Lows are automatically selected using the Maximum and Minimum points available on the chart. You can zoom in/out and scroll to adjust the Fibonacci levels accordingly. Modes Auto:  It draws the Fibonacci levels automatically based on the chart area. Manual:  It draws the Fibonacci levels only one time. After that, you can change the anchor points manually. Usage: Helps to predict the future p
KT Heiken Ashi Smoothed MT5
KEENBASE SOFTWARE SOLUTIONS
KT Heiken Ashi Smoothed is a smoothed version of the standard Heiken Ashi. Moreover, it also plots buy/sell arrows on a trend change. A buy arrow is plotted when it change to a bullish state from bearish state. A sell arrow is plotted when it change to a bearish state from bullish state. Mobile notifications, Email, Sound and Pop-up alerts included. What exactly is Heiken Ashi Smoothed? It filters out the false signals and noise in the standard Heiken Ashi. It applies the set of two moving a
KT Trend Magic
KEENBASE SOFTWARE SOLUTIONS
KT Trend Magic shows the trend depiction on chart using the combination of market momentum and volatility. A smoothing coefficient is used to smooth out the noise from the signal.It can be used to find out the new entries or confirm the trades produced by other EA/Indicators. Usage Drag n drop MTF scanner which scans for the new signals across multiple time-frames. Find new entries in the trend direction. Improve the accuracy of other indicators when used in conjunction. Can be used as a dyna
KT CCI Divergence MT5
KEENBASE SOFTWARE SOLUTIONS
KT CCI Divergence shows the regular and hidden divergence created between the price and CCI oscillator. Divergence is one of the vital signals that depicts the upcoming price reversal in the market. Manually spotting the divergence between price and CCI can be a hectic and ambiguous task. Limitations of KT CCI Divergence   Using the CCI divergence as a standalone entry signal can be risky. Every divergence can't be interpreted as a strong reversal signal. For better results, try to combine it
ACB Trade Filter MT4
KEENBASE SOFTWARE SOLUTIONS
5 (2)
The ACB Trade Filter indicator provides a solution for filtering out the low probability trading setups in a trading strategy. The indicator uses a sophisticated filtration algorithm based on the market sentiment and trend. Applications Works great with our indicator " ACB Breakout Arrows ". Filter out low probability signals from any indicator. Avoid overtrading and minimize the losses. Trade in the direction of market sentiment and trend. Avoid the choppiness in the market. How to use Only
KT Momentum Arrows
KEENBASE SOFTWARE SOLUTIONS
KT Momentum Arrows Indicator is based on a momentary breakout which is calculated using the bands deviation and emerging volatility in a certain direction. A buy signal is generated when the price close above the upper band and a sell signal is generated when the price close below the lower band. A magnitude coefficient is used as the input which affects the band deviation and volatility at the same time. The coefficient value should be carefully selected and analyzed based on the instrument and
KT COG Advanced MT4
KEENBASE SOFTWARE SOLUTIONS
1 (1)
KT COG is an advanced implementation of the center of gravity indicator presented by John F. Ehlers in the May 2002 edition of Technical Analysis of Stocks & Commodities magazine. It's a leading indicator which can be used to identify the potential reversal points with the minimum lag. The COG oscillator catches the price swings quite effectively. MT5 version of the same indicator is available here KT COG Advanced MT5 Calculation of COG The COG indicator is consist of the two lines. The mai
KT Pin Bar
KEENBASE SOFTWARE SOLUTIONS
KT Pin Bar identifies the pin bar formation which is a type of price action pattern which depicts a sign of reversal or rejection of the trend. When combined with support and resistance, BRN and other significant levels, Pin Bar pattern proved to be a very strong sign of reversal. Basically, a pin bar is characterized by a small body relative to the bar length which is closed either in upper or lower 50% part of its length. They have very large wicks and small candle body. A pin bar candlest
KT Auto Fibo
KEENBASE SOFTWARE SOLUTIONS
KT Auto Fibo draws Fibonacci retracement levels based on the ongoing trend direction. The Highs and Lows are automatically selected using the Maximum and Minimum points available on the chart. You can zoom in/out and scroll to adjust the Fibonacci levels accordingly. Modes Auto:  It draws the Fibonacci levels automatically based on the chart area. Manual: It draws the Fibonacci levels only one time. After that, you can change the anchor points manually. Usage: Helps to predict the future pr
KT Psar Arrows
KEENBASE SOFTWARE SOLUTIONS
KT Psar Arrows plots the arrows on chart using the standard Parabolic SAR indicator. A bullish arrow is plotted when the candle's high touch the SAR. A bearish arrow is plotted when the candle's low touch the SAR. The signals are generated in the real-time without waiting for the bar close.  Features A beneficial tool for traders who want to experiment with the trading strategies that include the use of Parabolic Sar indicator.  Can be used to find turning points in the market. Use custom PSA
KT Ichimoku Trader
KEENBASE SOFTWARE SOLUTIONS
1 (1)
KT Ichimoku Trader is a fully automated expert advisor that offers five popular trading strategies based on the Ichimoku indicator. Each strategy has it's own entry and exit method without any interference to other strategies. The Ichimoku system can be applied to all major currency pairs and metals. However, we found that it performs reasonably well mainly on two pairs.   MT5 Version is available here  https://www.mql5.com/en/market/product/35043 Features Trade up to 5 famous trading strate
KT Volatility Oscillator
KEENBASE SOFTWARE SOLUTIONS
KT Volatility oscillator analyze the past and current market data with a mathematical formula to display the result in a form of an oscillator. The growing and deteriorating waves are equivalent to high and low volatility in the asset.  In a nutshell, volatility is simply a measurement of the price fluctuation of an asset over a certain period of time. Without volatility, there would not much movement in the market and traders would not be able to profit from the price movements. Use of Volati
KT COG Robot
KEENBASE SOFTWARE SOLUTIONS
KT COG Robot is a fully automated Expert Advisor based on the KT COG Indicator . The COG indicator was originally presented by John F. Ehlers in the May 2002 edition of Technical Analysis of Stocks & Commodities magazine. The EA fires a long trade when COG line cross above the signal line and a short trade is fired when the COG line cross below the signal line.  Adaptive Filtration Our adaptive filtration algorithm combines the original COG formula with the major trend direction and market ac
ACB Breakout Arrows EA
KEENBASE SOFTWARE SOLUTIONS
This is a 100% automated expert advisor based on our custom indicator named "ACB Breakout Arrows" . The entries are based on a breakout pattern that constantly occurs in a bi-directional manner. The intensity of entry signals can be manipulated using the external input called "Signal Sensitivity". MT5 Version is available here  https://www.mql5.com/en/market/product/35785 Trades Confirmation ACB Breakout Arrows EA provides an ability to filter the entries using our another custom indicator n
KT Asian Breakout
KEENBASE SOFTWARE SOLUTIONS
4 (1)
KT Asian Breakout carefully analyzes the range-bound market during the Asian session and then fires a long or short trade after doing some preassessment based on its inbuilt technical analysis module. The executed orders are closed within a day before the completion of the next day session. The inbuilt technical analysis module checks for the session range and compares it with the last 20 days price movement. If it finds any erratic price movement within the session, the orders are not execute
KT London Breakout
KEENBASE SOFTWARE SOLUTIONS
First thirty minutes are essential for a trading session. The early reaction of traders and market players sets a path for the rest of the day. KT London Breakout EA takes advantage of this phenomenon, and after analyzing the first thirty minutes of London session, it places two bidirectional pending orders. One of pending order is eventually canceled after realizing the market direction with certainty. It has been strictly tested and developed for EUR/JPY using 30-Min Time Frame. You can ex
Use of support and resistance in systematic trading is very subjective. Every trader has their own idea and way to plotting the support and resistance levels on the chart. KT Support and Resistance indicator take out this ambiguity out of the situation and automatically draws support and resistance levels following an algorithmic approach using a unique multi-timeframe analysis. When launched on the chart, It immediately scan the most significant extreme points across all the available timefr
MACD Divergence Seeker
KEENBASE SOFTWARE SOLUTIONS
KT MACD Divergence Seeker trades the regular and hidden divergence signals generated by our free indicator named KT MACD Divergence indicator. Trading the standalone divergences can be a risky affair that's why the KT MACD Divergence Seeker combines the standard divergence signals with an advanced analysis module to exploit the price inefficiencies on some FX pairs. What is the Divergence exactly? As a general conception if the price is making higher highs, then macd should also be making
KT Asian Breakout Indicator
KEENBASE SOFTWARE SOLUTIONS
KT Asian Breakout indicator scans and analyzes a critical part of the Asian session to generate bi-directional buy and sell signals with the direction of a price breakout. A buy signal occurs when the price breaks above the session high, and a sell signal occurs when the price breaks below the session low. MT5 Version is available here https://www.mql5.com/en/market/product/41704 Things to remember If the session box is vertically too wide, a new trade should be avoided as most of the price
MACD Divergence MT4
KEENBASE SOFTWARE SOLUTIONS
KT MACD Divergence shows the regular and hidden divergences build between the price and oscillator. If your trading strategy anticipates the trend reversal, you can include the MACD regular divergence to speculate the potential turning points. And if your trading strategy based on the trend continuation, MACD hidden divergence would be a good fit. Limitations of KT MACD Divergence Using the macd divergence as a standalone entry signal can be a risky affair. Every divergence can't be interpr
KT Bollinger Bands Trader MT4
KEENBASE SOFTWARE SOLUTIONS
KT Bollinger Bands Trader is a 100% automated expert advisor that's incorporated a mean reversion trading strategy using the Bollinger bands during the period of low volatility. Price often reacts at the upper or lower line of Bollinger bands, but a reversal not always occurs. However, there is more chance of price reversal during the time of low volatility. Entries A buy trade is activated when price correctly aligns below the bottom line of Bollinger bands. A sell trade is activated when pri
Filtro:
Nessuna recensione
Rispondi alla recensione