• Panoramica
  • Recensioni (1)
  • Commenti (7)
  • Novità

UPD1 Watermark MT4

5

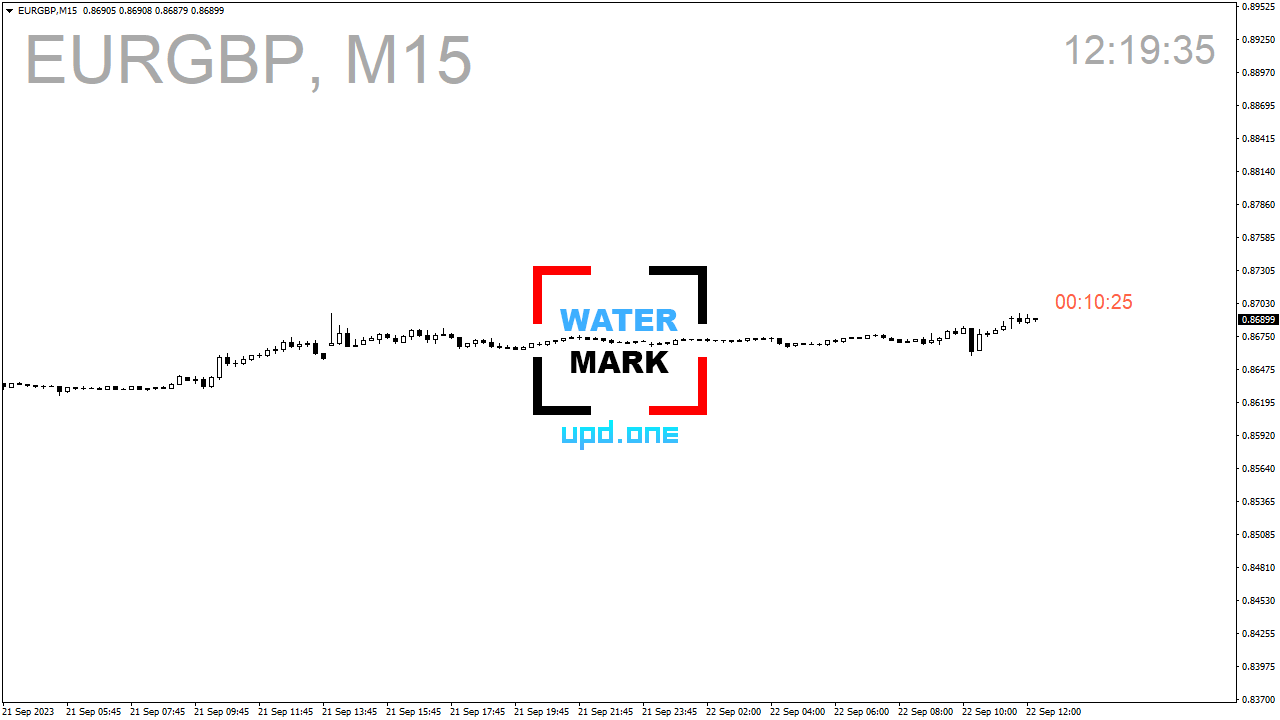
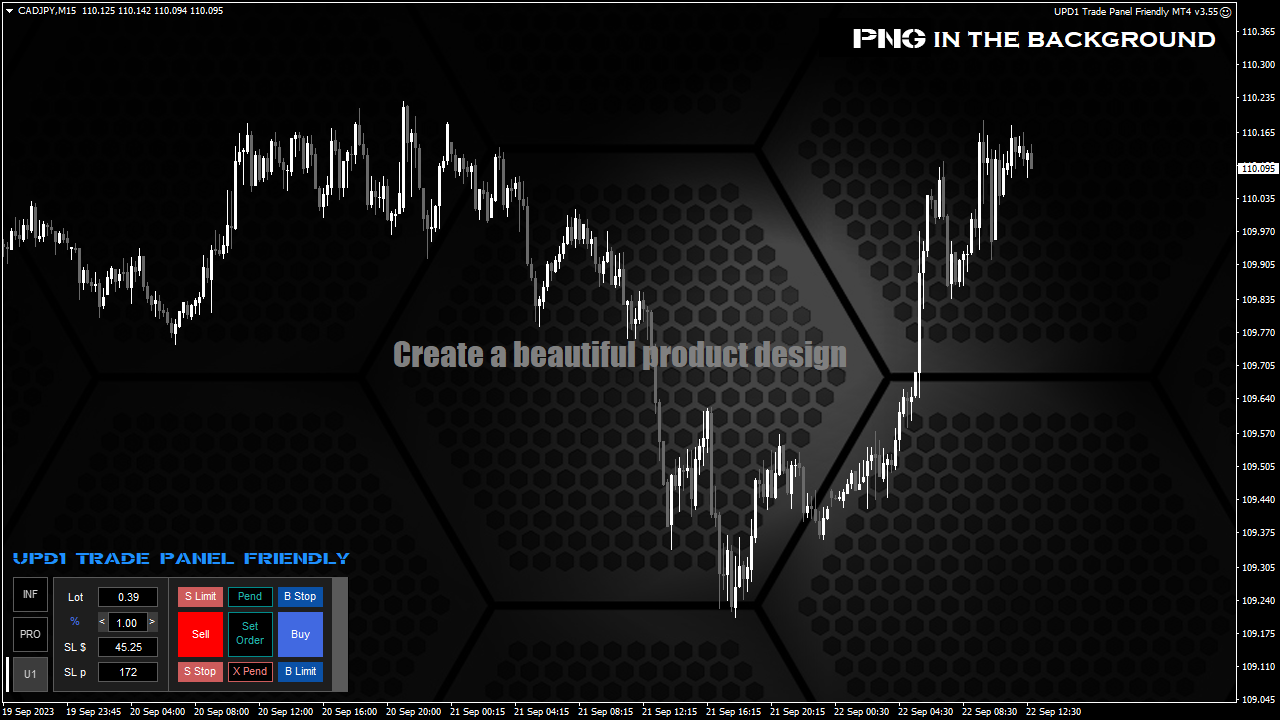
L'indicatore visualizza qualsiasi testo e qualsiasi immagine sul grafico e può anche visualizzare le informazioni richieste dalle macro.

Sono disponibili tre blocchi di testo e un blocco per le immagini. Sono disponibili la selezione dei caratteri, la dimensione, il colore, l'indentazione e il posizionamento.

Se si desidera marcare le schermate o visualizzare le informazioni richieste su un grafico, UPD1 Watermark sarà uno strumento molto utile.


Descrizione delle impostazioni.


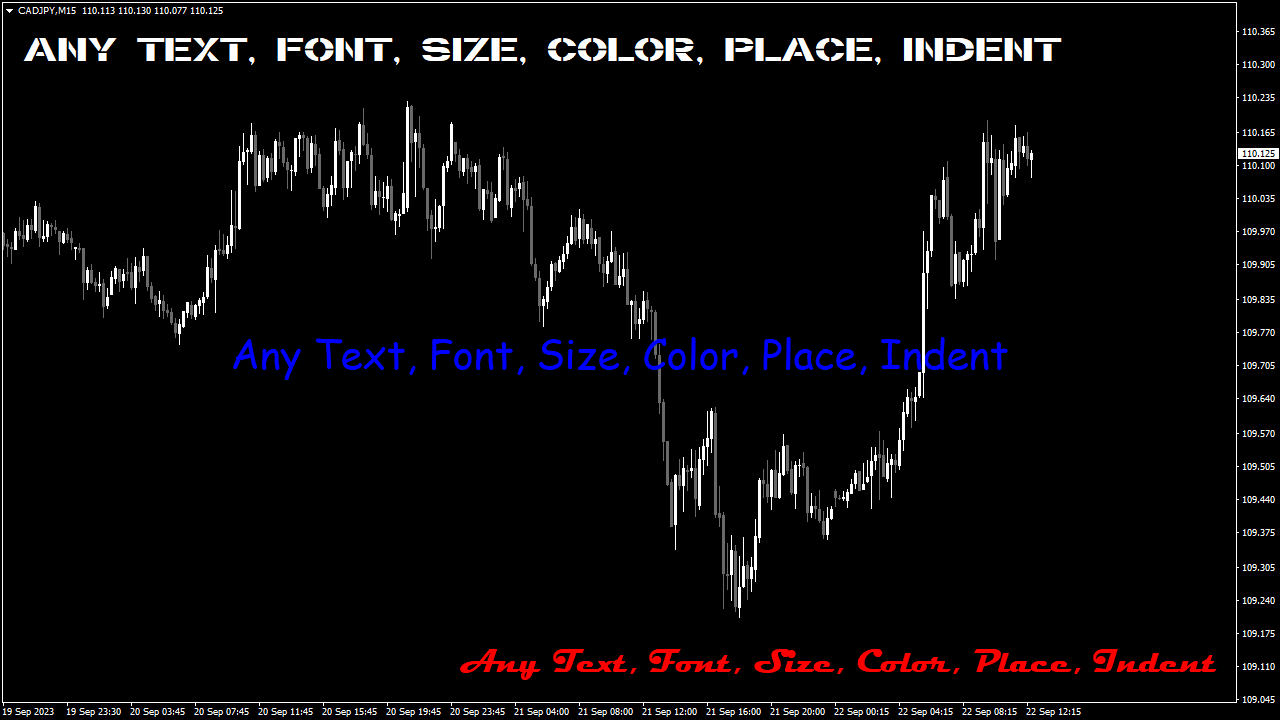
Impostazioni del testo (3 blocchi).

Text 1, 2, 3 – inserire testo e o macro.

Font Name – inserire il nome del carattere. In caso di errore, verrà utilizzato il font predefinito.

Font Size – specifica la dimensione del carattere.

Font Color – specificare il colore del carattere.

Corner – seleziona l'angolo di scatto dell'oggetto.

Visual Position – posiziona l'oggetto davanti o dietro il grafico.

X – rientro orizzontale in pixel.

Y – rientranza verticale in pixel.


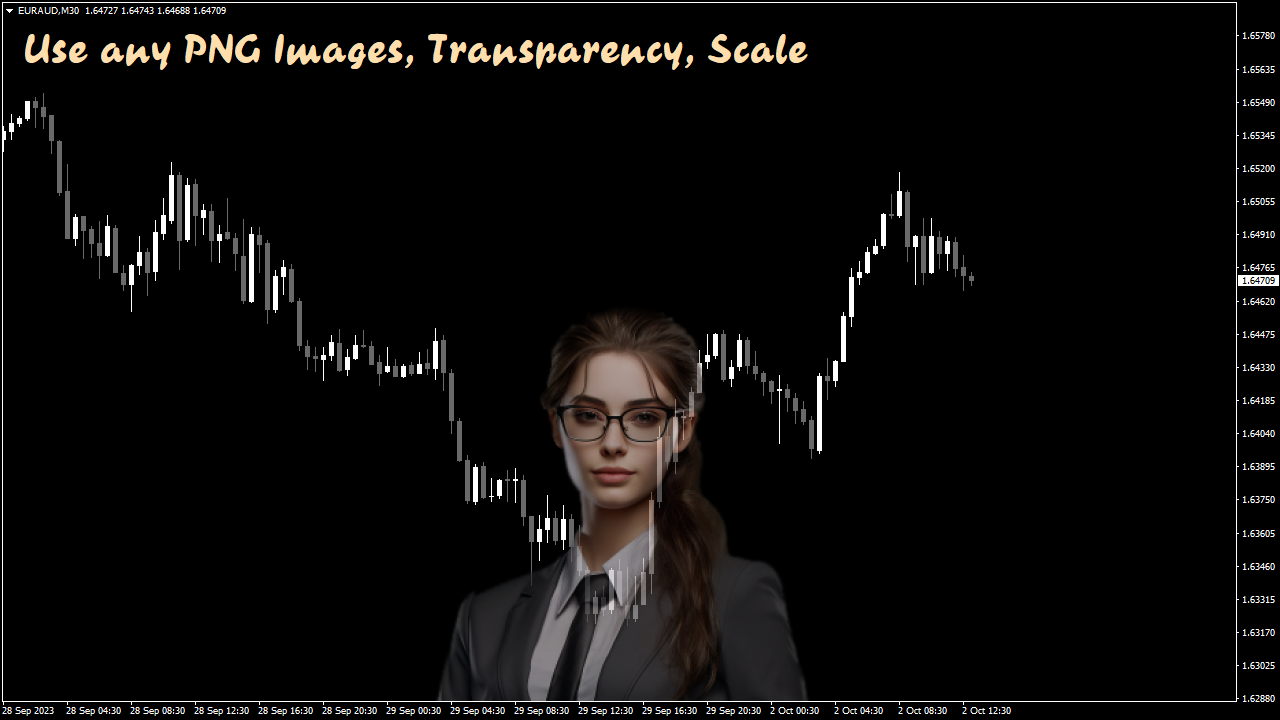
Impostazioni immagine (1 blocco).

Image – seleziona un'immagine.

  • Manual - in questa impostazione, inserire il nome dell'immagine sottostante.
  • Watermark.
  • Money Mandala.

    Manual Image Name ***.png in Files – specificare il nome del file PNG.

    Il file PNG deve trovarsi in Terminal\MQL4\Files\

    Corner – seleziona l'angolo di riferimento dell'oggetto.

    Visual Position – posizione dell'oggetto davanti o dietro il grafico.

    Zoom in % - specifica la scala dell'immagine in percentuale.

    Transparent in % (0-100) - specifica la trasparenza dell'immagine in percentuale.

    X – rientro orizzontale in pixel.

    Y – rientro verticale in pixel.


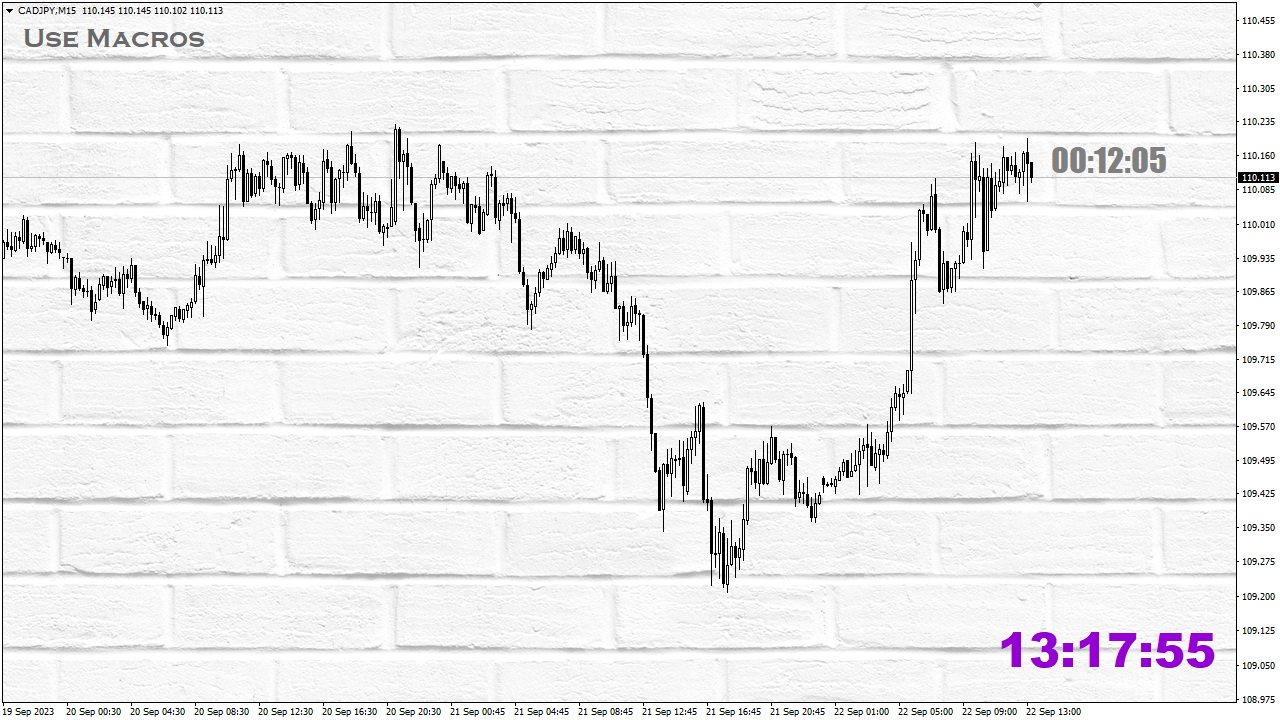
    Aiuto macro (solo informazioni).

    // - nasconde il testo, disattiva le macro.

    Symbol - nome della coppia di valute.

    Date - data odierna.

    Ask - prezzo Ask.

    Bid - prezzo Bid.

    Time - ora corrente del broker.

    LocalTime - l'ora locale.

    Period - lasso di tempo.

    TimeBarClose - orario di chiusura della barra.

    TimeToCloseBar - tempo prima della chiusura della barra.


    Recensioni 1
    r127
    14
    r127 2024.02.07 03:50 
     

    muito bom... seria bem legal se tivesse pra mt5 também.

    Prodotti consigliati
    Extremum Reverse Bar
    Yurij Izyumov
    3.55 (11)
    This indicator has been created for finding the probable reversal points of the symbol price. A small candlestick reversal pattern is used it its operation in conjunction with a filter of extremums. The indicator is not redrawn! If the extremum filter is disabled, the indicator shows all points that have a pattern. If the extremum filter is enabled, the condition works – if the history Previous bars 1 candles back contains higher candles and they are farther than the Previous bars 2 candle, such
    FREE
    This trial scanner works with the other "Smart Market Structure Opportunity Scanner", and is basically an extension of that scanner with added features to find more accurate entry opportunities for day trading or refined swing trading.  The most important added features are:  1) The ADRs ( Average Daily Range ) for the last 5 days would have color and  +/- sign that shows the direction of each days ADR     move.  2) I added RSI values for each of the trading timeframes ( 1min, 5min, 15min, 30min
    FREE
    PZ Penta O MT4
    PZ TRADING SLU
    2.25 (4)
    The Penta-O is a 6-point retracement harmonacci pattern which usually precedes big market movements. Penta-O patterns can expand and repaint quite a bit. To make things easier this indicator implements a twist: it waits for a donchian breakout in the right direction before signaling the trade. The end result is an otherwise repainting indicator with a very reliable trading signal. The donchian breakout period is entered as an input. [ Installation Guide | Update Guide | Troubleshooting | FAQ | A
    FREE
    Benvenuti nel nostro   modello di ondata di prezzo   MT4 --(modello ABCD)--     Il modello ABCD è un modello di trading potente e ampiamente utilizzato nel mondo dell'analisi tecnica. È un modello di prezzo armonico che i trader utilizzano per identificare potenziali opportunità di acquisto e vendita sul mercato. Con il modello ABCD, i trader possono anticipare potenziali movimenti di prezzo e prendere decisioni informate su quando entrare e uscire dalle negoziazioni. Versione EA:   Price Wa
    FREE
    Market Profile 3
    Hussien Abdeltwab Hussien Ryad
    4 (4)
    Market Profile 3 MetaTrader 4 indicator  — is a classic Market Profile implementation that can show the price density over time, outlining the most important price levels, value area, and control value of a given trading session. This indicator can be attached to timeframes between M1 and D1 and will show the Market Profile for daily, weekly, monthly, or even intraday sessions. Lower timeframes offer higher precision. Higher timeframes are recommended for better visibility. It is also possible t
    FREE
    BoxProfile MT4
    Evgeny Shevtsov
    4.8 (15)
    The indicator displays volume profiles based on the nesting principle. Profiles periods are pre-set so that each subsequent profile has a length twice as long as the length of the previous profile. In addition to profiles, the indicator displays volume clusters sorted by color, depending on the volume they contain. Indicator operation features The indicator works on typical timeframes from M5 to MN, but for calculations uses historical data from smaller timeframes: M1 - for timeframes from M5
    FREE
    ADR Bands
    Navdeep Singh
    4.33 (3)
    Average daily range, Projection levels, Multi time-frame ADR bands shows levels based on the selected time-frame. Levels can be used as projections for potential targets, breakouts or reversals depending on the context in which the tool is used. Features:- Multi time-frame(default = daily) Two coloring modes(trend based or zone based) Color transparency  
    FREE
    TrendPlus
    Sivakumar Subbaiya
    4.21 (14)
    Trend Plus   Trendplus  Indicator   Time Frame: Suitable for any time frame.  Purpose: Trend Prediction. Blue and red candle indicate the buy and sell call respectively. Buy: When the blue candle is formed buy call is initiated. close the buy trades when the next red candle will formed.   Sell: When the Red candle is formed Sell call is initiated. close the Sell trades when the next blue candle will formed.   Happy trade!!
    FREE
    Virtual Targets
    Hoang Van Dien
    3.83 (6)
    This indicator is very useful for day traders or short term traders. No need to calculate the number of pips manually, just look at the chart and you will see the Virtual Take Profit / Virtual Stop Loss target line and evaluate whether the entry point is feasible to reach the intended target or not. Enter the intended Take Profit / Stop Loss pips for your trade. The indicator will display Virtual Take Profit / Virtual Stop Loss lines for you to easily see if the target is feasible or not.
    FREE
    An indicator for visualizing time ranges of key trading sessions: Asian, European, and American. The indicator features functionality for setting the start and end times of each trading session, as well as an adjustable timezone of the trading server. The main advantages of the indicator include the ability to operate with minimal CPU load and memory usage. Moreover, it offers the option to specify the number of displayed historical days, providing the user with flexible market dynamics analysis
    FREE
    Renko bars builder
    Navdeep Singh
    5 (5)
    The indicator builds a Renko chart in the sub window for the current symbol. The bars are formed from live data and the desired bar size can be set in the inputs tab. Most importantly, because the Renko chart only uses price to construct bars and ignores time, the indicator can be applied to any time frame and same results can be achieved. Recommended usage As Renko charts are famous for eliminating noise so traders can use this tool to see clear picture of the trend to help their analysis, ent
    FREE
    Follow The Line
    Oliver Gideon Amofa Appiah
    4 (13)
    FOLLOW THE LINE GET THE FULL VERSION HERE: https://www.mql5.com/en/market/product/36024 This indicator obeys the popular maxim that: "THE TREND IS YOUR FRIEND" It paints a GREEN line for BUY and also paints a RED line for SELL.  It gives alarms and alerts of all kinds. IT DOES NOT REPAINT and can be used for all currency pairs and timeframes. Yes, as easy and simple as that. Even a newbie can use it to make great and reliable trades. NB: For best results, get my other premium indicators for more
    FREE
    Wise Men Indicator demo
    Bohdan Kasyanenko
    3.67 (3)
    The indicator displays signals according to the strategy of Bill Williams on the chart. Demo version of the indicator has the same features as the paid, except that it can work only on a demo account . Signal "First Wise Man" is formed when there is a divergent bar with angulation.  Bullish divergent bar - with lower minimum and closing price in the upper half. Bearish divergent bar - higher maximum and the closing price at the bottom half. Angulation is formed when all three lines of Alligat
    FREE
    Pivot Point Fibo RSJ è un indicatore che traccia le linee di supporto e resistenza del giorno utilizzando i tassi di Fibonacci. Questo spettacolare indicatore crea fino a 7 livelli di supporto e resistenza tramite Pivot Point utilizzando i tassi di Fibonacci. È fantastico come i prezzi rispettino ogni livello di questo supporto e resistenza, dove è possibile percepire possibili punti di entrata/uscita di un'operazione. Caratteristiche Fino a 7 livelli di supporto e 7 livelli di resistenza
    FREE
    Wicks UpDown Target GJ Wicks UpDown Target GJ is specialized in GJ forex pairs. Choppy movement up and down on the opening range every day.  Trading breakouts on London session and New York session is recommended. Guideline Entry Strategy Idea: Step 1 - Breakout Forming (Warning! Trade on London Session and New York Session) Step 2 - Breakout Starting (Take Action on your trading plan) Step 3 - Partial Close your order & set breakeven (no-risk) Step 4 - Target complete Step 5 - Don't tr
    FREE
    QuantumAlert Stoch Navigator is a free indicator available for MT4/MT5 platforms, its work is to provide "alerts" when the market is inside "overbought and oversold" regions in the form of "buy or sell" signals. This indicator comes with many customization options mentioned in the parameter section below, user can customise these parameters as needful. Join our   MQL5 group , where we share important news and updates. You are also welcome to join our private channel as well, contact me for the p
    FREE
    MASi Three Screens
    Aleksey Terentev
    5 (2)
    MASi Three Screens is based on the trading strategy by Dr. Alexander Elder. This indicator is a collection of algorithms. Algorithms are based on the analysis of charts of several timeframes. You can apply any of the provided algorithms. List of versions of algorithms:     ThreeScreens v1.0 - A simple implementation, with analysis of the MACD line;     ThreeScreens v1.1 - A simple implementation, with analysis of the MACD histogram;     ThreeScreens v1.2 - Combines the first two algorithms
    FREE
    MQLTA Support Resistance Lines is an indicator that calculates the historical levels of Support and Resistance and display them as Lines on chart. It will also Alert you if the price is in a Safe or Dangerous zone to trade and show you the distance to the next level. The indicator is ideal to be used in other Expert Advisor through the iCustom function. This DEMO only works with AUDNZD, the full product can be found at https://www.mql5.com/en/market/product/26328 How does it work? The indicato
    FREE
    Cumulative Delta MT4
    Evgeny Shevtsov
    4.69 (35)
    The indicator analyzes the volume scale and splits it into two components - seller volumes and buyer volumes, and also calculates the delta and cumulative delta. The indicator does not flicker or redraw, its calculation and plotting are performed fairly quickly, while using the data from the smaller (relative to the current) periods. The indicator operation modes can be switched using the Mode input variable: Buy - display only the buyer volumes. Sell - display only the seller volumes. BuySell -
    FREE
    --->  Check all the other products  <--- The Candle Bias is a coloring indicator that doesn't take account of the close price of the bars.  It will color the candle in the bearish color (of your choice) if the downard range is greater than the upward range.  Conversely, it will color the candle in the bullish color of your choice if the upward range is greater than the downward range.  This is a major helper for Multi Time Frame analysis, it works on every security and every Time Frame. You
    FREE
    Triple RSI
    Pablo Leonardo Spata
    2.5 (2)
    LOOK AT THE FOLLOWING STRATEGY WITH THIS INDICATOR. Triple RSI is a tool that uses the classic Relative Strength Indicator, but in several timeframes to find market reversals.    1.  ️ Idea behind the indicator and its strategy: In Trading, be it Forex or any other asset, the ideal is to keep it simple, the simpler the better . The triple RSI strategy is one of the simple strategies that seek market returns. In our experience, where there is more money to always be won, is in the marke
    FREE
    Scalping indicator. It takes into account volatility, price movement in the local interval and the direction of the current trend. Recommended timeframe - M5. Advantages: Low volatility when a signal appears ensures minimal movement against an open position. The indicator does not redraw its signals. There are alert signals. It is a great tool for day trading. Settings: Name Description Period Indicator period Range of each bar in the period (pp.) The maximum size of each candle in the indicat
    FREE
    Free automatic Fibonacci is an indicator that automatically plots a Fibonacci retracement based on the number of bars you select on the BarsToScan setting in the indicator. The Fibonacci is automatically updated in real time as new highest and lowest values appears amongst the selected bars. You can select which level values to be displayed in the indicator settings. You can also select the color of the levels thus enabling the trader to be able to attach the indicator several times with differe
    FREE
    UPD1 X00 Levels
    Vitaliy Kuznetsov
    4.92 (12)
    L'indicatore mostra livelli circolari sul grafico. Sono anche chiamati livelli psicologici, bancari o dei principali operatori. A questi livelli si verifica una vera e propria lotta tra tori e orsi, l'accumulo di molti ordini, che porta a un aumento della volatilità. L'indicatore si adatta automaticamente a qualsiasi strumento e timeframe. Se il livello 80 viene rotto e poi testato, acquistare. Se il livello 20 viene rotto e poi testato, vendere. L'obiettivo è 00. Attenzione. A causa dei forti
    FREE
    QuantumAlert RSI Navigator is a free indicator available for MT4/MT5 platforms, its work is to provide "alerts" when the market is inside "overbought and oversold" regions in the form of "buy or sell" signals. This indicator comes with many customization options mentioned in the parameter section below, user can customise these parameters as needful. Join our   MQL5 group , where we share important news and updates. You are also welcome to join our private channel as well, contact me for the pri
    FREE
    Are you tired of drawing trendlines every time you're analyzing charts? Or perhaps you would like more consistency in your technical analysis. Then this is for you. This indicator will draw trend lines automatically when dropped on a chart. How it works Works similar to standard deviation channel found on mt4 and mt5. It has 2 parameters: 1. Starting Bar 2. Number of bars for calculation The   starting bar   is the bar which drawing of the trend lines will begin, while the   number of bars for c
    FREE
    You can find full version here: Harmonic Pattern Scanner MT4 Harmonic Pattern Scanner MT5 Introduction Harmonic Patterns are best used to predict turning point. Harmonic Patterns give you high win rate and high opportunities for trade in during one day. This indicator detects the best and successful patterns base on   Harmonic Trading   books by   Mr. Scott M.. Main Features Detect the best and     most successful patterns : Gartley, Bat, Crab, Butterfly, Cypher, Shark, Alt_Bat, Deep_Crab Easy-
    FREE
    Rainbow MT4
    Jamal El Alama
    Rainbow MT4 is a technical indicator based on Moving average with period 34 and very easy to use. When price crosses above MA and MA changes color to green, it’s a signal to buy. When price crosses below MA and MA changes color to red, it’s a signal to sell. The Expert advisor ( Rainbow EA MT4) based on Rainbow MT4 indicator, as you can see in the short video below is now available here .
    FREE
    Dear Traders this is my another tool called " Swing Master Indicator ". As the name above the indicator is designed to help you in swing trading by capturing the low and highs of the price. You may us this tool with any trading strategy and style from scalping to position trading. It is made for level of traders including newbies and advanced traders even prop-firms, hedge funds and banks to help them make sold market analysis. I create tools for serious traders who want to make a difference in
    MASi Wave Histogram
    Aleksey Terentev
    5 (1)
    This is an implementation of the market cycle indicator described by Raghee Horner in the book "Forex Trading for Maximum Profit" . The current state of the market can be determined by analyzing the inclination angle of the exponential moving average (EMA) running on a period of 34 bars. If the EMA inclination is defined as the direction of the hour hand on the dial from 12 to 2 hours, then an uptrend is considered to be present; from 2 to 4 hours, the market consolidates; from 4 to 6 hours, a d
    FREE
    Gli utenti di questo prodotto hanno anche acquistato
    Gann Made Easy
    Oleg Rodin
    4.92 (62)
    Gann Made Easy è un sistema di trading Forex professionale e facile da usare che si basa sui migliori principi del trading utilizzando la teoria di mr. WD Gann. L'indicatore fornisce segnali ACQUISTA e VENDI accurati, inclusi i livelli di Stop Loss e Take Profit. Puoi fare trading anche in movimento utilizzando le notifiche PUSH. Vi prego di contattarmi dopo l'acquisto! Condividerò i miei consigli di trading con te e fantastici indicatori bonus gratuitamente! Probabilmente hai già sentito parlar
    ATTUALMENTE SCONTATO DEL 26% La soluzione migliore per ogni principiante o trader esperto! Questo indicatore è uno strumento di trading unico, di alta qualità e conveniente perché abbiamo incorporato una serie di caratteristiche proprietarie e una nuova formula. Con un solo grafico è possibile leggere la forza delle valute per 28 coppie Forex! Immaginate come migliorerà il vostro trading perché sarete in grado di individuare l'esatto punto di innesco di una nuova tendenza o di un'opportunit
    Atomic Analyst
    Issam Kassas
    5 (3)
    Innanzitutto, vale la pena sottolineare che questo indicatore di trading non è repaint, non è ridisegno e non presenta ritardi, il che lo rende ideale sia per il trading manuale che per quello automatico. Manuale utente: impostazioni, input e strategia. L'Analista Atomico è un indicatore di azione del prezzo PA che utilizza la forza e il momentum del prezzo per trovare un miglior vantaggio sul mercato. Dotato di filtri avanzati che aiutano a rimuovere rumori e segnali falsi, e aumentare il pote
    Gold Stuff
    Vasiliy Strukov
    4.89 (255)
    Gold Stuff è un indicatore di tendenza progettato specificamente per l'oro e può essere utilizzato anche su qualsiasi strumento finanziario. L'indicatore non ridisegna e non è in ritardo. Periodo consigliato H1. Su di esso l'indicatore funziona in modo completamente automatico Expert Advisor EA Gold Stuff. Lo trovi nel mio profilo. Contattami subito dopo l'acquisto per avere le impostazioni e un bonus personale!   IMPOSTAZIONI Disegna freccia - acceso spento. disegnando frecce sul grafi
    Advanced Supply Demand
    Bernhard Schweigert
    4.92 (310)
    CURRENTLY 26% OFF !! Best Solution for any Newbie or Expert Trader! This indicator is a unique, high quality and affordable trading tool because we have incorporated a number of proprietary features and a new formula. With this update, you will be able to show double timeframe zones. You will not only be able to show a higher TF but to show both, the chart TF, PLUS the higher TF: SHOWING NESTED ZONES. All Supply Demand traders will love it. :) Important Information Revealed Maximize the potenti
    TPSpro RFI Levels
    Roman Podpora
    5 (13)
    A key element in trading is zones or levels from which decisions to buy or sell a trading instrument are made. Despite attempts by major players to conceal their presence in the market, they inevitably leave traces. Our task was to learn how to identify these traces and interpret them correctly. Reversal First Impulse levels (RFI)   -  Version MT5                INSTRUCTIONS                 RUS                 ENG                                       R ecommended to use with an indicator   -  
    TPSproTREND PrO
    Roman Podpora
    5 (15)
    TPSpro TRENDPRO  - is a trend indicator that automatically analyzes the market and provides information about the trend and each of its changes, as well as giving signals for entering trades without redrawing! The indicator uses each candle, analyzing them separately. referring to different impulses - up or down impulse. Exact entry points into transactions for currencies, crypto, metals, stocks, indices!  -  Version MT5               DETAILED DESCRIPTION        /       TRADING SETUPS           
    Dragon Multi Indicator MT4
    Mansour Babasafary
    5 (1)
    74% discount for the next 10 buyers (original price $605): 1 left Get a 50% bonus by buying (or even renting) any of our products. After buying (or renting), send a message for more information. 3 Indicators in 1 indicator Strategy based on price action Made specifically for the best forex currency pairs Can be used in the best time frame of the market at a very reasonable price This indicator is basically 3 different indicatos . But we have combined these 3 indicators in 1 indicator so th
    Break and Retest
    Mohamed Hassan
    4.6 (10)
    ‍You can visually backtest Break & Retest to see how it behaved in the past!     Manual guide:   Click here $65  for only 2  copies left! Next price is $120 .  This Indicator only places quality trades when the market is really in your favor with a clear break and retest. Patience is key with this price action strategy! Recommended timeframes: M1 for Scalpers.  M15 for Intraday traders. H1 & H4 for Day traders. Other timeframes are also excellent! After many months of hard
    ON Trade Optuma Astro
    Abdullah Alrai
    5 (4)
    Presentazione dell'Indicatore Astronomico per MT4: Il tuo compagno di trading celeste definitivo Sei pronto a elevare la tua esperienza di trading a livelli celesti? Non cercare oltre, il nostro rivoluzionario Indicatore Astronomico per MT4 è qui. Questo strumento innovativo va oltre gli indicatori di trading tradizionali, sfruttando algoritmi complessi per offrirti intuizioni astronomiche senza pari e calcoli di precisione. Un universo di informazioni a portata di mano: Ammira un pannello compl
    Scopri il segreto per il trading Forex di successo con il nostro indicatore MT4 personalizzato! Ti sei mai chiesto come raggiungere il successo nel mercato Forex, guadagnando costantemente profitti minimizzando il rischio? Ecco la risposta che hai cercato! Permettici di presentare il nostro indicatore MT4 proprietario che rivoluzionerà il tuo approccio al trading. Versatilità unica Il nostro indicatore è appositamente progettato per gli utenti che preferiscono le formazioni di candele Ren
    Presentazione       Quantum Trend Sniper Indicator   , l'innovativo indicatore MQL5 che sta trasformando il modo in cui identifichi e scambi le inversioni di tendenza! Sviluppato da un team di trader esperti con un'esperienza di trading di oltre 13 anni,       Indicatore Quantum Trend Sniper       è progettato per spingere il tuo viaggio di trading verso nuove vette con il suo modo innovativo di identificare le inversioni di tendenza con una precisione estremamente elevata. *** Acquista Quant
    Vi presentiamo ON Trade Waves Patterns Harmonic Elliot Wolfe, un indicatore avanzato progettato per rilevare vari tipi di pattern sul mercato utilizzando metodi sia manuali che automatici. Ecco come funziona: Pattern Armonici: Questo indicatore è in grado di individuare pattern armonici che appaiono sul vostro grafico. Questi pattern sono fondamentali per i trader che praticano la teoria del trading armonico, come descritta nel libro di Scott Carney "Harmonic Trading vol 1 & 2". Che li disegniat
    Trend Screener
    STE S.S.COMPANY
    4.83 (88)
    Indicatore di tendenza, soluzione unica rivoluzionaria per il trading di tendenze e il filtraggio con tutte le importanti funzionalità di tendenza integrate in un unico strumento! È un indicatore multi-timeframe e multi-valuta al 100% non ridipingibile che può essere utilizzato su tutti i simboli/strumenti: forex, materie prime, criptovalute, indici e azioni. Trend Screener è un indicatore di tendenza che segue un indicatore efficiente che fornisce segnali di tendenza a freccia con punti nel gra
    on free demo press zoom out button to see back.. cnt number is bar numbers.you can change up to 3000 related to chart bars numbers. minimum value is 500. there is g value set to 1.01. no need to change it. this indicator almost grail,no repaint and all pairs ,all timeframe indicator. there is red and blue histograms. if gold x sign comes on red histogram that is sell signal. if blue x sign comes on blue histogram that is buy signal. this indicator on thise version works all pairs.al timeframes
    FX Power MT4 NG
    Daniel Stein
    5 (9)
    Ricevi il tuo aggiornamento quotidiano sul mercato con dettagli e schermate tramite il nostro Morning Briefing qui su mql5 e su Telegram ! FX Power MT4 NG è la nuova generazione del nostro popolare misuratore di forza delle valute, FX Power. Cosa offre questo misuratore di forza di nuova generazione? Tutto ciò che avete amato dell'FX Power originale IN PIÙ Analisi della forza di ORO/XAU Risultati di calcolo ancora più precisi Periodi di analisi configurabili individualmente Limite di calcolo pe
    Innanzitutto, vale la pena sottolineare che questo Strumento di Trading è un Indicatore Non-Ridipingente, Non-Ridisegnante e Non-Laggante, il che lo rende ideale per il trading professionale. Corso online, manuale utente e demo. L'Indicatore Smart Price Action Concepts è uno strumento molto potente sia per i nuovi che per i trader esperti. Racchiude più di 20 utili indicatori in uno solo, combinando idee di trading avanzate come l'Analisi del Trader del Circolo Interno e le Strategie di Trading
    Advanced Currency IMPULSE with ALERT
    Bernhard Schweigert
    4.91 (494)
    ATTUALMENTE SCONTATO DEL 31%! La soluzione migliore per ogni principiante o trader esperto! Questo indicatore è uno strumento di trading unico, di alta qualità e conveniente perché abbiamo incorporato una serie di caratteristiche proprietarie e una formula segreta. Con un solo grafico fornisce avvisi per tutte le 28 coppie di valute. Immaginate come migliorerà il vostro trading perché sarete in grado di individuare l'esatto punto di innesco di una nuova tendenza o opportunità di scalping!
    Currency Strength Wizard è un indicatore molto potente che ti fornisce una soluzione all-in-one per un trading di successo. L'indicatore calcola la potenza di questa o quella coppia forex utilizzando i dati di tutte le valute su più intervalli di tempo. Questi dati sono rappresentati in una forma di indice di valuta facile da usare e linee elettriche di valuta che puoi utilizzare per vedere il potere di questa o quella valuta. Tutto ciò di cui hai bisogno è collegare l'indicatore al grafico che
    Scalper Inside PRO
    Alexey Minkov
    4.75 (57)
    An exclusive indicator that utilizes an innovative algorithm to swiftly and accurately determine the market trend. The indicator automatically calculates opening, closing, and profit levels, providing detailed trading statistics. With these features, you can choose the most appropriate trading instrument for the current market conditions. Additionally, you can easily integrate your own arrow indicators into Scalper Inside Pro to quickly evaluate their statistics and profitability. Scalper Inside
    Scalper Vault
    Oleg Rodin
    5 (28)
    Scalper Vault è un sistema di scalping professionale che ti fornisce tutto il necessario per scalping di successo. Questo indicatore è un sistema di trading completo che può essere utilizzato dai trader di forex e opzioni binarie. L'intervallo di tempo consigliato è M5. Il sistema fornisce segnali di freccia accurati nella direzione della tendenza. Ti fornisce anche i segnali più alti e più bassi e i livelli di mercato di Gann. Gli indicatori forniscono tutti i tipi di avvisi, comprese le notifi
    Shepherd Harmonic Pattern
    Abdullah Alrai
    4.68 (59)
    Questo indicatore rileverà modelli armonici disegnati sul grafico mediante metodi manuali e automatici. Puoi consultare il manuale dell'utente tramite questo link: Aggiungi la tua recensione e contattaci per ottenerlo. C'è una versione gratuita per provare questo prodotto su MT4. Puoi usarlo per rilevare i modelli di Gartley e Nenstar: https://www.mql5.com/en/market/product/30181 Puoi acquistare la versione completa di MT4 da: https://www.mql5.com/en/market/product/15212 Note L'indicatore ha un
    Market Reversal Alerts
    LEE SAMSON
    4.21 (121)
    Il profitto dalla struttura del mercato cambia quando il prezzo si inverte e si ritira. L'indicatore di avviso di inversione della struttura del mercato identifica quando una tendenza o un movimento di prezzo si sta avvicinando all'esaurimento e pronto a invertire. Ti avvisa dei cambiamenti nella struttura del mercato che in genere si verificano quando stanno per verificarsi un'inversione o un forte pullback. L'indicatore identifica inizialmente i breakout e lo slancio del prezzo, ogni volta
    PRO Renko System
    Oleg Rodin
    5 (25)
    PRO Renko System è un sistema di trading altamente accurato appositamente progettato per il trading di grafici RENKO. Questo è un sistema universale che può essere applicato a vari strumenti di trading. Il sistema neutralizza efficacemente il cosiddetto rumore di mercato che consente di accedere a segnali di inversione accurati. L'indicatore è molto facile da usare e ha un solo parametro responsabile della generazione del segnale. Puoi facilmente adattare lo strumento a qualsiasi strumento
    Attualmente 20% di sconto! La soluzione migliore per ogni principiante o trader esperto! Questo software per cruscotti funziona su 28 coppie di valute. Si basa su 2 dei nostri indicatori principali (Advanced Currency Strength 28 e Advanced Currency Impulse). Offre un'ottima panoramica dell'intero mercato Forex. Mostra i valori di forza delle valute avanzate, la velocità di movimento delle valute e i segnali per 28 coppie Forex in tutti i (9) timeframe. Immaginate come migliorerà il vostro t
    Symbols must be separated by commas (,) and entered into the parameters exactly as displayed by your broker to ensure they are recognized in the dashboard. These symbols will be used for analysis by the indicator. With one click open any pair any timeframe directly from dashboard The MA Speedometer Dashboard is a highly functional MetaTrader 4 (MT4) indicator designed to enhance trading strategies through dynamic market analysis. It offers robust features for identifying market trends, trading
    TrendMaestro
    Stefano Frisetti
    5 (2)
    nota: questo indicatore e' per METATRADER4, se vuoi la versione per  METATRADER5 questo e' il link:  https://www.mql5.com/it/market/product/108123 TRENDMAESTRO ver 2.4 TRENDMAESTRO riconosce un nuovo TREND sul nascere, non sbaglia mai. La sicurezza di identificare un nuovo TREND non ha prezzo. DESCRIZIONE TRENDMAESTRO identifica un nuovo TREND sul nascere, questo indicatore prende in esame la volatilita' i volumi ed il momentum per identificare il momento in cui c'e' un'esplosione di uno 
    Black dragon indicator
    Ramil Minniakhmetov
    4.88 (130)
    L'indicatore di rilevamento delle tendenze integrerà qualsiasi strategia e può anche essere utilizzato come strumento indipendente. IMPORTANTE! Contattami subito dopo l'acquisto per ricevere istruzioni e un bonus! Raccomandazioni per lavorare con l'indicatore, puoi scaricare nel commento n Vantaggi Facile da usare, non sovraccarica il grafico con informazioni non necessarie; Possibilità di utilizzo come filtro per qualsiasi strategia; Ha livelli integrati di supporto e resistenza dinami
    TW Trend Sniper MT4
    Altan Karakaya
    5 (2)
    Presentazione dell'indicatore   "TW trend sniper"   , un potente indicatore che viene utilizzato per identificare le principali tendenze utilizzando l'esclusiva formula dell'indicatore   "Trade Wizards"   insieme all'uso dell'azione dei prezzi, al rilevamento delle sessioni di trading valutario, a Fibonacci e alle funzioni di rilevamento e metodi di rimozione del rumore dell'intelligenza artificiale con elevata precisione. questa strategia progettata dal   "gruppo Trade Wizards"   composto da
    Trend Forecasting
    Mohamed Hassan
    5 (20)
    This indicator is unstoppable when combined with our other indicator called Katana. After purchase, send us a message and you could get Katana for FREE as a BONUS After purchase, send us a private message for your instructions.  MT5 version: click here 3 copies left available at $45. Next price is $95. Don't miss this great deal!  The Trend Forecasting indicator is a very unique & easy tool that is able to make prediction about future price movement based on the signals generated
    Altri dall’autore
    Lo scopo di questo indicatore è trovare i livelli di Murray su tutti i timeframe e combinarli in livelli combo che includono livelli di segnale basati su forti livelli di Murray (+2, +1, 8, 4, 0, -1, -2). Più piccolo è il timeframe, maggiori sono le possibilità di vedere immediatamente il livello combo. Sarà evidenziato in colore. Se si posiziona il cursore su un numero qualsiasi, apparirà un tooltip che indicherà a quale timeframe appartiene il livello. Tuttavia, il timeframe corrente sarà semp
    Lo scopo di questo indicatore è trovare i livelli di Murray su tutti i timeframe e combinarli in livelli combo che includono livelli di segnale basati su forti livelli di Murray (+2, +1, 8, 4, 0, -1, -2). Più piccolo è il timeframe, maggiori sono le possibilità di vedere immediatamente il livello combo. Sarà evidenziato in colore. Se si posiziona il cursore su un numero qualsiasi, apparirà un tooltip che indicherà a quale timeframe appartiene il livello. Tuttavia, il timeframe corrente sarà semp
    UPD1 Volume BOX
    Vitaliy Kuznetsov
    5 (14)
    L'indicatore mostra il profilo del volume orizzontale nell'area specificata (BOX) e il volume massimo (POC). Caratteristiche del prodotto. 1. Puoi usare i tick o solo il prezzo. 2. Spaziatura della griglia adattiva (M1-MN). 3. Fase di ricerca adattiva ad alto volume (mediana) a seconda delle dimensioni della casella. 4. Colore camaleonte automatico per linee di scatole e pulsanti. 5. Caselle multiple, facili da creare ed eliminare. 6. Area del volume del 70% (abilitata nelle impostazioni). 7. 
    Pannello di trading con ordini preimpostati e calcolo automatico del lotto per il terminale MT4. Attenzione, il Trading Panel non funziona nel tester della strategia (solo il test del trailing stop). Manuale, Descrizione, Download Light Demo. I trader di successo si distinguono per l'autodisciplina e la gestione competente. Se usi un lotto fisso, allora sei a rischio. Dopotutto, in diversi intervalli di tempo, una distanza diversa e una transazione in perdita possono bloccare diversi profitti. S
    UPD1 Volume Cluster
    Vitaliy Kuznetsov
    4.81 (16)
    L'algoritmo trova le zone di volatilità ridotta in base all'indicatore UPD1 Trend Direction e traccia il volume orizzontale massimo in base all'indicatore UPD1 Volume Box . Di norma, un forte movimento di tendenza si verifica quando si esce dall'accumulo. Se il prezzo ha lasciato l'accumulo, può testare il suo volume orizzontale massimo (POC). Smart Alert sono disponibili nelle impostazioni. Parametri di input. Impostazioni di base. Bars Count – numero di barre della cronologia su cui verrà
    FREE
    UPD1 Profile Levels
    Vitaliy Kuznetsov
    5 (6)
    L'indicatore trova i livelli del volume di prezzo massimo e minimo (profilo di mercato) nell'istogramma di lavoro per il numero specificato di barre.   Profilo composito. L'altezza dell'istogramma è completamente automatica e si adatta a qualsiasi strumento e periodo di tempo. Viene utilizzato l'algoritmo dell'autore e non ripete analoghi noti. L'altezza dei due istogrammi è approssimativamente uguale all'altezza media della candela. Smart alert (smart alert) ti aiuta a comunicare il prezzo rel
    UPD1 Trend Direction
    Vitaliy Kuznetsov
    4.8 (10)
    Questo indicatore viene utilizzato per visualizzare le posizioni piatte e di tendenza. Il design si basa su un oscillatore. Viene utilizzato come filtro aggiuntivo, sia per il trading su un grafico normale che per le opzioni binarie. Le posizioni piatte vengono utilizzate nell'indicatore UPD1 volume Cluster per il trading secondo il concetto di Smart Money. Un avviso incorporato segnala i luoghi più ipercomprati / ipervenduti. Parametri di input. Impostazioni di base. Bars Count - specifica
    FREE
    UPD1 Impulse Level
    Vitaliy Kuznetsov
    5 (8)
    L'indicatore trova le onde impulsive sul grafico. Analizza la rottura del canale frattale e costruisce i livelli di impulso.  Inoltre, Trova i luoghi presunti Di false rotture e sequestro di liquidità. Nelle impostazioni, è possibile abilitare il dashboard multivaluta e selezionare qualsiasi strumento e intervallo di tempo. Avviso scegli tra il programma corrente o l'intero elenco. Ci sono segnali separati di impulso e falsa rottura. Blog-Link -  Retest and Fake Breakout with UPD1 . Modelli
    L'indicatore costruisce un semaforo a tre periodi e un pattern di inversione 123 dall'estremo. Il segnale arriva all'apertura della seconda candela. Questo pattern può essere negoziato in diversi modi (test point 3, breakout e altri). L'uscita dal canale o il breakout della trendline è il principale fattore scatenante per trovare un punto di ingresso. Le icone sono colorate in base ai livelli di Fibonacci. Le icone gialle indicano il test di un livello al quale il segnale è amplificato. Utilizz
    UPD1 Volume Pixel
    Vitaliy Kuznetsov
    5 (3)
    L'indicatore Trova il volume basso, alto, estremo in base ai coefficienti specificati e li colora nei colori specificati. Sostituisce la funzione di disegno del volume standard nel terminale metatrader. Le candele possono anche essere dipinte nel colore del volume. Sulle candele con volume estremo, viene determinato il volume orizzontale massimo (cluster/POC). A seconda della sua posizione (spinta, neutro, arresto), il cluster ha anche il suo colore. Se il cluster è in ombra e la candela ha un
    UPD1 Volume Footer
    Vitaliy Kuznetsov
    5 (9)
    L'indicatore mostra il volume verticale. Nelle impostazioni ci sono 2 fattori per determinare l'alto e l'estremo e 1 per determinare il basso volume. Un algoritmo simile viene utilizzato anche nell'indicatore UPD1 Volume Pixel . Quando viene rilevato un volume specificato, l'istogramma viene colorato nel colore corrispondente. La larghezza dell'istogramma viene selezionata automaticamente, a seconda della scala. Di norma, il prezzo reagisce al volume massimo e minimo. Ma è necessario utilizzare
    FREE
    UPD1 Volume TimeFrame POC
    Vitaliy Kuznetsov
    5 (3)
    L'indicatore visualizza il volume orizzontale massimo nel periodo di tempo selezionato. Basato sull'indicatore UPD1 Volume Box . Le linee possono essere collegate o separate. Nelle impostazioni, è possibile abilitare l'avviso Smart Touch. Tale indicatore sarà utile per coloro che commerciano utilizzando il profilo di mercato e il concetto di Smart Money. Parametri di input. Impostazioni di base. Bars Count - specifica il numero di barre su cui verrà disegnato TF POC. Data Source - periodo d
    FREE
    UPD1 Impulse Channel
    Vitaliy Kuznetsov
    5 (8)
    Un canale non disegnato per il trading di tendenza. È costruito dall'ATR e ha un limite di volatilità opposto. L'indicatore si è dimostrato valido nella strategia sui livelli di impulso e sui falsi breakout. Il punto di ingresso va cercato sulla correzione della linea dell'indicatore e il take profit va fissato sul confine opposto. Blog-Link -   Retest and Fake Breakout with UPD1 . Parametri di ingresso. Bars Count   - cronologia da visualizzare. ATR   - periodo di calcolo. Coefficient   -
    FREE
    UPD1 Rsi Dots Dashboard
    Vitaliy Kuznetsov
    5 (1)
    L'indicatore mostra segnali basati sull'oscillatore RSI terminale sul grafico. È possibile filtrare i segnali ripetuti. Qui l'oscillatore viene utilizzato per cercare un segnale inverso. È raccomandato come punto di ingresso nelle strategie swing e nel trading dai livelli. È disponibile una dashboard multi-valuta. Con esso, puoi facilmente passare da un grafico all'altro. Nelle discussioni sui prodotti, è possibile suggerire un algoritmo in cui è possibile incorporare un dashboard. Parame
    FREE
    UPD1 X00 Levels MT5
    Vitaliy Kuznetsov
    5 (1)
    L'indicatore mostra livelli circolari sul grafico. Sono anche chiamati livelli psicologici, bancari o dei principali operatori. A questi livelli si verifica una vera e propria lotta tra tori e orsi, l'accumulo di molti ordini, che porta a un aumento della volatilità. L'indicatore si adatta automaticamente a qualsiasi strumento e timeframe. Se il livello 80 viene rotto e poi testato, acquistare. Se il livello 20 viene rotto e poi testato, vendere. L'obiettivo è 00. Attenzione. A causa dei forti
    FREE
    UPD1 Profile Levels MT5
    Vitaliy Kuznetsov
    5 (3)
    L'indicatore trova i livelli del volume di prezzo massimo e minimo (profilo di mercato) nell'istogramma di lavoro per il numero specificato di barre.   Profilo composito. L'altezza dell'istogramma è completamente automatica e si adatta a qualsiasi strumento e periodo di tempo. Viene utilizzato l'algoritmo dell'autore e non ripete analoghi noti. L'altezza dei due istogrammi è approssimativamente uguale all'altezza media della candela. Smart alert (smart alert) ti aiuta a comunicare il prezzo rela
    UPD1 X00 Levels
    Vitaliy Kuznetsov
    4.92 (12)
    L'indicatore mostra livelli circolari sul grafico. Sono anche chiamati livelli psicologici, bancari o dei principali operatori. A questi livelli si verifica una vera e propria lotta tra tori e orsi, l'accumulo di molti ordini, che porta a un aumento della volatilità. L'indicatore si adatta automaticamente a qualsiasi strumento e timeframe. Se il livello 80 viene rotto e poi testato, acquistare. Se il livello 20 viene rotto e poi testato, vendere. L'obiettivo è 00. Attenzione. A causa dei forti
    FREE
    UPD1 Murrey Math Levels
    Vitaliy Kuznetsov
    5 (7)
    I livelli matematici di Murray si basano sulle osservazioni di Gann e sulla sua teoria della quadraticità dei prezzi. Secondo Gunn, il prezzo si muove in intervalli di 1/8. Questi 1/8 ci permettono di ottenere diversi livelli di resistenza e supporto per un dato grafico, che hanno le loro caratteristiche. Quando i livelli -2 o +2 vengono rotti o quando la volatilità diminuisce, vengono ricostruiti. È possibile scegliere il periodo da visualizzare (corrente o tutta la storia). Tutte le linee son
    FREE
    UPD1 D Levels
    Vitaliy Kuznetsov
    5 (1)
    L'indicatore dei livelli si basa sui dati del giorno precedente. La formula matematica determina i livelli di entrata e di uscita.  Raccomandazioni di trading. I livelli vengono negoziati all'inizio della sessione europea, quando appare la volatilità. In caso di volatilità insufficiente, utilizzare metà del take profit per uscire. Se il prezzo si è invertito a metà del take profit, allora sull'inversione cercate un target anche al livello di metà del take profit. Se il prezzo rimbalza dal liv
    FREE
    L'Average True Range ( ATR ) è una misura della volatilità del mercato in un determinato numero di giorni. Non ci si deve aspettare un grande movimento di continuazione quando il prezzo ha raggiunto la fine del range. Si ritiene che il mercato abbia esaurito il carburante. Se il prezzo non ha raggiunto il limite, ha ancora un margine di movimento. La formula dell'indicatore consente di calcolare i livelli High-Low sia in aggregato che singolarmente. È inoltre possibile utilizzare questi livelli
    FREE
    UPD1 Fibo Levels
    Vitaliy Kuznetsov
    5 (3)
    L'indicatore analizza il numero di candele specificato e costruisce i livelli di Fibonacci in base al massimo e al minimo. Poiché i livelli vengono ricostruiti, siamo interessati al lato destro dell'intervallo. Il prezzo è magnetico rispetto ai livelli e reagisce a un tocco. Utilizzate questo strumento per trovare un punto di ingresso nel trend dopo una correzione. Se a sinistra vediamo che i livelli sono perfettamente al rialzo, allora possiamo presumere di aver trovato la fine del movimento ne
    FREE
    UPD1 Pivot Levels
    Vitaliy Kuznetsov
    5 (3)
    L'indicatore mostra i classici livelli di pivot sul grafico, calcolati sulla base del giorno precedente. È possibile scegliere da quale ora calcolare la formula. Scambiate in un mercato piatto per l'inversione. In un mercato in trend, utilizzateli come target. Combinateli con le vostre strategie per un trading di successo. I livelli vengono costruiti utilizzando i buffer e visualizzati sull'intero storico delle quotazioni disponibili. Parametri di input. Start Hour - da quale ora considerar
    FREE
    UPD1 Pin Bar Dashboard
    Vitaliy Kuznetsov
    5 (2)
    L'indicatore visualizza il modello di candela della barra Pin. Le impostazioni del rapporto consentono di regolare facilmente il rapporto tra ombra, corpo e dimensione. È possibile filtrare per tendenza (2 medie mobili) e per inversione (RSI e bande di Bollinger). Questo è il modello più popolare di Price Action. Disponibile cruscotto multivaluta. Con esso, puoi passare facilmente da un grafico all'altro. Modelli di trading: Retest per tendenza. Falsa ripartizione. Terzo. EURUSD, GBPUSD, XA
    L'indicatore cerca le candele a impulso e le visualizza sul grafico. Include un filtro per le ombre. Trova anche i livelli di breakout delle Bande di Bollinger. È possibile attivare il cruscotto multivaluta nelle impostazioni. Per gli avvisi si può scegliere tra il grafico corrente o l'intero elenco. Blog-Link -  Retest and Fake Breakout with UPD1 Modelli di trading: Trend retest. Falso breakout. Altri. EURUSD, GBPUSD, XAUUSD, ... M15, M30, H1. Parametri di ingresso. Di base. Bars Count
    L'indicatore costruisce un semaforo a tre periodi e un pattern di inversione 123 dall'estremo. Il segnale arriva all'apertura della seconda candela. Questo pattern può essere negoziato in diversi modi (test point 3, breakout e altri). L'uscita dal canale o il breakout della trendline è il principale fattore scatenante per trovare un punto di ingresso. Le icone sono colorate in base ai livelli di Fibonacci. Le icone gialle indicano il test di un livello al quale il segnale è amplificato. Utilizz
    L'indicatore Cerca e visualizza automaticamente grandi ombre sul grafico in base alla volatilità. Le ombre sono ulteriormente filtrate dalla dimensione dell'onda. L'algoritmo analizza la rottura del frattale con un'ombra nell'intervallo specificato e visualizza il livello. Nelle impostazioni, è possibile abilitare il dashboard multi-valuta. L'avviso viene scelto tra il grafico corrente o l'intero foglio del dashboard. Segnali a grandi ombre e quelli che hanno sfondato il livello frattale posson
    L'indicatore visualizza il modello "Rails" sul grafico. Questo schema consiste in due candele multidirezionali con corpi identici e piccole ombre. Se sul timeframe corrente il pattern "Rails", sul timeframe x2 apparirà come una Pin Bar (Doji). Questo indicatore è stato creato per trovare automaticamente il pattern nel modo più efficiente, con impostazioni logicamente semplici che possono essere facilmente modificate. È possibile filtrare in base alla tendenza (2 medie mobili) e all'inversione (
    Un indicatore che visualizza il pattern candela inghiottendo. Nelle impostazioni, è possibile specificare il tipo di engulfing (corpo, ombra e combinazione). È possibile filtrare per tendenza (2 medie mobili) e per inversione (RSI e Bande di Bollinger). Questo è un modello di azione dei prezzi molto popolare. È disponibile una dashboard multi-valuta. Con esso, puoi facilmente passare da un grafico all'altro. Modelli di trading: Ripetere il test per tendenza. Falso breakout. Blocco ordine. Alt
    L'indicatore mostra un segnale sul grafico quando la seconda candela è all'interno della prima, cioè non ha superato i suoi limiti. Questo modello di candela è chiamato Inner Bar. Questo schema non è così popolare come la Pin Bar o il Engulfing, ma viene talvolta utilizzato da alcuni trader. Esiste la possibilità di filtrare per tendenza (2 medie mobili) e per inversione (RSI e Bande di Bollinger). È disponibile un pannello multivaluta. Con il suo aiuto è possibile passare facilmente da un graf
    Filtro:
    r127
    14
    r127 2024.02.07 03:50 
     

    muito bom... seria bem legal se tivesse pra mt5 também.

    Vitaliy Kuznetsov
    30378
    Risposta dello sviluppatore Vitaliy Kuznetsov 2024.02.07 07:09
    Obrigado pelo seu feedback
    Rispondi alla recensione
    Versione 2.35 2024.01.05
    compiled a new build 1400