• Panoramica
  • Recensioni
  • Commenti (2)

FX Market Dashboard

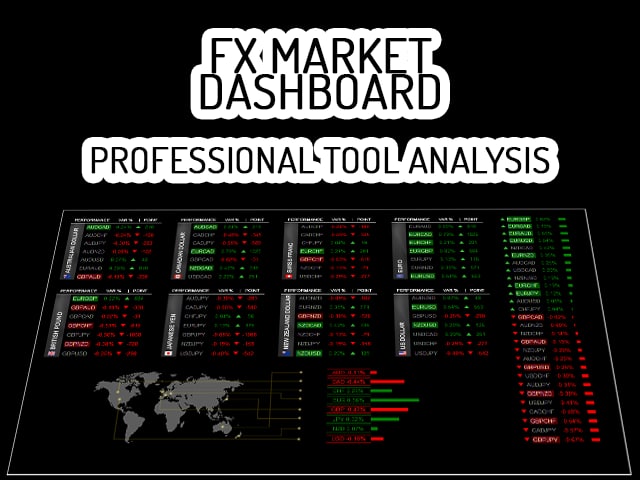
Fx Market Dashboard è uno strumento innovativo che presenta una grafica molto professionale.

Semplificare la lettura del mercato è sempre stata una nostra prerogativa e crediamo che con questo strumento tutti possano capire meglio il mercato.

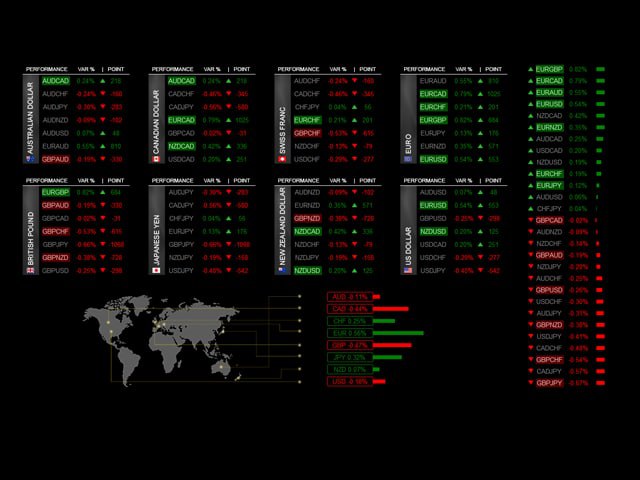
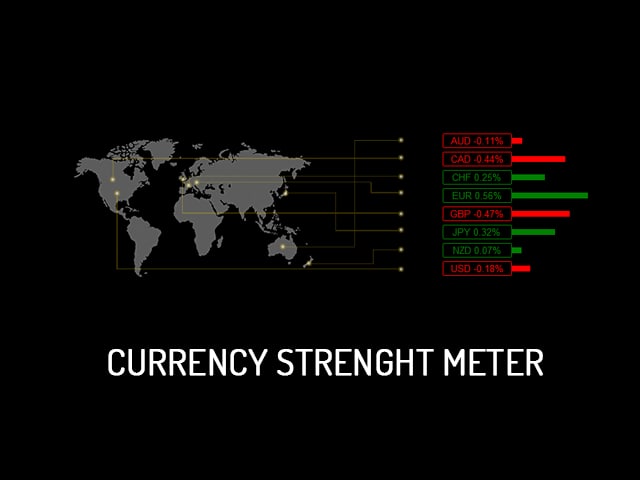
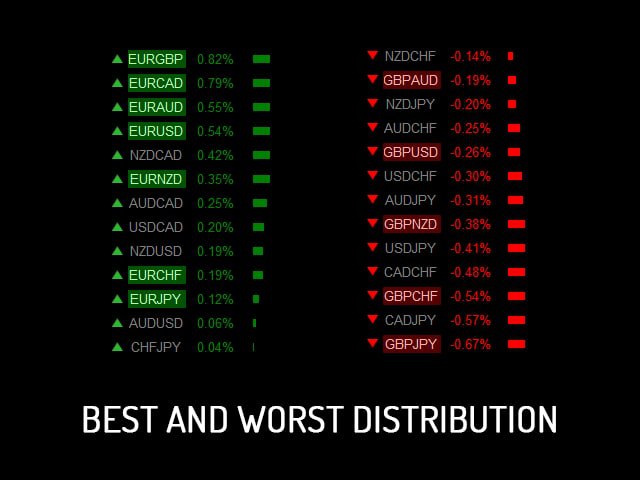
Questo strumento si occupa principalmente di darci una visione chiara di quali sono le valute più forti e più deboli, attraverso queste informazioni possiamo iniziare a capire meglio dove il mercato mette denaro o porta via denaro.

La lettura della logica percentuale serve ad avere precisione nella lettura della quantità di moto insieme alle informazioni dei breakout che confermano le spinte reali.

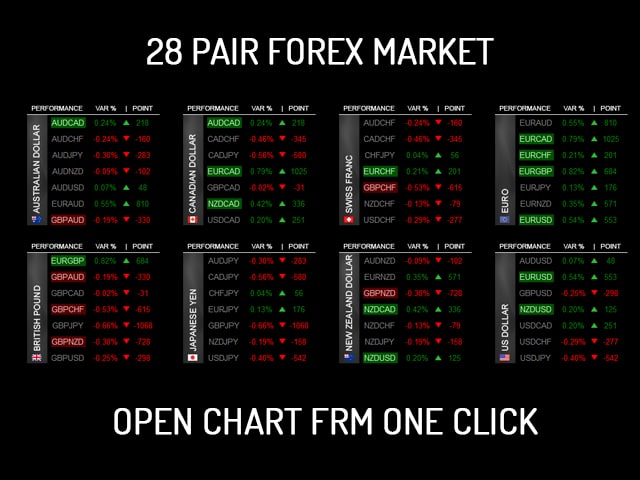
Una dashboard all-in-one dedicata ai trader del mercato valutario che offre tutto ciò di cui hai bisogno per comprendere e agire con precisione su tutti i mercati valutari.

La navigazione è molto semplice, basta cliccare sul nome della tua coppia preferita per aprire la carta di riferimento.

Ci auguriamo che ti piaccia Fx Market Dashboard e ti aiuti a comprendere meglio tutti i movimenti del mercato.

Buon trading a tutti e buoni guadagni costanti.

Valori di input:

  • NEW_CHART_TO_OPEN
    • Apri un nuovo grafico
    • Formato da aggiungere al grafico aperto (è possibile applicare un formato personalizzato al grafico aperto)


Prodotti consigliati
VR Cub
Vladimir Pastushak
VR Cub è un indicatore per ottenere punti di ingresso di alta qualità. L'indicatore è stato sviluppato per facilitare i calcoli matematici e semplificare la ricerca dei punti di ingresso in una posizione. La strategia di trading per la quale è stato scritto l'indicatore ha dimostrato la sua efficacia per molti anni. La semplicità della strategia di trading è il suo grande vantaggio, che consente anche ai trader alle prime armi di commerciare con successo con essa. VR Cub calcola i punti di apert
Noize Absorption Index MT4
Ekaterina Saltykova
5 (1)
Noize Absorption Index - is the manual trading system that measures the difference of pressure between bears forces and bulls forces. Green line - is a noize free index that showing curent situation. Zero value of index shows totally choppy/flat market.Values above zero level shows how powerfull bullish wave is and values below zero measures bearish forces.Up arrow appears on bearish market when it's ready to reverse, dn arrow appears on weak bullish market, as a result of reverse expectation. S
Owl smart levels
Sergey Ermolov
4.63 (54)
Versione MT5  |  FAQ L' indicatore Owl Smart Levels   è un sistema di trading completo all'interno dell'unico indicatore che include strumenti di analisi di mercato popolari come i   frattali avanzati di Bill Williams , Valable ZigZag che costruisce   la corretta struttura a onde   del mercato, e i   livelli di Fibonacci che segnano i livelli esatti di entrata nel mercato e luoghi per prendere profitti. Descrizione dettagliata della strategia Istruzioni per lavorare con l'indicatore Consulente-
Strong Retracement Points Pro demo edition! SRP (Strong Retracement/Reversal Points) is a powerful and unique support and resistance indicator. It displays the closest important levels which we expect the price retracement/reversal! If all level are broken from one side, it recalculates and draws new support and resistance levels, so the levels might be valid for several days depending on the market! If you are still hesitating to start using this wonderful tool, you can check this link to see h
Gold Level MT4
Aleksandr Makarov
Gold Level MT4 A great helper for trading Gold. Levels do not repaint and do not change their data Levels are built every day, so you will trade every day with the indicator. Gold Level. Price markups are shown on the chart, after reaching TP1 or SL1, close half of the position, and the rest is transferred to breakeven. Any questions? Need help?, I am always happy to help, write me in private messages or in telegram.
Title : Market Bias Indicator - Oscillator-Based Trading Tool Introduction : Discover the potential of the "Market Bias Indicator," a revolutionary oscillator-based trading tool designed for precise market analysis. If you're in search of a robust alternative to traditional bias indicators, your quest ends here. Market Bias Indicator offers unparalleled accuracy in identifying market sentiment and is your gateway to confident trading decisions. Recommended Trading Pairs : Market Bias Indicator i
The trading statistics indicator notifies the trader of the aggregate income of the trading account for different time intervals. The indicator has wide display settings on the graph. There is a choice of one of the two display languages on the chart- English and Russian. Settings Indicator language (ENG, RUS) - Select the language to display on the chart; To control the magic (-1: any magic) - Entering the Magic for control (-1: any Magic); Angle of indicator tie - Selecting the angle of the
Daily Candle Predictor è un indicatore che prevede il prezzo di chiusura di una candela. L'indicatore è destinato principalmente all'uso sui grafici D1. Questo indicatore è adatto sia per il trading forex tradizionale che per il trading di opzioni binarie. L'indicatore può essere utilizzato come sistema di trading autonomo o può fungere da aggiunta al sistema di trading esistente. Questo indicatore analizza la candela corrente, calcolando alcuni fattori di forza all'interno del corpo della cande
Infinity Trend Pro
Yaroslav Varankin
1 (1)
This is a trend indicator without redrawing Developed instead of the binary options strategy (by the color of the Martingale candlestick) Also works well in forex trading When to open trades (binary options) A signal will appear in the place with a candle signaling the current candle It is recommended to open a deal for one candle of the current timeframe M1 and M5 When a blue dot appears, open a deal up When a red dot appears, open a trade down. How to open trades on Forex. When a signal is rec
An indicator of pattern #31 ("Long Island") from Encyclopedia of Chart Patterns by Thomas N. Bulkowski. The second gap is in the opposite direction. Parameters: Alerts - show alert when an arrow appears   Push - send a push notification when an arrow appears (requires configuration in the terminal) GapSize - minimum gap size in points ArrowType - a symbol from 1 to 17 ArrowVShift - vertical shift of arrows in points   ShowLevels - show levels ColUp - color of an upward line ColDn - color of
The indicator displays the data of the Stochastic oscillator from a higher timeframe on the chart. The main and signal lines are displayed in a separate window. The stepped response is not smoothed. The indicator is useful for practicing "manual" forex trading strategies, which use the data from several screens with different timeframes of a single symbol. The indicator uses the settings that are identical to the standard ones, and a drop-down list for selecting the timeframe. Indicator Parame
Delta Pairs
Anatolii Zainchkovskii
1 (1)
Delta Pairs is an indicator for pair trading, it displays the divergence of two currency pairs. Does not redraw. A useful tool for the analysis of the behavior of two currency pairs relative to each other. Purpose The Delta Pairs indicator is designed for determining the divergences in the movements of two currency pairs. This indicator is displayed as two line charts and the difference (delta) between these charts in the form of a histogram. The Delta Pairs indicator will be useful for those
PipFinite Exit EDGE
Karlo Wilson Vendiola
4.89 (160)
Did You Have A Profitable Trade But Suddenly Reversed? In a solid strategy, exiting a trade is equally important as entering. Exit EDGE helps maximize your current trade profit and avoid turning winning trades to losers. Never Miss An Exit Signal Again Monitor all pairs and timeframes in just 1 chart www.mql5.com/en/blogs/post/726558 How To Trade You can close your open trades as soon as you receive a signal Close your Buy orders if you receive an Exit Buy Signal. Close your Sell orde
Utility per la gestione automatica degli ordini e dei rischi. Ti permette di trarre il massimo dai profitti e limitare le tue perdite. Creato da un trader praticante per i trader. L'utilità è facile da usare, funziona con qualsiasi ordine di mercato aperto manualmente da un trader o con l'aiuto di consulenti. Può filtrare gli scambi per numero magico. L'utilità può funzionare con qualsiasi numero di ordini contemporaneamente. Ha le seguenti funzioni: 1. Impostazione dei livelli di stop
Wave Wolf MT4
Andrei Salanevich
L'indicatore Forex Wave wold MT4 è progettato per cercare le onde di Woolf e visualizzarle nella finestra corrente del terminale di trading. Un ottimo indicatore per i trader che utilizzano le onde di Wolfe nel trading. La sua applicazione nelle strategie di trading aumenterà notevolmente la loro efficienza e redditività. INFORMAZIONI SULL'INDICATORE A differenza di altri indicatori onda Wold, indicatore Forex onda wold MT4 ha una serie di caratteristiche che aumentano notevolmente la sua eff
The Th3Eng PipFinite indicator is based on a very excellent analysis of the right trend direction with perfect custom algorithms. It show the true direction and the best point to start trading. With StopLoss point and Three Take Profit points. Also it show the right pivot of the price and small points to order to replace the dynamic support and resistance channel, Which surrounds the price. And Finally it draws a very helpful Box on the left side on the chart includes (take profits and Stop loss
Super Gator
Agustinus Biotamalo Lumbantoruan
This indi shows the following 1. Supertrend 2. Alligator (Not a regular alligator) 3. ZigZag 4. Moving Average 5. Trend Continuation/Mini correction Signal (plotted in X) (See screenshots in green background color 6. Early Signal Detection (See screenshots in green background color) You may treat Alligator as the lagging indicator The leading indicator is the supertrend. The zig zag is based on the leading indicator where it gets plotted when the leading indicator got broken to the opposite.
This multi time frame and multi symbol indicator alerts about Heiken Ashi Smoothed color changes. As a bonus it can also scan for Hull Moving Average trend (color) changes. Combined with your own rules and techniques, this indicator will allow you to create (or enhance) your own powerful trading system. Features Can monitor all symbols visible in your Market Watch window at the same time. Apply the indicator to just one chart and instantly monitor the entire market. Can monitor every time frame
PABT Pattern Indicator - it's classical system one of the signal patterns. Indicator logic - the Hi & Lo of the bar is fully within the range of the preceding bar, look to trade them as pullback in trend. In the way if indicator found PABT pattern it's drawing two lines and arrow what showing trend way.  - First line - it's entry point and drawing at: 1. On the high of signal bar or on middle of the signal bar (depending from indicator mode) for buy; 2. On the low of signal bar or on middle of t
Fibonacci retracement and extension line drawing tool Fibonacci retracement and extended line drawing tool for MT4 platform is suitable for traders who use  golden section trading Advantages: There is no extra line, no too long line, and it is easy to observe and find trading opportunities Trial version: https://www.mql5.com/zh/market/product/35884 Main functions: 1. Multiple groups of Fibonacci turns can be drawn directly, and the relationship between important turning points
PullbackMatrix provides the key information of the trading transactions when it finds the right market moment based on its built-in logic algorithm. The high accuracy signals including Trading Symbol, Entry Price, Entry Time, TakeProfit, Stoploss, and more. And that's all will be available instantly in your chart panel, drawing the position lines and also sending signal notification to email, mobile phone, and screen popup. More important is that also saves signals into a .csv file which is usef
Gioteen Volatility Index (GVI)   - your ultimate solution to overcoming market unpredictability and maximizing trading opportunities. This revolutionary indicator helps you in lowering your losing trades due to choppy market movements. The GVI is designed to measure market volatility, providing you with valuable insights to identify the most favorable trading prospects. Its intuitive interface consists of a dynamic red line representing the volatility index, accompanied by blue line that indicat
Blahtech Market Profile
Blahtech Limited
4.61 (18)
Was: $249  Now: $99   Market Profile defines a number of day types that can help the trader to determine market behaviour. A key feature is the Value Area, representing the range of price action where 70% of trading took place. Understanding the Value Area can give traders valuable insight into market direction and establish the higher odds trade. It is an excellent addition to any system you may be using. Blahtech Limited presents their Market Profile indicator for the MetaTrader community. Ins
Trendiness Index
Libertas LLC
5 (3)
"The trend is your friend" is one of the best known sayings in investing, because capturing large trendy price movements can be extremely profitable. However, trading with the trend is often easier said than done, because many indicators are based on price reversals not trends. These aren't very effective at identifying trendy periods, or predicting whether trends will continue. We developed the Trendiness Index to help address this problem by indicating the strength and direction of price trend
This is the FXTraderariel-TakeProfit - Stop Loss Indicator . It provides you 3 potential Take Profits and 1 Stop Loss. These potential targets are computed based on several methods . The indicator can be used on every time frame, but we advise to use it on H1, H4 and D1. Especially if you are a novice trader. Pro Traders can also you use it for scalping in smaller time frames (M1, M5 and M15). This indicator is not a complete trading system. It doesn't provide you a Signal nor can predict the m
The Funicular
Daniil Kurmyshev
The Funicular is a functional indicator knowing all the rules of the market and performing constructions more accurate and faster than any professional analyst.  The Funicular helps you see the exact points of the "entrance", and it draws trends with great accuracy determinig their strength and fluctuation time. The main difference from the others is that it builds lines that are independent of timeframe allowing you to perceive the chart as a whole. Simply put, you need The Funicular, because i
Master Scalping M1 è un indicatore innovativo che utilizza un algoritmo per determinare il trend in modo rapido e preciso. L'indicatore calcola il tempo di apertura e chiusura delle posizioni, gli algoritmi dell'indicatore consentono di trovare i momenti ideali per entrare in un trade (acquistare o vendere un asset), il che aumenta il successo delle transazioni per la maggior parte dei trader. Vantaggi dell'indicatore: Facile da usare, non sovraccarica il grafico con informazioni inutili. Può es
Forex Gump
Andrey Kozak
2.83 (6)
Forex Gump is a fully finished semi-automatic trading system. In the form of arrows, signals are displayed on the screen for opening and closing deals. All you need is to follow the instructions of the indicator. When the indicator shows a blue arrow, you need to open a buy order. When the indicator shows a red arrow, you need to open a sell order. Close orders when the indicator draws a yellow cross. In order to get the most effective result, we recommend using the timeframes H1, H4, D1. There
Shark Deal Book
Philip Pankaj Suthagar
4 (3)
Term  "shark"  in the business world denotes a high volume investor who just made a good investment in a highly Potential business deal.So, sharks are the ones who make the market move. In our case, if an American shark bought a Japanese company, he/she has to convert American dollars into Japanese yen to make the deal. So, the demand for the Japanese yen will increase sharply. Thus USD/JPY will go short rapidly if the deal was from the shark. Another example, In the case of forex, if fed increa
RSI Currency Strength Meter uses RSI (Relative Strength Index) to monitor how strong a currency is, or in other words, if it's being bought or sold by the majority compared to the other currencies. It displays the strength-lines of the currencies of the pair (base and counter currency of the chart) with changeable solid lines. Also, you can add up to five additional currencies to the "comparison pool". If you want to look and compare, for example, EUR, USD and JPY, it will only look at the EURUS
Gli utenti di questo prodotto hanno anche acquistato
Atomic Analyst
Issam Kassas
5 (1)
Innanzitutto, vale la pena sottolineare che questo indicatore di trading non è repaint, non è ridisegno e non presenta ritardi, il che lo rende ideale sia per il trading manuale che per quello automatico. L'Analista Atomico è un indicatore di azione del prezzo PA che utilizza la forza e il momentum del prezzo per trovare un miglior vantaggio sul mercato. Dotato di filtri avanzati che aiutano a rimuovere rumori e segnali falsi, e aumentare il potenziale di trading. Utilizzando più strati di in
Attualmente 20% di sconto! La soluzione migliore per ogni principiante o trader esperto! Questo software per cruscotti funziona su 28 coppie di valute. Si basa su 2 dei nostri indicatori principali (Advanced Currency Strength 28 e Advanced Currency Impulse). Offre un'ottima panoramica dell'intero mercato Forex. Mostra i valori di forza delle valute avanzate, la velocità di movimento delle valute e i segnali per 28 coppie Forex in tutti i (9) timeframe. Immaginate come migliorerà il vostro t
TPSpro RFI Levels
Roman Podpora
5 (13)
A key element in trading is zones or levels from which decisions to buy or sell a trading instrument are made. Despite attempts by major players to conceal their presence in the market, they inevitably leave traces. Our task was to learn how to identify these traces and interpret them correctly. Reversal First Impulse levels (RFI)   -  Version MT5                INSTRUCTIONS                 RUS                 ENG                                       R ecommended to use with an indicator   -  
Presentazione dell'indicatore Miraculous Forex: Libera il potere del trading preciso Sei stanco di cercare il miglior indicatore Forex che fornisca risultati eccezionali su tutti i timeframe? Non cercare oltre! L'indicatore Miraculous Forex è qui per rivoluzionare la tua esperienza di trading e portare i tuoi profitti a nuove vette. Basato su tecnologia all'avanguardia e anni di sviluppo accurato, l'indicatore Miraculous Forex si distingue come l'apice di potenza e precisione nel mercato delle v
TrendMaestro
Stefano Frisetti
5 (2)
nota: questo indicatore e' per METATRADER4, se vuoi la versione per  METATRADER5 questo e' il link:  https://www.mql5.com/it/market/product/108123 TRENDMAESTRO riconosce un nuovo TREND sul nascere, non sbaglia mai. La sicurezza di identificare un nuovo TREND non ha prezzo. DESCRIZIONE TRENDMAESTRO identifica un nuovo TREND sul nascere, questo indicatore prende in esame la volatilita' i volumi ed il momentum per identificare il momento in cui c'e' un'esplosione di uno  opiu' di questi dati
FX Volume
Daniel Stein
4.6 (35)
Ricevi il tuo aggiornamento quotidiano sul mercato con dettagli e schermate tramite il nostro Morning Briefing qui su mql5 e su Telegram ! FX Volume è il PRIMO e UNICO indicatore di volume che fornisce una visione REALE del sentiment del mercato dal punto di vista del broker. Fornisce informazioni straordinarie su come gli operatori di mercato istituzionali, come i broker, sono posizionati sul mercato Forex, molto più velocemente dei rapporti COT. Vedere queste informazioni direttamente sul vo
How to use Pair Trading Station Pair Trading Station is recommended for H1 time frame and you can use it for any currency pairs. To generate buy and sell signal, follow few steps below to apply Pair Trading Station to your MetaTrader terminal. When you load Pair Trading Station on your chart, Pair Trading station will assess available historical data in your MetaTrader platforms for each currency pair. On your chart, the amount of historical data available will be displayed for each currency pai
Cycle Sniper
Elmira Memish
4.4 (35)
NEW YEAR SALE PRICE FOR LIMITED TIME!!! Please contact us after your purchase and we will send you the complimentary indicators to complete the system Cycle Sniper is not a holy grail but when you use it in a system which is explained in the videos, you will feel the difference. If you are not willing to focus on the charts designed with Cycle Sniper and other free tools we provide, we recommend not buying this indicator. We recommend watching the videos about the indiactor and system before pu
TakePropips Donchian Trend Pro
Eric John Pajarillaga Aldana
4.82 (17)
TakePropips Donchian Trend Pro   (MT4) è uno strumento potente ed efficace che rileva automaticamente la direzione del trend utilizzando il canale Donchian e ti fornisce segnali di trading di entrata e uscita! Questo indicatore multifunzione include uno scanner di tendenza, segnali di trading, pannello statistico, screener, sessioni di trading e dashboard della cronologia degli avvisi. È progettato per fornirti segnali di trading e farti risparmiare ore analizzando i grafici! È possibile scarica
TPA True Price Action indicator reveals the true price action of the market makers through 100% non-repainting signals (except early signals mode) strictly at the close of a candle! TPA shows entries and re-entries, every time the bulls are definitely stronger than the bears and vice versa. Not to confuse with red/green candles. The shift of power gets confirmed at the earliest stage and is ONE exit strategy of several. There are available now two free parts of the TPA User Guide for our custo
Indicator : RealValueIndicator Description : RealValueIndicator is a powerful tool designed specifically for trading on the EURUSD pair. This indicator analyzes all EUR and USD pairs, calculates their real currency strength values, and displays them as a single realistic value to give you a head start on price. This indicator will tell you moves before they happen if you use it right. RealValueIndicator allows you to get a quick and accurate overview of the EURUSD currency pair tops and bottoms,
XQ Indicator MetaTrader 4
Marzena Maria Szmit
3 (2)
Step into the realm of Forex trading with confidence and precision using XQ, a cutting-edge Forex indicator designed to elevate your trading game to unprecedented heights. Whether you're a seasoned trader or just stepping into the world of currency exchange,   XQ Forex Indicator   empowers you with the insights and signals needed to make informed trading decisions. The signal conditions are a combination of three indicators, and XQ Forex Indicator only display  medium and long-term trends . The
Vi presentiamo ON Trade Waves Patterns Harmonic Elliot Wolfe, un indicatore avanzato progettato per rilevare vari tipi di pattern sul mercato utilizzando metodi sia manuali che automatici. Ecco come funziona: Pattern Armonici: Questo indicatore è in grado di individuare pattern armonici che appaiono sul vostro grafico. Questi pattern sono fondamentali per i trader che praticano la teoria del trading armonico, come descritta nel libro di Scott Carney "Harmonic Trading vol 1 & 2". Che li disegniat
Supply and Demand Dashboard PRO
Bernhard Schweigert
4.82 (22)
Attualmente 20% di sconto! Questo cruscotto è un software molto potente che lavora su più simboli e fino a 9 timeframe. Si basa sul nostro indicatore principale (migliori recensioni: Advanced Supply Demand ).   Il cruscotto offre un'ottima panoramica. Mostra:    Valori filtrati di domanda e offerta, compresa la valutazione della forza delle zone, distanze dei pip da/all'interno delle zone, Evidenzia le zone annidate, Fornisce 4 tipi di allarmi per i simboli scelti in tutti i (9) time-frames
Shepherd Harmonic Pattern
Abdullah Alrai
4.68 (59)
Questo indicatore rileverà modelli armonici disegnati sul grafico mediante metodi manuali e automatici. Puoi consultare il manuale dell'utente tramite questo link: Aggiungi la tua recensione e contattaci per ottenerlo. C'è una versione gratuita per provare questo prodotto su MT4. Puoi usarlo per rilevare i modelli di Gartley e Nenstar: https://www.mql5.com/en/market/product/30181 Puoi acquistare la versione completa di MT4 da: https://www.mql5.com/en/market/product/15212 Note L'indicatore ha un
Ultimate Sniper Dashboard
Hispraise Chinedum Abraham
4.84 (25)
Scontato a 299 dollari! I prezzi potrebbero aumentare in futuro! Leggi la descrizione qui sotto! Il miglior sistema di ingresso per la plancia Ultimate Sniper: LIVELLI DINAMICI FINALI. (Si prega di controllare i miei prodotti) L'Ultimate Sniper Dashboard funziona SOLO sui mercati live a causa dei limiti di test della MT4 multicurrency. Vi presentiamo l'Ultimate Sniper Dashboard! Il nostro migliore che contiene sia HA-Sniper, MA-Sniper e molte modalità speciali. Il cruscotto Ultimate Sni
PZ Day Trading
PZ TRADING SLU
3.67 (3)
This indicator detects price reversals in a zig-zag fashion, using only price action analysis and a donchian channel. It has been specifically designed for short-term trading, without repainting or backpainting at all. It is a fantastic tool for shrewd traders aiming to increase the timing of their operations. [ Installation Guide | Update Guide | Troubleshooting | FAQ | All Products ] Amazingly easy to trade It provides value on every timeframe It provides suitable SL and TP levels It impl
Please send me Direct message on MQL5 CHAT after purchasing the Indicator for Training and Installation Support There are some additional files that is important to use with the Indicator . So be sure to contact me after purchasing the Indicator So that I can add you for training and support . If you find any difficulty with installation then send me Direct message here So that I can connect with you via Anydesk or Teamview for the product installation. " Smart Order Block Indicator " to find
Gann Signal
Kirill Borovskii
Gann Signal is a very simple indicator at first glance, but hidden inside is many years of experience in studying W.D.Ganna methods. The indicator gives accurate BUY/SELL signals, without redrawing. The indicator is very easy to use. All you need to do is attach it to your chart and follow its recommendations. The indicator constantly analyzes the market for entry opportunities. When such an opportunity appears, the indicator gives a signal in the form of an arrow. I repeat, all signals are NOT
ON Trade Optuma Astro
Abdullah Alrai
5 (4)
Presentazione dell'Indicatore Astronomico per MT4: Il tuo compagno di trading celeste definitivo Sei pronto a elevare la tua esperienza di trading a livelli celesti? Non cercare oltre, il nostro rivoluzionario Indicatore Astronomico per MT4 è qui. Questo strumento innovativo va oltre gli indicatori di trading tradizionali, sfruttando algoritmi complessi per offrirti intuizioni astronomiche senza pari e calcoli di precisione. Un universo di informazioni a portata di mano: Ammira un pannello compl
Order Block Indicator MT4
Diego Arribas Lopez
5 (3)
[ MT5 Version ] Order Block Indicator MT4 Order Block Indicator MT4  is currently the most accurate and customizable indicator in the market. It has been developed to facilitate the analysis of operations based on Order Blocks and Supply and Demand Zones. These zones are possible reversal points of a movement. Order Blocks indicate a possible accumulation of orders in one area. The price usually gets to reach and react strongly to those areas. The most relevant levels for this reaction are the c
Candle Power Pro
Thushara Dissanayake
4.33 (6)
Sblocca la potenza delle informazioni sul volume reale con l'indicatore   Candle Power Pro   . Questo strumento dinamico acquisisce i dati del volume effettivo per ciascuna candela e li presenta come percentuale del volume totale. In tal modo, ti consente di discernere la lotta in corso tra acquirenti e venditori nel mercato. Candle Power Pro mostra la battaglia tra acquirenti e venditori come percentuale del volume totale, fornendo preziose informazioni sulle dinamiche di mercato. Puoi facilmen
Market Breaker Updated version 3
Allistair Kabelo Mandow
1 (1)
Features for software Main functions: Accurate entry signals WITHOUT REPAINTING! Once a signal appears, it remains valid! This is a significant distinction from repainting indicators that might provide a signal and then alter it, potentially leading to deposit losses. Now, you can enter the market with higher probability and precision. There's also a function to colour candles after an arrow appears until the target (take profit) is reached or a reversal signal appears . Display of STOP LOSS
Weis Wave with Alert
Trade The Volume Waves Single Member P.C.
4.79 (19)
Rental/Lifetime Package Options and Privileges' * For optimum results the yearly or lifetime package is suggested due to live training and Discord  channel trading with the  creator! Rent Monthly Six Months   Yearly/Lifetime Weis Wave with Speed with Alert+Speed Index x x x Manual  x x x Quick Set up Video x x x Blog x x x Lifetime Updates x x x Setup and Training Material x x Free Rectangle Break Alert Tool      x Discord Access Channel "The SI traders" x 2-hour live methodology traini
MartingaleArrow
Abdulkarim Karazon
Martingale Arrow è un indicatore mt4 di tipo freccia progettato per il trading di opzioni binarie martingala, questa freccia viene stampata sulla barra aperta/intra bar e fornisce un avviso. COME USARE: apri l'operazione nel momento in cui appare la freccia, se l'operazione è andata a buon fine, attendi il segnale successivo e scambia lo stesso lotto. Se l'operazione perde il doppio del lotto al segnale successivo e continua a farlo fino alla vittoria del segnale, reimposta e scambia con il pri
System Trend Pro
Aleksandr Makarov
System Trend Pro - This is the best trend trading indicator!!! The indicator no repaint!!!   The indicator has   MTF   mode, which adds confidence to trading on the trend (   no repaint   ). How to trade? Everything is very simple, we wait for the first signal (big arrow), then wait for the second signal (small arrow) and enter the market in the direction of the arrow. (See screens 1 and 2.) Exit on the opposite signal or take 20-30 pips, close half of it, and keep the rest until the oppo
40% DI SCONTO PER NATALE! AUMENTO DEL PREZZO A $250 IL 1 GENNAIO! Presentiamo GoldenGate Entries: una soluzione di trading all'avanguardia! Scopri un approccio rivoluzionario al trading con GoldenGate Entries (GGE), un indicatore avanzato progettato per migliorare la tua esperienza di trading. GGE offre un set completo di funzionalità per fornire agli utenti precisione e fiducia nelle loro decisioni di trading. Coppie: Qualsiasi (FX - Materie prime - Azioni - Azioni - Cripto) TimeFrame
Full STO
Roman Smoroda
Indicatore STO completo (include tutte le versioni dei tre indicatori STO: Premium, Gold, Silver) - STABLE TRADE OPTION è progettato per il trading automatico di opzioni binarie.  LEGGERE ATTENTAMENTE!!!!! IMPORTANTE In un terminale creare due modelli con scadenze diverse, un modello per le 18:01, 18:02 con scadenze da 1 a 15 minuti e un modello per le 22:00 con scadenze da 10 a 20 minuti. Tasso di vincita: 71% negli ultimi 5 anni. Gestione del denaro: 0,3% dal deposito Questa version
Connect Indicator
Sukunthakan Ngernbamrung
Connect Indicator is a tool used for connecting indicators between the MQL market and MT4. The connected indicators are made by our group and can be used for other applications, such as sending messages to the Line application or Telegram application. If you have any questions, please don't hesitate to ask us to receive support. Function and indicator buffer Buffer one is the high price of the previous candle. Buffer two is the high price of the previous candle. Usage To connect indicators to fu
Introduction to Fractal Pattern Scanner Fractal Indicator refers to the technical indicator that makes use of the fractal geometry found in the financial market. Fractal Pattern Scanner is the advanced Fractal Indicator that brings the latest trading technology after the extensive research and development work in the fractal geometry in the financial market. The most important feature in Fractal Pattern Scanner is the ability to measure the turning point probability as well as the trend probabi
Altri dall’autore
Navigator FX
Chantal Sala
5 (2)
The Navigator is a next-generation panel very easy to use. Apply this indicator on the chart to navigate very quickly through all the symbol and timeframes listed in input. The arrows manage the zoom and time frames. You can customize both the graphic colors and the list of symbols to display. A quick and easy tool that it will help to analyse the charts. Input Values Show_TF_Panel (true/false) it permits to show/hide panel with TF and Arrows 32 symbols COLORS AND SIZE SETTINGS BUTTON_WIDTH B
Time Range Separator  is a useful tool to display a separator period on your platform. You could go in the properties of the indicator, select the desired range and that's ALL. We believe it is a useful and necessary that we wish to share with you for free all our followers. Input Values: TimeFrame = Period Separator Separator_Color = Vertical Color Line Separator_Style = Vertical Color Style Separator_Width = Vertical Line Width Good trading to all and see you soon. Same indicator for MT4 her
FREE
Time Range Separator
Chantal Sala
4.78 (9)
Time Range Separator is a useful tool to display a separator period on your platform. You could go in the properties of the indicator, select the desired range and that's ALL. We believe it is a useful and necessary that we wish to share with you for free all our followers. Input Values: TimeFrame Period Separator GMT_Hour (ex. +1 or -1) to move the lines at Period Time +/- tot hours in input Hide_dates to show or hide the datetime on vertical lines VLine_Color = Vertical Color Line VLine_Styl
FREE
BreakEven Line è un indicatore molto utile e facile da usare. In caso di più posizioni aperte sullo stesso strumento, l'indicatore mostra il punto di pareggio dove è possibile chiudere le posizioni. La sua semplicità grafica lo rende uno strumento discreto e personalizzabile. Puoi abilitare/disabilitare una linea su un grafico, in modo da rendere invisibile l'indicatore. Input Mostra BE cumulativo (linea on/off) Colore della linea di pareggio (per cambiare il colore della linea) Stile
This is a utility to copy in Expert Advisor folder. The EA will force the download of your History Center MetaTrader. It will not download new data from your broker but it will aid your MT4 to charge every chart correctly. You can choose the symbols to download. After the launch, the EA will be removed automatically from the chart. After the launch, you can see results under Experts panel on MT4. The log will show you the data charged or not charged. Symbol TF = Number of candles charged. Ex: Su
FREE
Volume Spyke
Chantal Sala
5 (2)
The Volume Spike indicator is a useful tool to identify the directional market's intention. How Does It Work: The Volume Spike indicator identifies the volume peaks and creates a sensitive rectangle equipped with Alert and Warning Pop Up that it suggests the market's direction. This tool has the ability to select the time frame on which to do the analysis of volume and it gives a great visual signal colored into rectangle. The indicator can identify valid market signals but it can also suggest
HLOC
Chantal Sala
5 (3)
HLOC L'indicatore HLOC è un buon alleato per identificare correttamente l'andamento del prezzo. L'indicatore è progettato per essere minimamente invasivo e mostra un ausilio visivo e sonoro per prendere decisioni sul mercato. L'indicatore è dotato di avviso sonoro e avviso popup per avere un promemoria dei movimenti di prezzo. Ti consigliamo di guardare il video qui sotto per valutarne i vantaggi operativi. Valori di input: Mostra Linee (vero/falso) TimeFramePeriod (fare riferimento a
InfoPanelMarket
Chantal Sala
3.5 (4)
Informational indicator which shows: Swap Price under/upper Open for every Time Frame Spread Time to close the current candle Broker Time Net Change: delta in percentage from Open (MN-W1-D1) Tick Value Volumes Info for every trades open: Lots Breakeven Profit Buy-Profit Sell Equity Symbol Positive values are green and negative values are red (modifiable in input). Inputs: View BE line (enable/disable) View all Symbol (shows the list of symbol) Color (for every text) Line Color (for BE line)
One Click FX Panel
Chantal Sala
5 (2)
Questo pannello è molto semplice da usare ed è un ottimo alleato per gestire le tue posizioni e ordini. Puoi gestire tre tipi di rischio: lotto fisso, denaro e percentuale. Il lotto in percentuale ed in denaro viene calcolato a fronte dei punti di stoploss inseriti. Un click sul pulsante per cambiare modalità velocemente e l'operazione a mercato è inserita! Pulsanti: COMPRARE VENDERE BE: Pareggiare Diviso: chiude metà operazione X:  Chiudi tutte le posizioni §: Hedging (apertura posizione p
Volume POC
Chantal Sala
5 (3)
Volume POC L'indicatore Volume POC mostra livelli importanti. Puoi usarlo come un sistema di trading indipendente. Le funzioni di avviso alla chiusura di una candela ti consentono di avere alcune informazioni sulla direzione del mercato. La visualizzazione grafica è semplice ed efficace. I livelli riportati sono il risultato dello studio dei volumi storici di mercato. Questi livelli offrono ottimi punti di ingresso e ottimi livelli di supporto e resistenza. È possibile utilizzare l'in
Open All
Chantal Sala
The Open All indicator uses a simple market information that is "Open Candle". This tool is able to show all the openings of all time frames in order to extract information of strength and trendy. You can display 28 instruments with relative time frame interior for a total of 252 informations. The display is fully customizable, you can choose either the symbol and enable/disable Time Frames. Using it correctly you could get valuable aid to intercept correlations and turning points in the market.
The indicator Net Change is a very useful tool able to extrapolate a percentage in order to have a real reference on the performance of the instrument. This indicator is designed to show the main values: you could monitor the Daily, Weekly, Monthly, Quarterly, Semi-annual and Annual percentages. A necessary tool for those who want to really explore the quantitative logic of the market. Input values SYMBOLS SETTINGS Use_Only_Current_Symbol (true/false): Permits to manage only current symbol on
Best And Worst
Chantal Sala
5 (1)
The Best and Worst indicator (similar to Net Change Indicator) has the peculiarity of being a dynamic indicator. It seems a very Stock Exchange Indicator. This means that it is able to draw up a list and put in order the best and worst instruments in descending order. You can choose to show the percentage of any Time Frame: 1M, 5M, 15M, 30M, H1, H4 etc ... This instrument could really give great suggestions on your trading in order to center the right time and to have a total view of the markets
Delta Single Volume
Chantal Sala
3.25 (4)
Volume Delta is a very powerful indicator that reads the supply on the Market. It calculates the Delta from movement of the price and the difference of BUY and SELL Tick volumes. Its special structure allows you to get all timeframe values available on the MT4 platform. A good observation of this instrument can suggest great entry points and possible reversal. We are confident that this tool will help you to improve your trading timing. See also for MT5:  https://www.mql5.com/en/market/product/5
Volume Delta Panel
Chantal Sala
4.54 (13)
Volume DeltaPanel is a very powerful indicator that read the supply on Market. It calculates the Delta from movement of the price and the difference of BUY volumes and SELL volumes. The Volumes are added to price and normalized to symbol points. Its special structure allows you to get all Time Frames values available on the platform MT4. Panel can show 28 instruments simultaneously all customizable according to the offer of the Broker. A good observation of this instrument can suggest great en
Price Trend Light
Chantal Sala
4 (1)
Price Trend Light indicator is a beautiful indicator that shows purchasing areas and sales areas. This indicator is designed to follow the movement of the price which rounds on the opening price. It also provides information of trend follow on the break of the minimum and maximum. The indicator has a very simple graphic but effective, above the opening price you will have a light green color and under the opening price there is a red light. On every Break Out of the minimum or maximum sets in in
Power Strength
Chantal Sala
5 (1)
The indicator Power Strength creates a virtual display that takes data from all Symbols. It extrapolates all the informations in order to get the strength and / or weakness to take a decision on market. This tool works only on the Forex Market and not processing data on indices, metals ... It is graphically very attractive and its simplified information could give excellent input signals. You can use this indicator to find inputs on daily or short-term operations or scalping. Input Values PANE
Zoom Price It is a very useful tool that is designed to ZOOM the price positioning on one of the 4 corners of the graph. In addition to display function of the price indicator, Zoom Price is equipped with a check on Bullish or Bearish Breakout Signal that change the label color. Zoom Price is a simple tool that can provide useful informations to improve your operational performance. Input Values: myPeriod - TF to consider for Break Out O Signal LABEL SETTINGS Bullish BreakOut Color Bearish Break
Price Action DashBoard
Chantal Sala
4.17 (6)
The Price Action Dashboard is an innovative tool to help the trader to control a large number of financial instruments. This tool is designed to automatically suggest signals and price conditions. The Dashboard analyzes all major Time Frame suggesting price action conditions with graphic elements. The Dashboard can suggest you the strength of the trend identifying directional movement, it is an indispensable tool for those who want to open position themselves using market trends identifiers. The
Master Trend Dashboard
Chantal Sala
4.67 (3)
Master Trend Dashboard is a new generation indicator, compact, light and efficient. Each element of this Dashboard is designed to return specific signals as: Price Action, Breakout, Net Change (performance of the instrument), algorithmic studies, correlations and statistical calculations. This tool will change your way of trading allowing you to receive important information. See the Graphic Signals to understand every single signal below: Graphic Signals Symbol name and arrow color Green = Cu
Box Chart
Chantal Sala
5 (1)
The indicator Box Chart is a very useful analysis tool that allows you to know the value of the range in points. The range is written in a label and also it is draw in a rectangle. This indicator works on multi timeframe and you can upload more indicators on same chart to analyze more time frames ranges. The analysis of the range is done following W. G. Gann school. The observation of the range on little time frame returns some good information of trend or reversal. Box Chart is a simple indicat
Market Pressure is a next-generation display. Its simple and intuitive graphics system allows you to receive directions very easy and fast. This indicator can give three different methods of signals: Scalping, Intraday and Multiday. The logic is based on the price action which combined on multiple time frame. It can give very high quality signals. An indispensable tool for those who want to understand the market pressure and the operating trend. The indicator is customizable for both colors for
OCO News Order Manager in an Expert Advisor to Trading News . The usability makes this tool an excellent ally for FAST operations on NEWS Time. We recommend that you try it on demo account to understand what kind of decimals using your broker to set your input values. The EA is usable on every Markets. On news time the spread could be manage from Broker, please make attention. Main functionalities Open STOP PENDINGS ORDER a number of seconds (in input) before News Time Floating of pending orde
DAX Scalping Bracket
Chantal Sala
1 (1)
Dax Scalping Bracket is a new generation Expert Advisor Panel. This a very professional tool for SCALPING. The usability makes this tool an excellent ally for FAST operations of SCALPING on Index instruments and Forex market. The main feature of this EA is the ability to open multiple operations with a single click. Each position is autonomous and you can set different take profit and stop loss for each position. Special functionalities: STOP MOVE to manage your stop chasing the price BREAK EVEN
Bid Ask Level è un indicatore molto semplice ma, allo stesso tempo, molto potente. Utilizzando la logica del minimo e del massimo dei periodi precedenti è in grado di intercettare i livelli importanti di domanda e offerta. L'indicatore consente di impostare i numeri delle candele storiche per leggere livelli molto importanti nel passato e mostrarli nel grafico corrente. Puoi vedere questi livelli di potenza con linee orizzontali disegnate sul grafico. L'indicatore permette anche di cari
Market Pressure Dashboard is a new generation utility. Its main function is to assist you and give you operational ideas optimizing your analytical work. Using this utility you could monitor a lots of financial instruments (max 28 symbols FOREX) in a very simple way. The Market Pressure indicator allows you to customize the internal list of the symbols to be monitored. The opening function and position management with this panel will be much more comfortable and navigation charts very powerful.
L'indicatore Risk Reward è uno strumento molto utile che permette di osservare in tempo reale il rischio di performance di un trade. Il suo utilizzo è molto semplice, basta trascinarlo nel grafico e vedere la percentuale di Risk Reward (es: 1:2). Abbiamo previsto anche la possibilità di allungare/ridurre le linee al fine di rispettare i livelli di prezzo importanti. Puoi cambiare i tuoi livelli cliccando direttamente sulle linee e trascinando il livello in una nuova posizione. I livelli
Open Line
Chantal Sala
3 (1)
The Open Line indicator is a simple indicator that tracks the opening levels of more time sessions. This version allows the user to check the opening levels using different time time frames. It is possible to add on the same chart different Open Lines to have more important horizontal levels. The colors and lines are fully customizable also for the label text. A simple indicator but very powerful to give you a proper orientation for your trading. Input Values TimeFrame (to show the open price
Swing High Low
Chantal Sala
5 (2)
Swing High Low Pattern Recognition is a great indicator able to fix price levels and analyze the market swings. Swing High Low uses a dynamic approach of analysis that allows you to identify easily the best entry levels. The indicator using the minimum and maximum periods of the previous candles to analyze the impulsive movement and finally it sets the entry levels. The entry levels are: fast, good and best . The best is the last confirm of the swing. For a correct use we advise to wait the comp
Target Geometry
Chantal Sala
4.2 (5)
Target Geometry è un indicatore che utilizza la natura geometrica dei mercati per fornire alti livelli di probabilità statistica (Fibonacci). Questo indicatore crea una mappa molto utile sul grafico che ottimizza i punti di ingresso e definisce in modo ottimale la gestione del denaro. L'indicatore può essere utilizzato sia in modalità statica quindi sullo storico che in modalità dinamica sul periodo attuale. Funzionante su qualsiasi strumento finanziario. L'uso in modalità multi timeframe su più
Filtro:
Nessuna recensione
Rispondi alla recensione