• Panoramica
  • Recensioni (1)
  • Commenti

AIS Optimal TPSL MT5

5
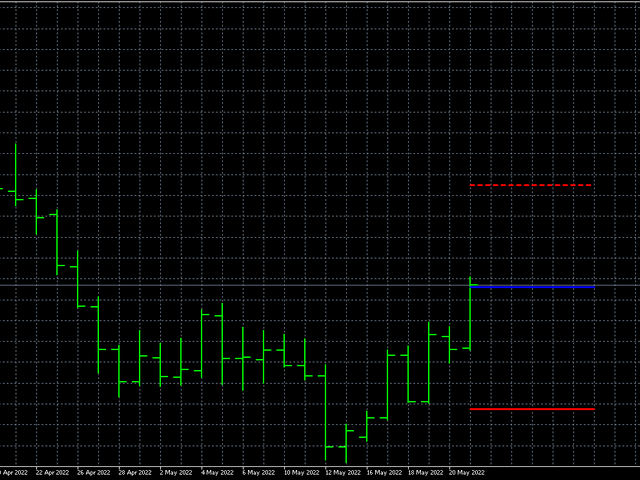
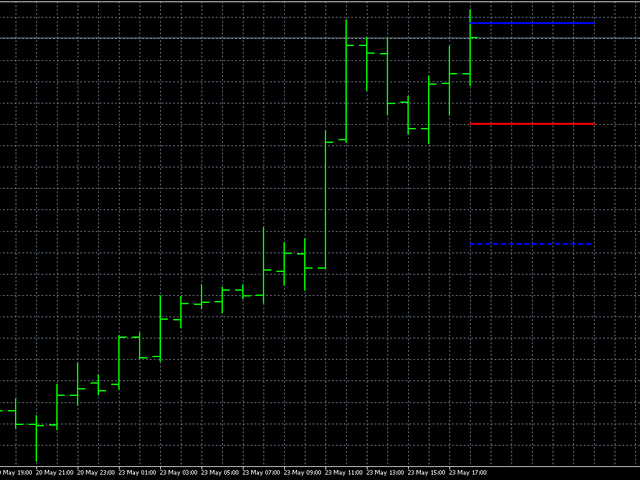
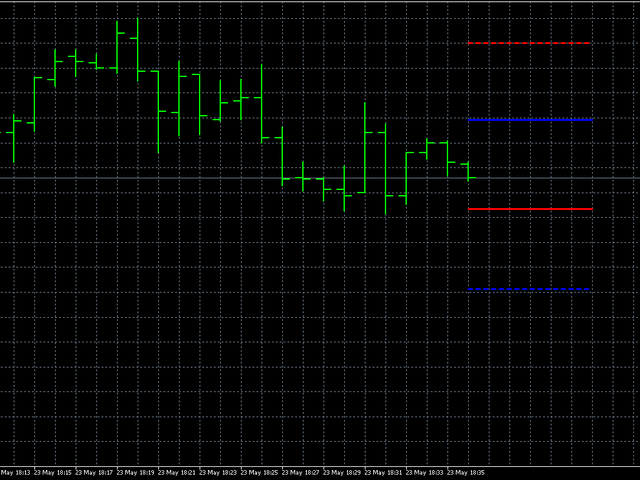
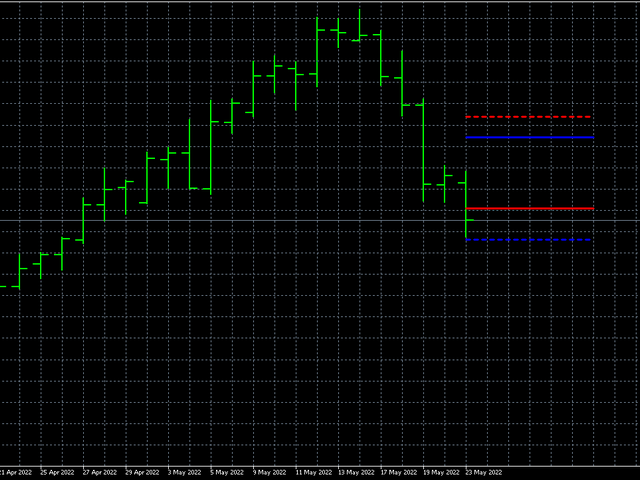
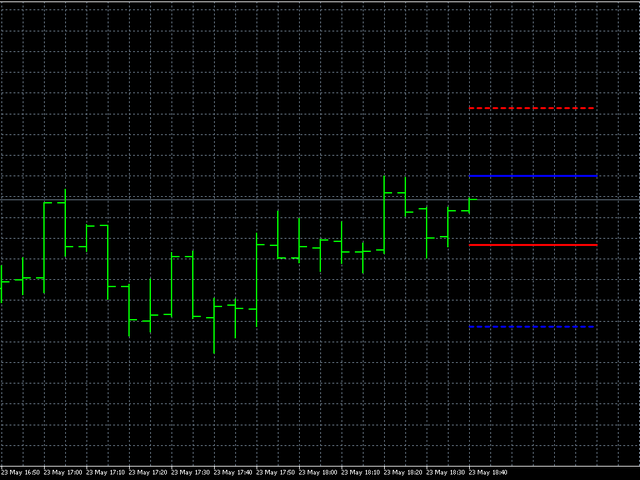
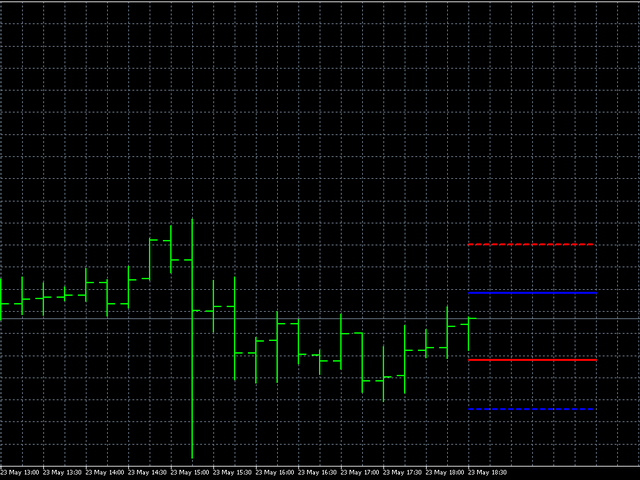
Questo indicatore mostra i livelli ottimali di take profit e stop loss. Questi livelli sono calcolati sulla base di dati storici. Al primo avvio, l'indicatore viene addestrato sulla cronologia. Dopodiché, valuta la probabilità che il prezzo superi questo o quel livello in futuro e seleziona le opzioni più ottimali per piazzare ordini stop. Ad esempio, i valori di take profit sono selezionati in modo che il profitto sia massimo e la probabilità che il prezzo raggiunga il suo livello sia la più alta possibile. Il livello di stop loss dovrebbe essere minimo, ma la probabilità di raggiungerlo dovrebbe essere minima. Ciò si traduce in livelli con la più alta aspettativa matematica possibile di vincita.
Inoltre, questo indicatore può essere utilizzato sotto forma di livelli di supporto e resistenza. Per fare ciò, puoi combinare diverse lunghezze e offset di previsione.
Parametri dell'indicatore:
  • Lunghezza - lunghezza prevista. Questo parametro indica la durata prevista del futuro scambio di lingotti.
  • Maiusc - cambia in barre. Grazie a questo parametro è possibile visualizzare le letture degli indicatori in passato.
  • Larghezza - larghezza della linea.
  • ClrBuy - colore della linea per le posizioni di acquisto.
  • ClrSell - colore della linea per le posizioni di vendita.
  • StyleTP - stile di linea per il profitto.
  • StyleSL - stile di linea per stop loss.
  • Info: quando questa opzione è abilitata, i valori di stop loss e take profit verranno visualizzati nella scheda "Esperti" del terminale.


Recensioni 1
220072256
3596
220072256 2022.05.27 12:39 
 

This person is a great person !! He is a mathematical scientist who adapts his calculations to trading. I have many profits thanks to the indicators of him !!

Prodotti consigliati
Pendora 100
Ayanda Mhlauli
Synthetic indices are defined artificial financial instruments that were created to mimic real-world market movements in different markets based on a random number generator that is secured through cryptography. This mechanism is used to prevent market manipulation and improve financial transparency. Background About EA The Pandora is the is the first EA of The Alpha Phoenix Academy. This is version 2 of the Pandora 100x The Pandora 100x only trades the Volatility 100 index. In my understandin
Gecko EA MT5
Profalgo Limited
5 (1)
NEW PROMO: Only a few copies copies available at 349$ Next price: 449$ Make sure to check out our " Ultimate EA combo package " in our   promo blog ! Gecko runs a simple, yet very effective, proven strategy.  It looks for important recent support and resistance levels and will trade the breakouts.  This is a "real" trading system, which means it will use a SL to protect the account.  It also means it will not use any dangerous techniques like martingale, grid or averaging down. The EA shows its
This is my trusted friend of trading. So... I musted re-write this in MQL5 to use in brokers where there is only MT5. The indicator is like a mother-in-law, who talks often, talks a lot and often inappropriately. The indicator, in addition to giving us an entry signal on parameters which I will then list, monitors the trend of the hourly timeframe, OSMA to understand the entry direction, RSI to sense any overbought or oversold conditions from which to abstain, ATR for the volatility and ADX
Introduction to Chart Pattern MT Chart Pattern MT is a chart pattern scanner to detect the triangle pattern, falling wedge pattern, rising wedge pattern, channel pattern and so on. Chart Pattern MT uses highly sophisticated chart pattern detection algorithm. However, we have designed it in the easy to use with intuitive user interface. Chart Pattern MT will show all the patterns in your chart in the most efficient format for your trading. You do not have to do tedious manual pattern detection an
The B150 model is a fully revised version of the Historical Memory indicator with a significantly improved algorithm. It also features a graphical interface what makes working with this perfect tool quick and convenient. Indicator-forecaster. Very useful as an assistant, acts as a key point to forecast the future price movement. The forecast is made using the method of searching the most similar part in the history (patter). The indicator is drawn as a line that shows the result of change of the
The "No Reversal Accumatrix AI" is a cutting-edge MetaTrader 5 indicator designed to assist traders in confirming trends without the inconvenience of repainting. Built upon advanced artificial intelligence algorithms, this indicator offers a reliable tool for identifying and validating trends in financial markets. Key Features: Non-Repainting Technology : Unlike traditional indicators prone to repainting, the "No Reversal Accumatrix AI" utilizes innovative algorithms to provide accurate trend co
Trend Hunter MT5
Andrey Tatarinov
5 (1)
Trend Hunter è un indicatore di tendenza per lavorare nei mercati Forex, criptovaluta e CFD. Una caratteristica speciale dell'indicatore è che segue con sicurezza la tendenza, senza cambiare il segnale quando il prezzo supera leggermente la linea di tendenza. L'indicatore non viene ridisegnato; un segnale per entrare nel mercato appare dopo la chiusura della barra. Quando ci si sposta lungo un trend, l'indicatore mostra ulteriori punti di ingresso nella direzione del trend. Sulla base di ques
The Smart Sniper Entry XTREEM Spike Detector is a cutting-edge indicator specifically designed for traders who focus on the volatile Boom and Crash markets. This powerful tool detects spikes with an impressive 85% accuracy when combined with price action analysis. *Key Features:* - *High Accuracy:* 85% accuracy in detecting spikes, ensuring you can make informed trading decisions - *Market Specific:* Optimized for Boom and Crash markets, providing precise signals in these volatile environme
PAX3 Price Action Indicator
Marco Aurelio Santos Costa
5 (5)
You probably won't see the power of the indicator in the backtest, because it uses 3 windows, something you can't do, in the DEMO version that the site offers.  I trust 100% on my work and on my indicator, if you want a test version, send me a message, different from other sellers, who just want to "sell", I want whether you have a full version before renting and deciding. Christmas Discount 30% off until the 25th As you can imagine, it was a failure, I'm not saying that any indicator doesn't w
Il livello Premium è un indicatore unico con una precisione superiore all'80% delle previsioni corrette! Questo indicatore è stato testato dai migliori Specialisti di Trading per più di due mesi! L'indicatore dell'autore che non troverai da nessun'altra parte! Dagli screenshot puoi vedere di persona la precisione di questo strumento! 1 è ottimo per il trading di opzioni binarie con un tempo di scadenza di 1 candela. 2 funziona su tutte le coppie di valute, azioni, materie prime, cript
Owl Smart Levels MT5
Sergey Ermolov
4.49 (37)
Versione MT4  |  FAQ L' indicatore Owl Smart Levels è un sistema di trading completo all'interno dell'unico indicatore che include strumenti di analisi di mercato popolari come i frattali avanzati di Bill Williams , Valable ZigZag che costruisce la corretta struttura a onde del mercato, e i livelli di Fibonacci che segnano i livelli esatti di entrata nel mercato e luoghi per prendere profitti. Descrizione dettagliata della strategia Istruzioni per lavorare con l'indicatore Consulente-assistente
PZ Trend Trading MT5
PZ TRADING SLU
3.67 (3)
Trend Trading is an indicator designed to profit as much as possible from trends taking place in the market, by timing pullbacks and breakouts. It finds trading opportunities by analyzing what the price is doing during established trends. [ Installation Guide | Update Guide | Troubleshooting | FAQ | All Products ] Trade financial markets with confidence and efficiency Profit from established trends without getting whipsawed Recognize profitable pullbacks, breakouts and early reversals The ind
Smart Moving Averages Indicator Smart Moving Averages is an exclusive indicator for Metatrader platform. Instead of calculating moving averages for the selected chart time frame, the Smart Moving Averages indicator gives you the opportunity to calculate moving averages independently from the chart time frame. For instance you can display a 200 days moving average in a H1 chart. Inputs of the indicator are: Timeframe : timeframe to be used for the calculation of the moving average Perio
Point Black
Ignacio Agustin Mene Franco
Black Card Pack indicator 5/1 point black It has the strategy of professional bollingers where each arrow gives you a different entry signal. It is used to operate in m1 and in d1 It is used for scalping and intraday, modified for forex markets ! suitable for all pairs modified for synthetic index markets suitable for all pairs! Ideal for volatility and jumps!
An Ultimate Tool  for quick and efficient market analysis. Unique combination of solid indicators defining market direction for trend tracking and filtration designed for you to stay on the   right   side of the market. Market Rider Tools   gives you access to one of the most used from professional trades indicators on worldwide, which were not build in for MT4 and MT5 terminals . These are unique non-repainting indicators designed to be used on all time frames for all instruments classes: Fo
Point of Interest MT5
Scott Edward Merritt
What is a Point of Interest? Traders who follow Smart Money Concepts may call this a Liquidity Point, or areas pools of liquidity have been built up by retail traders for for Big Banks to target to create large price movements in the market. As we all know, retail traders that use outdated and unreliable methods of trading like using trendlines, support and resistance, RSI, MACD, and many others to place trades and put their stop losses at keys points in the market. The "Big Banks" know these me
L'indicatore costruisce le quotazioni attuali, che possono essere confrontate con quelle storiche e su questa base fanno una previsione del movimento dei prezzi. L'indicatore ha un campo di testo per una rapida navigazione fino alla data desiderata. Opzioni: Simbolo - selezione del simbolo che visualizzerà l'indicatore; SymbolPeriod - selezione del periodo da cui l'indicatore prenderà i dati; IndicatorColor - colore dell'indicatore; HorisontalShift - spostamento delle virgolette d
High Tech EA Audcad
German Mazzaferro
This high quality, high tech EA detects reversions in AUDCAD H4 In longs, you will have a dynamic and complex way of closing trades that gives a very high winrate, while in shorts is simple but still has . Taking in consideration market dynamics. Longs and shorts should be treated always differently. Also longs and shorts have different indicators to get in, while the idea is the same. It is truly a high tech EA. Pros: Precise, high winrate (88% and more), dynamic open and close of trades, mo
Orbit Rage Final 2
BILLY ARANDUQUE ABCEDE
Note : i only sell this EA on MQL5, any other sellers is fake. Orbit Rage Final, a cutting-edge trading strategy meticulously designed around the bull/bear candle approach and divergence analysis. This powerful tool is engineered to empower you to shape the life you desire. To embark on this transformative journey, simply download and seamlessly integrate it into your MetaTrader 4 platform by placing it in the experts advisors folder. Orbit Rage Final revolutionizes trading by offering a risk-f
Price 177 is set for a limited time then price 315 The uniqueness of this expert is that he uses one common set. for most Expert Advisors, this is not applicable and will not work because most Expert Advisors have either sets that you can download yourself or embedded in the code for each currency pair. This Expert Advisor uses only 1 set for all 20 currency pairs. I differ from many developers in that I continue. improve your products. The main goal is to make such products that u
The indicator detects divergence signals - the divergences between the price peaks and the MACD oscillator values. The signals are displayed as arrows in the additional window and are maintained by the messages in a pop-up window, e-mails and push-notifications. The conditions which formed the signal are displayed by lines on the chart and in the indicator window. The indicator parameters MacdFast - fast MACD line period MacdSlow - slow MACD line period MacdSignal - MACD signal line period Mac
Win43 Scalper
Eadvisors Software Inc.
O novo s43 Scalper para Mini-Índice (WIN-IND) faz operações de curto prazo no timeframe 1min buscando pequenas variações do mercado, utiliza nova tecnologia de trade, os resultados no intraday são íncríveis, confira:      Após a instalação adicione no gráfico dos instrumentos win para visualizar os resultados no backteste. Recomendamos o timeframe de 1min.
Smooth price for Monarch
Konstantin Gruzdev
5 (1)
The Smooth Price technical indicator is used for plotting a smoothed line as close to the price of the financial instrument as possible, and serves to eliminate its noise components. The indicator is part of the Monarch trading system, but here it is presented as an independent technical analysis tool. The indicator is based on the cluster digital filter , which, unlike the ClusterSMA , is applied directly to the price time series. Smooth Price does not redraw (except the very last, zero bar) an
Every indicator has its advantages and disadvantages. Trending ones show good signals during a trend, but lag during a flat. Flat ones thrive in the flat, but die off as soon as a trend comes. All this would not be a problem, if it was easy to predict when a flat changes to a trend and when a trend changes to a flat, but in practice it is an extremely serious task. What if you develop such an algorithm, which could eliminate an indicator's flaws and enhance its strengths? What if such an algorit
Gioteen Volatility Index (GVI) - your ultimate solution to overcoming market unpredictability and maximizing trading opportunities. This revolutionary indicator helps you in lowering your losing trades due to choppy market movements. The GVI is designed to measure market volatility, providing you with valuable insights to identify the most favorable trading prospects. Its intuitive interface consists of a dynamic red line representing the volatility index, accompanied by blue line that indicate
Passage Victorious is a handy tool, and even if you are used to trading on a clean chart, sometimes you need to take a look at this indicator. If you are not sure how to determine the trend inflection point and are concerned about how to draw trend lines then this indicator is for you. From now on, you do not need to sit near the computer and analyze the price, just use this indicator. The indicator calculates saturation levels of the price chart. A signal to exit the oversold area is a buy s
TransitBlueOcean
Bonginkosi Innocent Khumalo
5 (1)
TransitBlueOcean is indicator system that uses ocean wave's pattern, to help one to know when to buy and when to sell. The indicator system is very powerful like the ocean waves. Join the mql5 channel for TransitBlueOcean  https://www.mql5.com/en/channels/transitblueocean   How to use: Zoom in so that the Ocean will appear on your chart. Buy when you see the candles, the candle will be above the ocean wave (buying signal). Sell when you can't see the candles, the candles will be inside the w
The  DYJ Williams Percent Range  is a unique High quality and easy to use and affordable trading tool because we have incorporated a number of proprietary features and  Williams' Percent Range  indicators. The Indicator values ranging between -80% and -100% indicate that the market is oversold. Indicator values ranging between -0% and -20% indicate that the market is overbought.  Input Parameters  WPR  settings InpSpread = 50 -- When the spread is greater than or equal to 50, the signal is ignor
Forxe
Mussadiq Abdul Rahim
Informazioni generali Vi presentiamo il nostro indicatore di analisi tecnica all'avanguardia che predice le tendenze utilizzando molteplici fonti dai grafici tecnici, appositamente sviluppato per le coppie di valute EURUSD, EURJPY ed EURGBP nel mercato forex. Questo strumento all'avanguardia è progettato per fornire ai trader informazioni accurate e affidabili sulle potenziali tendenze di mercato e sulle variazioni dei prezzi, consentendo loro di prendere decisioni consapevoli riguardo alle prop
Introducing "X Marks the Spot" – Your Ultimate MetaTrader 5 Indicator for Perfect Trades! Are you tired of the guesswork in trading? Ready to take your MetaTrader 5 experience to a whole new level? Look no further – "X Marks the Spot" is here to revolutionize your trading strategy! What is "X Marks the Spot"? "X Marks the Spot" is not just another indicator – it's your personal trading compass that works seamlessly on all timeframes . Whether you're a beginner or an experienced trader,
Gli utenti di questo prodotto hanno anche acquistato
Atomic Analyst MT5
Issam Kassas
5 (12)
Innanzitutto, vale la pena sottolineare che questo indicatore di trading non è repaint, non è ridisegno e non presenta ritardi, il che lo rende ideale sia per il trading manuale che per quello automatico. L'Analista Atomico è un indicatore di azione del prezzo PA che utilizza la forza e il momentum del prezzo per trovare un miglior vantaggio sul mercato. Dotato di filtri avanzati che aiutano a rimuovere rumori e segnali falsi, e aumentare il potenziale di trading. Utilizzando più strati di in
Innanzitutto è importante sottolineare che questo sistema di trading è un indicatore Non-Repainting, Non-Redrawing e Non-Lagging, il che lo rende ideale sia per il trading manuale che per quello automatico. Corso online, manuale e download di preset. Il "Sistema di Trading Smart Trend MT5" è una soluzione completa pensata sia per i trader principianti che per quelli esperti. Combina oltre 10 indicatori premium e offre più di 7 robuste strategie di trading, rendendolo una scelta versatile per div
FX Volume MT5
Daniel Stein
4.94 (17)
Ricevi il tuo aggiornamento quotidiano sul mercato con dettagli e schermate tramite il nostro Morning Briefing qui su mql5 e su Telegram ! FX Volume è il PRIMO e UNICO indicatore di volume che fornisce una visione REALE del sentiment del mercato dal punto di vista del broker. Fornisce informazioni straordinarie su come gli operatori di mercato istituzionali, come i broker, sono posizionati sul mercato Forex, molto più velocemente dei rapporti COT. Vedere queste informazioni direttamente sul vo
Quantum Trend Sniper
Bogdan Ion Puscasu
5 (39)
Presentazione       Quantum Trend Sniper Indicator   , l'innovativo indicatore MQL5 che sta trasformando il modo in cui identifichi e scambi le inversioni di tendenza! Sviluppato da un team di trader esperti con un'esperienza di trading di oltre 13 anni,       Indicatore Quantum Trend Sniper       è progettato per spingere il tuo viaggio di trading verso nuove vette con il suo modo innovativo di identificare le inversioni di tendenza con una precisione estremamente elevata. *** Acquista Quant
Presentazione       Quantum Breakout PRO   , l'innovativo indicatore MQL5 che sta trasformando il modo in cui scambi le zone di breakout! Sviluppato da un team di trader esperti con un'esperienza di trading di oltre 13 anni,       Quantum Breakout PRO       è progettato per spingere il tuo viaggio di trading a nuovi livelli con la sua strategia innovativa e dinamica della zona di breakout. Quantum Breakout Indicator ti fornirà frecce di segnalazione sulle zone di breakout con 5 zone target
RelicusRoad Pro MT5
Relicus LLC
4.82 (22)
Ora $ 147 (aumentando a $ 499 dopo alcuni aggiornamenti) - account illimitati (PC o MAC) Manuale utente di RelicusRoad + Video di formazione + Accesso al gruppo Discord privato + Stato VIP UN NUOVO MODO DI GUARDARE IL MERCATO RelicusRoad è l'indicatore di trading più potente al mondo per forex, futures, criptovalute, azioni e indici, fornendo ai trader tutte le informazioni e gli strumenti di cui hanno bisogno per rimanere redditizi. Forniamo analisi tecniche e piani di trading per aiutar
A key element in trading is zones or levels from which decisions to buy or sell a trading instrument are made. Despite attempts by major players to conceal their presence in the market, they inevitably leave traces. Our task was to learn how to identify these traces and interpret them correctly. Reversal First Impulse levels (RFI)   -  Version MT4                  INSTRUCTIONS                 RUS                 ENG                         R ecommended to use with an indicator   -  TREND PRO  
FX Power MT5 NG
Daniel Stein
5 (5)
Ricevi il tuo aggiornamento quotidiano sul mercato con dettagli e schermate tramite il nostro Morning Briefing qui su mql5 e su Telegram ! FX Power MT5 NG è la nuova generazione del nostro popolare misuratore di forza delle valute, FX Power. Cosa offre questo misuratore di forza di nuova generazione? Tutto ciò che avete amato dell'FX Power originale IN PIÙ Analisi della forza di ORO/XAU Risultati di calcolo ancora più precisi Periodi di analisi configurabili individualmente Limite di calcolo pe
Advanced Supply Demand MT5
Bernhard Schweigert
4.53 (15)
La migliore soluzione per qualsiasi principiante o trader esperto! Questo indicatore è uno strumento di trading unico, di alta qualità e conveniente perché abbiamo incorporato una serie di funzionalità proprietarie e una nuova formula. Con questo aggiornamento, sarai in grado di mostrare fusi orari doppi. Non solo potrai mostrare una TF più alta, ma anche entrambe, la TF del grafico, PIÙ la TF più alta: SHOWING NESTED ZONES. Tutti i trader di domanda di offerta lo adoreranno. :) Informazioni imp
TPSproTREND PrO MT5
Roman Podpora
5 (6)
TPSpro TRENDPRO  - is a trend indicator that automatically analyzes the market and provides information about the trend and each of its changes, as well as giving signals for entering trades without redrawing! The indicator uses each candle, analyzing them separately. referring to different impulses - up or down impulse. Exact entry points into transactions for currencies, crypto, metals, stocks, indices!  -  Version MT4                  DETAILED DESCRIPTION        /       TRADING SETUPS       
This is arguably the most complete harmonic price formation auto-recognition indicator you can find for the MetaTrader Platform. It detects 19 different patterns, takes fibonacci projections as seriously as you do, displays the Potential Reversal Zone (PRZ) and finds suitable stop-loss and take-profit levels. [ Installation Guide | Update Guide | Troubleshooting | FAQ | All Products ] It detects 19 different harmonic price formations It plots primary, derived and complementary Fibonacci p
Noize Absorption Index - is the manual trading system that measures the difference of pressure between bears forces and bulls forces. Green line - is a noize free index that showing curent situation. Zero value of index shows totally choppy/flat market.Values above zero level shows how powerfull bullish wave is and values below zero measures bearish forces.Up arrow appears on bearish market when it's ready to reverse, dn arrow appears on weak bullish market, as a result of reverse expectation.
MetaForecast M5
Vahidreza Heidar Gholami
5 (2)
MetaForecast predice e visualizza il futuro di qualsiasi mercato basandosi sull'armonia dei dati dei prezzi. Sebbene il mercato non sia sempre prevedibile, se esiste un modello nei prezzi, MetaForecast può prevedere il futuro con la massima precisione possibile. Rispetto ad altri prodotti simili, MetaForecast può generare risultati più accurati analizzando le tendenze di mercato. Parametri di input Past size (Dimensione passata) Specifica il numero di barre che MetaForecast utilizza per creare
Top indicator for MT5   providing accurate signals to enter a trade without repainting! It can be applied to any financial assets:   forex, cryptocurrencies, metals, stocks, indices .  Watch  the video  (6:22) with an example of processing only one signal that paid off the indicator! MT4 version is here It will provide pretty accurate trading signals and tell you when it's best to open a trade and close it. Most traders improve their trading results during the first trading week with the help of
Gartley Hunter Multi
Siarhei Vashchylka
5 (6)
Gartley Hunter Multi - An indicator for searching for harmonic patterns simultaneously on dozens of trading instruments and on all classic timeframes: (m1, m5, m15, m30, H1, H4, D1, Wk, Mn). Manual (Be sure to read before purchasing) | Version for MT4 Advantages 1. Patterns: Gartley, Butterfly, Shark, Crab. Bat, Alternate Bat, Deep Crab, Cypher 2. Simultaneous search for patterns on dozens of trading instruments and on all classic timeframes 3. Search for patterns of all possible sizes. Fr
Golden Gate Algo MT5
James David Lane
4 (6)
40% DI SCONTO PER NATALE! AUMENTO DEL PREZZO A $250 IL 1 GENNAIO! Presentiamo GoldenGate Entries: una soluzione di trading all'avanguardia! Scopri un approccio rivoluzionario al trading con GoldenGate Entries (GGE), un indicatore avanzato progettato per migliorare la tua esperienza di trading. GGE offre un set completo di funzionalità per fornire agli utenti precisione e fiducia nelle loro decisioni di trading. Coppie: Qualsiasi (FX - Materie prime - Azioni - Azioni - Cripto) TimeFrame
Good day! I present to you a trading technical indicator for Deriv broker synthetic indices. This indicator ONLY works with the following indices: Boom 300 Index Boom 500 Index Boom 1000 Index Crash 300 Index Crash 500 Index Crash 1000 Index The indicator was created to give signals to open medium-term trades in the direction of Spikes. But you can open trades in the opposite direction to Spikes, at your own risk. Trade only on M1. Other TFs do not guarantee the correct operation of the indic
FxaccurateLS
Shiv Raj Kumawat
WHY IS OUR FXACCCURATE LS MT5 THE PROFITABLE ? PROTECT YOUR CAPITAL WITH RISK MANAGEMENT Gives entry, stop and target levels from time to time. It finds Trading opportunities by analyzing what the price is doing during established trends. POWERFUL INDICATOR FOR A RELIABLE STRATEGIES We have made these indicators with a lot of years of hard work. It is made at a very advanced level. Established trends provide dozens of trading opportunities, but most trend indicators completely ignore them!
La soluzione migliore per ogni principiante o trader esperto! Questo indicatore è uno strumento di trading unico, di alta qualità e conveniente perché abbiamo incorporato una serie di caratteristiche proprietarie e una formula segreta. Con un solo grafico fornisce avvisi per tutte le 28 coppie di valute. Immaginate come migliorerà il vostro trading perché sarete in grado di individuare l'esatto punto di innesco di una nuova tendenza o opportunità di scalping! Costruito su nuovi algoritmi so
XQ Indicator MetaTrader 5
Marzena Maria Szmit
5 (1)
Step into the realm of Forex trading with confidence and precision using XQ, a cutting-edge Forex indicator designed to elevate your trading game to unprecedented heights. Whether you're a seasoned trader or just stepping into the world of currency exchange, XQ Forex Indicator empowers you with the insights and signals needed to make informed trading decisions. The signal conditions are a combination of three indicators, and XQ Forex Indicator only display  medium and long-term trends . The ind
Royal Scalping Indicator M5
Vahidreza Heidar Gholami
5 (8)
My products are currently 50% off. Explore them and build your own strategy. Royal Scalping Indicator is an advanced price adaptive indicator designed to generate high-quality trading signals. Built-in multi-timeframe and multi-currency capabilities make it even more powerful to have configurations based on different symbols and timeframes. This indicator is perfect for scalp trades as well as swing trades. Royal Scalping is not just an indicator, but a trading strategy itself. Features Price A
Bill Williams Advanced
Siarhei Vashchylka
5 (5)
Bill Williams Advanced is designed for automatic chart analysis using Bill Williams' "Profitunity" system. The indicator analyzes four timeframes at once. Manual (Be sure to read before purchasing) Advantages 1. Automatically analyzes the chart using the "Profitunity" system of Bill Williams. The found signals are placed in a table in the corner of the screen. 2. Equipped with a trend filter based on the Alligator indicator. Most of the system signals are recommended to be used only accordi
TrendMaestro5
Stefano Frisetti
nota: questo indicatore e' per METATRADER5, se vuoi la versione per  METATRADER4 questo e' il link:   https://www.mql5.com/it/market/product/108106 TRENDMAESTRO ver 2.4 TRENDMAESTRO   riconosce un nuovo TREND sul nascere, non sbaglia mai. La sicurezza di identificare un nuovo TREND non ha prezzo. DESCRIZIONE TRENDMAESTRO identifica un nuovo TREND sul nascere, questo indicatore prende in esame la volatilita' i volumi ed il momentum per identificare il momento in cui c'e' un'esplosione di uno
TPA True Price Action indicator reveals the true price action of the market makers through 100% non-repainting signals strictly at the close of a candle! TPA shows entries and re-entries, every time the bulls are definitely stronger than the bears and vice versa. Not to confuse with red/green candles. The shift of power gets confirmed at the earliest stage and is ONE exit strategy of several. There are available now two free parts of the TPA User Guide for our customers. The first "The Basics"
Golden Spikes Detector
Batsirayi L Marango
5 (1)
Golden Spikes Detector This indicator is based on an advanced strategy primarily for trading spikes on Boom and Crash Indices. Complex algorithms were implemented to detect high probability entries only. It alerts on potential Buy and Sell entries. To trade spikes on the Deriv or Binary broker, only take Buy Boom and Sell Cash alerts. It was optimised to be loaded on 5-minute timeframe although multiple timeframe analysis is done in the background. Features ·             Desktop pop up and sound
Professional Scalping Tool on Deriv Attention! The indicator will be sold in limited quantities!!! The previous 5 copies were sold for $250 The next 5 copies will be sold for $350 The next price is $500 Description: This trading indicator is designed for professional traders focused on scalping. Designed with the market in mind, it provides highly accurate spike trading signals. It works on the M1 timeframe and supports the following symbols: Boom 300 Index, Boom 500 Index, Boom 1000 Index,
L'indicatore Quadrato di Gann è uno strumento potente di analisi di mercato basato sull'articolo "Formula Matematica per le Previsioni di Mercato" scritto da W.D. Gann. Questo strumento utilizza concetti matematici e teorie di Gann per effettuare un'analisi precisa del mercato. Utilizza i quadrati di 144, 90, 52 e anche il quadrato di 9. Inoltre, integra il metodo del  per il quadrato di 9 e la sua relazione con canali e modelli stellari di quel quadrato. Manuale Utente e Applicazione: Prima di
PZ Swing Trading MT5
PZ TRADING SLU
5 (4)
Swing Trading is the first indicator designed to detect swings in the direction of the trend and possible reversal swings. It uses the baseline swing trading approach, widely described in trading literature. The indicator studies several price and time vectors to track the aggregate trend direction and detects situations in which the market is oversold or overbought and ready to correct. [ Installation Guide | Update Guide | Troubleshooting | FAQ | All Products ] Profit for market swings with
MetaBands M5
Vahidreza Heidar Gholami
4.67 (3)
MetaBands uses powerful and unique algorithms to draw channels and detect trends so that it can provide traders with potential points for entering and exiting trades. It’s a channel indicator plus a powerful trend indicator. It includes different types of channels which can be merged to create new channels simply by using the input parameters. MetaBands uses all types of alerts to notify users about market events. Features Supports most of the channel algorithms Powerful trend detection algorith
Eng Gold
Ely Alkrar Xshkaky
ENG-GOLD Scalper It is an auxiliary indicator that identifies potential targets and determines the place of entry with a stop loss that works on Heiken Ashi candles  The green lines are usually the targets, the red lines are the stop loss, and the yellow lines are the entry location.  This file is recognized on small and medium frames, usually less than the watch frame I highly recommend using XAUUSD US100 US30 USOIL 
Altri dall’autore
AIS Money Management MT5
Aleksej Poljakov
5 (1)
The script is based on the simulation of trade transactions using a random number generator. This allows you to get completely different results, even with the same input parameters. When you run the script, a dialog box opens in which you can set the desired values ​​for external variables. In the  Trading options  block, the basic parameters that are necessary for trading modeling are defined. Start Balance  - sets the initial size of the trade balance. Number Trade  - sets the number of trad
FREE
This script allows selecting the TakeProfit and StopLoss levels. It analyzes the history data, and then calculates the probability of reaching a given price level. How the script works Suppose you have a trading strategy and you want to select the TakeProfit and StopLoss levels. Run the script and set the parameter: Number of Bars - the average position holding time in bars. Once the script operation is complete, the AIS-PPL.csv file will be created in the Files folder in the terminal data cat
FREE
Choosing the levels of StopLoss and TakeProfit can have a very strong impact on the overall performance of trading. In addition to the obvious parameters of a trade transaction - the size of a possible win or probable loss - the levels of StopLoss and TakeProfit also affect the expected duration of the transaction, and the profitability of trading in general. If you have already determined the optimal transaction duration using the “ AIS-ODT ” script, then you can begin to determine the paramete
FREE
This script is designed so that the trader can determine the average duration of trade transactions, at which the ratio of possible profits and losses will be optimal. First, let's look at the general approach to determining the optimal duration of trade transactions. We introduce the following variables: R   - the result of the transaction; T   - the time during which the transaction was open; W  - the time between the closing of the previous transaction and the opening of the next one. Every t
FREE
MinDeposit MT5
Aleksej Poljakov
3 (1)
The script analyzes the history of quotes and gives recommendations on the minimum deposit. The calculations take into account the variability of prices and the standard deviation. Margin requirements for the instrument are also taken into account. The result of the script is the minimum recommended deposit for trading the given currency pair.
FREE
The script allows selecting the required 'Filter level' value of the AIS-MTF MT5 indicator. Run the script on the required chart and selected timeframe. Once its operation is complete, the HPS.csv file will be created in the Files folder. Open the file. You will see three columns. The 'Filter lvl' column represents the value of the 'Filter level' for the AIS-MTF indicator. Am. dev. - degree and direction of the indicator's deviation from the price level (sorted in ascending order). Negative valu
FREE
The script is based on the simulation of trade transactions using a random number generator. This allows you to get completely different results, even with the same input parameters. When you run the script, a dialog box opens in which you can set the desired values ​​for external variables. In the Trading options block, the basic parameters that are necessary for trading modeling are defined. Start Balance - sets the initial size of the trade balance. Number Trade - sets the number of trade tr
FREE
Choosing the levels of StopLoss and TakeProfit can have a very strong impact on the overall performance of trading. In addition to the obvious parameters of a trade transaction - the size of a possible win or probable loss - the levels of StopLoss and TakeProfit also affect the expected duration of the transaction, and the profitability of trading in general. If you have already determined the optimal transaction duration using the “ AIS-ODT ” script, then you can begin to determine the paramete
FREE
This script is designed so that the trader can determine the average duration of trade transactions, at which the ratio of possible profits and losses will be optimal. First, let's look at the general approach to determining the optimal duration of trade transactions. We introduce the following variables: R   - the result of the transaction; T   - the time during which the transaction was open; W - the time between the closing of the previous transaction and the opening of the next one. Every tr
FREE
MinDeposit
Aleksej Poljakov
5 (1)
The script analyzes the history of quotes and gives recommendations on the minimum deposit. The calculations take into account the variability of prices and the standard deviation. Margin requirements for the instrument are also taken into account. The result of the script is the minimum recommended deposit for trading the given currency pair.
FREE
The script allows selecting the required 'Filter level' value of the AIS-MTF indicator. Run the script on the required chart and selected timeframe. Once its operation is complete, the HPS.csv file will be created in the Files folder. Open the file. You will see three columns. The 'Filter lvl' column represents the value of the 'Filter level' for the AIS-MTF indicator. Am. dev. - degree and direction of the indicator's deviation from the price level (sorted in ascending order). Negative values i
FREE
This script allows selecting the TakeProfit and StopLoss levels. It analyzes the history data, and then calculates the probability of reaching a given price level. How the script works Suppose you have a trading strategy and you want to select the TakeProfit and StopLoss levels. Run the script and set the parameter: Number of Bars - the average position holding time in bars. Once the script operation is complete, the AIS-PPL.csv file will be created in the Files folder in the terminal data cat
FREE
L'indicatore AIS Correct Averages consente di impostare l'inizio di un movimento di tendenza nel mercato. Un'altra importante qualità dell'indicatore è un chiaro segnale della fine del trend. L'indicatore non viene ridisegnato o ricalcolato. Valori visualizzati h_AE - limite superiore del canale AE l_AE - limite inferiore del canale AE h_EC - Valore previsto alto per la barra corrente l_EC - Valore previsto basso per la barra corrente Segnali quando si lavora con l'indicatore Il segna
L'indicatore della media mobile ponderata AIS calcola una media mobile ponderata e consente di determinare l'inizio di un movimento di mercato di tendenza. I coefficienti di peso sono calcolati tenendo conto delle caratteristiche specifiche di ciascuna barra. Ciò ti consente di filtrare i movimenti casuali del mercato. Il segnale principale che conferma l'inizio di una tendenza è un cambiamento nella direzione delle linee dell'indicatore e il prezzo che attraversa le linee dell'indicatore.
L'indicatore di fattibilità del grado avanzato AIS è progettato per prevedere i livelli che il prezzo potrebbe raggiungere in futuro. Il suo compito è analizzare le ultime tre barre e costruire una previsione basata su queste. L'indicatore può essere utilizzato su qualsiasi intervallo di tempo e qualsiasi coppia di valute. Con l'aiuto delle impostazioni, puoi ottenere la qualità desiderata della previsione. Profondità di previsione: imposta la profondità di previsione desiderata in barre. Si
The indicator is designed to measure the price volatility. This allows determining the moments for opening or closing trade positions more accurately. High intensity of the market indicates the instability of its movement, but allows for better results. And, conversely, low intensity of the market indicates the stability of its movement. Parameters Bars to process - the number of bars to measure the price movements. A low value of this parameter allows determining the moments of rapid price mo
This indicator uses the Fibonacci p-numbers to smooth a price series. This allows combining the advantages of the simple and exponential moving averages. The smoothing coefficients depend on the level of the p-number, which is set in the indicator parameters. The higher the level, the greater the influence of the simple moving average and the less significant the exponential moving average. Parameters Fibonacci Numbers Order - order of the Fibonacci p-number, specified by trader. Valid values
The indicator is based on the analysis of interaction of two filters. The first filter is the popular Moving Average. It helps to identify linear price movements and to smooth minor price fluctuations. The second filter is the Sliding Median. It is a non-linear filter. It allows to filter out noise and single spikes in the price movement. A predictive filter implemented in this indicator is based on the difference between these filters. The indicator is trained during operation and is therefore
This indicator studies the price action as a combination of micro-trends. All micro-trends are analyzed and averaged. Price movement is filtered based on this averaging. IP_High and IP_Low (blue and red dashed lines) show the instantaneous price movement. They display the forecast only for the current price values, taking into account only the number of bars defined by the 'Filter level' parameter. SP_High and SP_Low (blue and red solid lines) smooth the price movements with respect to history.
Questo indicatore implementa un semplice processo di smoothing lineare. Uno degli svantaggi del livellamento esponenziale è il rapido decadimento del segnale. Ciò rende impossibile tracciare completamente le tendenze a lungo termine nella fascia di prezzo. Il livellamento lineare consente di ottimizzare il filtraggio del segnale in modo più accurato e preciso. L'indicatore si configura selezionando i parametri: LP: questo parametro consente di selezionare il periodo di livellamento. Maggi
Этот индикатор представляет гибридный фильтр основанный на совместном использовании медианы и скользящей средней. Использование медианы позволяет отфильтровывать аномальные выбросы и случайные импульсы в значениях ценового ряда. При этом на трендовую составляющую медианный фильтр не действует, оставляя ее без изменений. Так как медианный фильтр является нелинейным, то для сглаживания его значений используется скользящая средняя. Такой подход позволяет более точно выделять не только тренд, но и п
This indicator is a combination of two modified Lanczos filters. The first filter serves to extrapolate the price. Based on past values, he predicts a possible price movement within the current bar. That is, it shows what the price would be if the past trends remained unchanged. The second filter for smoothing and averaging prices within the window, determined by the level of the filter. Thanks to the selection of weights, this filter is most actively responding to the periodic component that is
Let's look at the nature of price changes in the Forex market, not paying attention to the reasons why these changes occur. This approach will allow us to identify the main factors affecting the price movement. For example, let's take the opening prices of bars on the EUR-USD currency pair and the H1 timeframe. For these prices, we construct the Lameray diagram (Figure 1). In this diagram, it can be seen that the price movement basically occurs according to a linear equation. To determine the pa
This indicator is more informative. His work is based on the assumption that the price movement in the market can be represented as noise of a particular color, which depends on the parameters of the distribution of price values. Thanks to this, it is possible to analyze the price change from different angles, and considering the price movement as noise of a particular color, one can get information about the current state of affairs in the market and make a forecast about the price behavior. W
Despite some drawbacks of the “ AIS Color Noise Filter ” indicator, the idea to use it to smooth the price series and forecast prices looks quite attractive. This is due to several reasons: first, taking into account several noise components allows building a forecast on factors independent of each other, which can improve the quality of forecasting; secondly, the noise characteristics of the price series behave quite stably throughout the entire history, which makes it possible to obtain stabl
Very often, in the study of financial series apply their smoothing. Using smoothing, you can remove high-frequency components - it is believed that they are caused by random factors and therefore irrelevant. Smoothing always includes some way of averaging the data, in which random changes in the time series mutually absorb each other. Most often, for this purpose, simple or weighted moving average methods are used, as well as exponential smoothing. Each of these methods has its advantages and d
In order to isolate long-term and non-random components, it is necessary to know not only how much the price has changed, but also how these changes occurred. In other words - we are interested not only in the values ​​of price levels, but also in the order in which these levels replace each other. Through this approach, one can find long-term and stable factors that influence (or may influence) the price change at a given point in time. And knowledge of these factors allows you to make a more
One of the powerful methods of analysis is the modeling of financial series using Levy processes. The main advantage of these processes is that they can be used to model a huge number of phenomena - from the simplest to the most complex. Suffice it to say that the idea of ​​the fractal price movement in the market is only a special case of Levy processes. On the other hand, with proper selection of parameters, any Levy process can be represented as a simple moving average. Figure 1 shows an exa
Very often, the trader is faced with the task of determining the extent to which the price may change in the near future. For this purpose, you can use the Johnson distribution type SB. The main advantage of this distribution is that it can be used even with a small amount of accumulated data. The empirical approach used in determining the parameters of this distribution, allows you to accurately determine the maximum and minimum levels of the price channel. These values ​​can be used in differ
This indicator allows you to determine the likelihood that the price will reach one or another level. Its algorithm is quite simple and is based on the use of statistical data on the price levels of a particular currency pair. Thanks to the collected historical data, it is possible to determine the extent to which the price will change during the current bar. Despite its simplicity, this indicator can provide invaluable assistance in trading. So, with its help it is possible to determine TakePr
Filtro:
220072256
3596
220072256 2022.05.27 12:39 
 

This person is a great person !! He is a mathematical scientist who adapts his calculations to trading. I have many profits thanks to the indicators of him !!

Rispondi alla recensione