• Panoramica
  • Recensioni
  • Commenti

KT Aroon MT5

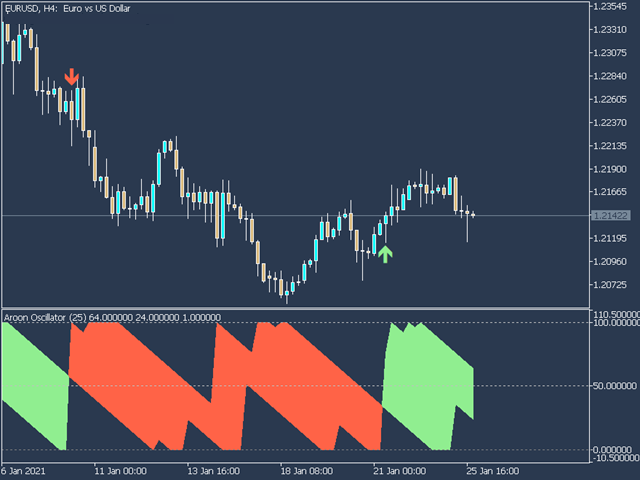
KT Aroon oscillator is the modified version of the original Aroon oscillator initially developed by Tushar Chande in 1995. It measures the time interval between the ongoing highs and lows and uses this deduction to calculate the market trend's direction and strength. 

It works on the notion that the price will form new highs consecutively during an uptrend, and during a downtrend, new lows will be formed.

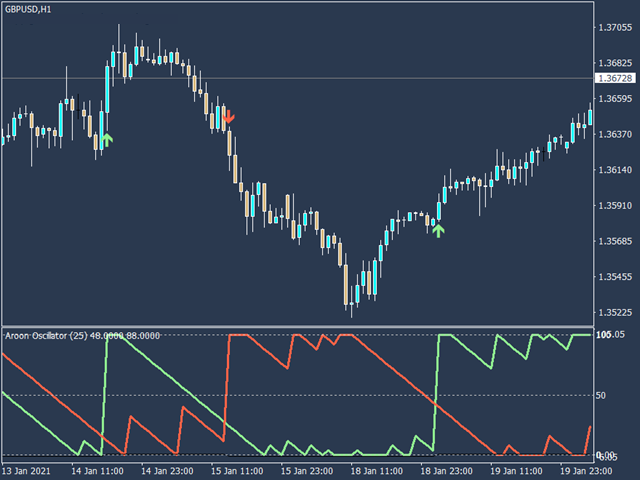
Buy Signal: When Aroon Up line cross above the Aroon Down line.
Sell Signal: When Aroon Down line cross above the Aroon Up line. 

Features

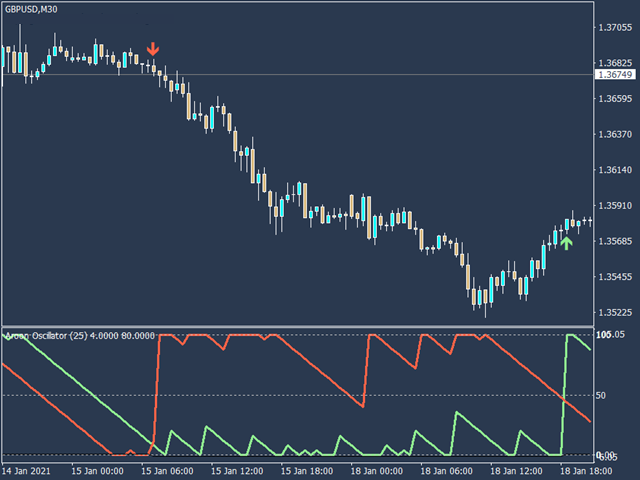
  • It is equipped with Up/Down arrows, which mark the Aroon signals on the price chart.
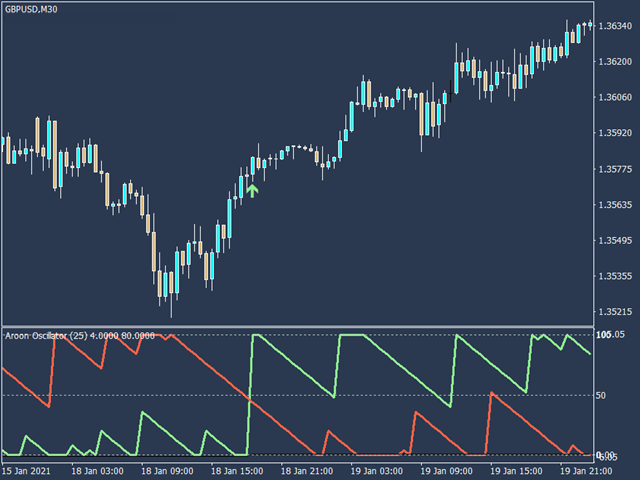
  • Shows the market trend efficiently.
  • Simple illustration without any clutter on the chart.
  • All Metatrader alerts are available.
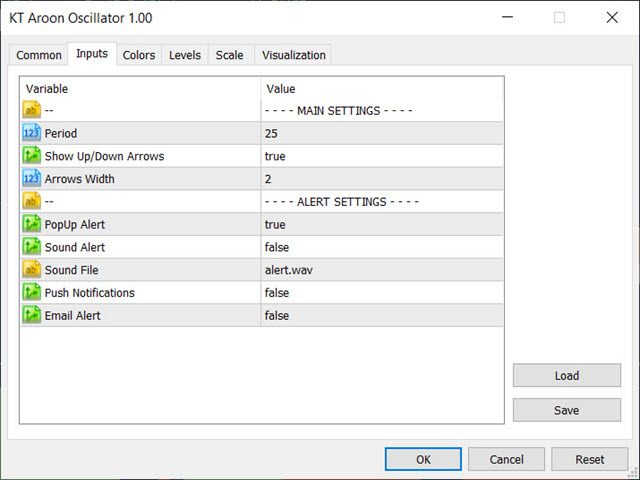
Inputs

  • Period: The period to calculate the Aroon Up and Down line.
  • Show Up/Down Arrows: If set to True, it will place the Up and Down Arrows on the price chart for each new signal.
  • Alert Settings: Configure the various alerts like Popup, Sound, Mobile notifications, and Emails.

More about the Aroon

Aroon oscillator is quite different from other popular oscillators because it comprehends time with the asset's price. On a Daily Timeframe, you can interpret the Aroon oscillator like:

Aroon Up: The Aroon Up signal measures the number of days that have passed since the 25-day high.
Aroon Down: The Aroon Down signal measures the number of days that have passed since the 25-day low.

Formula

Aroon-Up = ((P - Days Since P-day High)/P) x 100
Aroon-Down = ((P - Days Since P-day Low)/P) x 100

Where P is the Period chosen by the user. By default, P is set to 25.

Advantages

  • Shows the new emerging market trend remarkably.
  • It can also show the interval of consolidation. If the Aroon lines are below 50 or moving parallel, there could be indecision among the traders.
  • Aroon lines crossover (Up and Down Arrows) can be used as new signals.

Pro Tip

There is no doubt that the Aroon is a famous and useful oscillator among traders. However, it's still a lagging indicator by nature, so it's always best to use it in conjunction with other indicators and strategies.
Prodotti consigliati
HLC bar MT5 Wyckoff
Eduardo Da Costa Custodio Santos
L'indicatore "HLC_bar_MT5 Wyckoff" per MT5 è stato creato per facilitare l'analisi al momento del trading. La barra HLC è stata utilizzata da Richard Wyckoff ed è attualmente ampiamente utilizzata nelle operazioni "VSA". Wyckoff ha scoperto che l'utilizzo di High, Low e Close ha reso il grafico molto più pulito e più facile da analizzare. L'indicatore "HLC_bar_MT5 Wyckoff" consente: # Cambia la larghezza della barra; # Lascia la barra dello stesso colore; # Ed evidenzia la barra che si è aperta
Super Trend eu
Emin Ulucanli
5 (3)
SUPERTREND; È un indicatore di trend following basato sull'ATR SuperTrend creato da Olivier Seban. Può essere utilizzato per rilevare i cambiamenti nella direzione del trend e individuare gli arresti. Quando il prezzo scende al di sotto della curva dell'indicatore, diventa rosso e indica una tendenza al ribasso. Al contrario, quando il prezzo si sposta al di sopra della curva, l'indicatore diventa verde, indicando un trend rialzista. Come altri indicatori, funziona bene su SuperTrend se utilizza
FREE
Gekko MACD Plus
Rodrigo Galeote
3 (3)
Type: Oscillator This is Gekko's Cutomized Moving Average Convergence/Divergence (MACD), a customized version of the famous MACD indicator. Use the regular MACD and take advantage of several entry signals calculations and different ways of being alerted whenever there is potential entry point. Inputs Fast MA Period: Period for the MACD's Fast Moving Average (default 12); Slow MA Period: Period for the MACD's Slow Moving Average (default 26); Signal Average Offset Period: Period for the Signal
Paula Bollinger Bands Strategy
Francisco Gomes Da Silva
4 (2)
Bollinger bands out/in strategy A strategy created by Joe Ross, and very useful for finding trades when the market is overloaded. Indicator You don't need to find where there are entries on the chart, this indicator shows them for you. The entrance The trade is confirmed when the price closes outside the bollinger bands on a candle and the candle after the price closes inside the bands. comment I want to improve this indicator, so you can help me sending me your reviews and comments, thanks :).
FREE
Cet indicateur innovant de mesure de la force des devises de INFINITY est une aide indispensable pour les scalpers et les commerçants qui négocient à long terme. Le système d'analyse De la force/faiblesse des devises est connu depuis longtemps et utilisé sur le marché par les principaux traders du monde. Tout commerce d'arbitrage n'est pas complet sans cette analyse. Notre indicateur détermine facilement la force des devises sous-jacentes les unes par rapport aux autres. Il affiche des graphiqu
Weis Wave Double Side
Eduardo Da Costa Custodio Santos
L'indicatore laterale Weis Wave Bouble per MT5 fa parte del toolkit (Wyckoff Academy Wave Market) L'indicatore laterale Weis Wave Bouble per MT5 è stato creato sulla base della già consolidata Weis Wave creata da David Weis. L'indicatore Weis Wave Double Side legge il mercato a ondate come è stato fatto da R. Wyckoff nel 1900. Aiuta a identificare sforzo x risultato, causa ed effetto e domanda e offerta Il suo differenziale è che può essere utilizzato sotto l'asse zero, migliorando ulteriormente
Follow The Line MT5
Oliver Gideon Amofa Appiah
4.4 (30)
This indicator obeys the popular maxim that: "THE TREND IS YOUR FRIEND" It paints a GREEN line for BUY and also paints a RED line for SELL. (you can change the colors). It gives alarms and alerts of all kinds. IT DOES NOT REPAINT and can be used for all currency pairs and timeframes. Yes, as easy and simple as that. Even a newbie can use it to make great and reliable trades. NB: For best results, get my other premium indicators for more powerful and reliable signals. Get them here: https://www.m
FREE
WAPV Weis Wave Chart Forex
Eduardo Da Costa Custodio Santos
Il Weis Wave Chart Forex per MT5 è un indicatore di prezzo e volume. La lettura del prezzo e del volume è stata ampiamente diffusa tramite Richard Demille Wyckoff sulla base delle tre leggi da lui create: offerta e domanda, causa ed effetto e sforzo contro risultato. Già nel 1900 R.Wyckoff utilizzava la carta delle onde nelle sue analisi. Molti anni dopo, intorno al 1990, David Weis ha automatizzato il diagramma delle onde di R. Wyckoff e oggi vi portiamo l'evoluzione del diagramma delle onde di
SDivergence
Mobin Zarekar
1 (1)
SDivergence Indicator calculates and shows regular divergences and hidden divergences for MACD and Stochastic(for now). The benefit of this indicator is multiple input variables. Using these inputs you can modify to get more adaptive RD and HD's to your strategy. Guide : 1- First put your desired oscillator (MACD or Stochastic or Both) on the chart. 2- Run SDivergence indicator and set corresponding sub-window index of previously put oscillator in SDivergence input window. -Note: the chart sub-w
FREE
The best time to trade Using this Indicator is when the time reach exactly hour,half,45 minutes,15 minutes and sometimes 5 minutes.. This indicators is helpful to those who trade boom and crash indecies.How to read this indicator first you'll see Blue allow and Red allow all these allows used to indicate or to detect the spike which will happen so the allow happens soon before the spike happen.This indicator works properly only in boom and crash trading thing which you have to consider when
Stochastic R
Antony Augustine
Stochastic  Reversal  allows you to recognize reversals professionally. Stochastic Indicator: This technical indicator was developed by George Lane more than 50 years ago. The reason why this indicator survived for so many years is because it continues to show consistent signals even in these current times. The Stochastic indicator is a momentum indicator that shows you how strong or weak the current trend is. It helps you identify overbought and oversold market conditions within a trend.  Rules
MACD Intraday Trend PRO è un indicatore sviluppato attraverso un adattamento del MACD originale creato da Gerald Appel negli anni '60. Attraverso anni di trading, è stato osservato che modificando i parametri del MACD con le proporzioni di Fibonacci otteniamo una migliore presentazione della continuità dei movimenti di tendenza, rendendo possibile rilevare in modo più efficiente l'inizio e la fine di un andamento di prezzo. Grazie alla sua efficienza nel rilevare l'andamento dei prezzi, è a
SuperTrend MT5
KEENBASE SOFTWARE SOLUTIONS
KT SuperTrend is a modified version of the classic SuperTrend indicator with new useful features. Whether its Equities, Futures, and Forex, the beginners' traders widely use the Supertrend indicator.  Buy Signal: When price close above the supertrend line. Sell Signal: When price close below the supertrend line. Features A multi-featured SuperTrend coded from scratch. Equipped with a multi-timeframe scanner. The last signal direction and entry price showed on the chart. All kinds of MetaTra
Supertrend indicator uses a combination of a moving average and average true range to detect the trend of a trading instrument. Supertrend indicator for MetaTrader 5 easily shows the trend as a line following the price. Triple SuperTrend Histo indicator  calculate  three supertrends to show the trend as a histogram. Changing the color from red to green means you can BUY , from green to red means you can SELL . Description of the method of drawing a histogram. The price is above the EMA 20
Box Weis Wave
Thalles Nascimento De Carvalho
5 (1)
Se sei un trader attivo e stai cercando un modo efficace per interpretare i movimenti sui mercati finanziari, ti piacerà scoprire Weis Wave Box. Questo incredibile indicatore è stato progettato per offrire un'analisi visiva chiara e precisa delle onde di volume, insieme alla rappresentazione dei punti di inversione corrispondenti. Con le sue cinque forme di inversione personalizzabili e altre caratteristiche uniche, Weis Wave Box si distingue come uno strumento indispensabile sia per i trader es
Created by trader and journalist Larry Williams, Setup 9.1 is a simple strategy that is easy to understand and execute, which is why it is so well known and popular in the world of traders and technical analysis. It is a REVERSION setup, where operations are sought when the moving average changes direction. Setup Logic With the open candlestick chart, at any time chart, it is only necessary to add the 9-period Exponential Moving Average (MME9). That done, we look for assets in which the MME
WAPV Weis Wave Chart MT5
Eduardo Da Costa Custodio Santos
Il grafico Weis Wave per MT5 è un indicatore di prezzo e volume. La lettura del prezzo e del volume è stata ampiamente diffusa tramite Richard Demille Wyckoff sulla base delle tre leggi da lui create: offerta e domanda, causa ed effetto e sforzo contro risultato. Già nel 1900 R.Wyckoff utilizzava la carta delle onde nelle sue analisi. Molti anni dopo, intorno al 1990, David Weis ha automatizzato il diagramma delle onde di R. Wyckoff e oggi vi portiamo l'evoluzione del diagramma delle onde di Dav
IMA Finder MT5
Mubashir Mohamed Quraish Albarakat
1 (1)
This indicator is designed based on the Moving Origin indicator When the moving origin indicator breaks the price, this indicator gives a signal It is useful for better viewing of signals and analysis on them Attributes: Can be used in all symbols Can be used in all time frames Too many signals Simple and quick settings Easy way to work Settings: period: like moving average settings alarmShow: If you want to receive an alert in Metatrader after receiving the signal, enable this setting a
FREE
This is Gekko's Cutomized Cutomized Average Directional Index (ADX), a customized version of the famous ADX indicator. Use the regular ADX and take advantage two entry signals calculations and different ways of being alerted whenever there is potential entry or exit point. Inputs Period: Period for the ADX calculation; PlotSignalType: How will the indicator calculate entry (swing) signals: 1- ShowSwingsOnTrendLevel : Show Signals for Trend Confirmation Swings; 2- ShowSwingsOnTrendLevelDirectio
MACD (short for Moving Average Convergence/Divergence) is one of the most famous and oldest indicators ever created and is widely used among   beginners . However, there is a newer version of the MACD that is named   Impulse MACD   which have less false signals than the standard MACD. Classic MACD helps us to identify potential   trends   by displaying   crossovers   between two lines. If MACD line crosses above the Signal line it shows us that the market is potentially   up   trending and that
MIDAS Super VWAP
Flavio Javier Jarabeck
4.29 (14)
Imagine VWAP, MVWAP and MIDAS in one place... Well, you found it! Now you can track the movement of Big Players in various ways, as they in general pursue the benchmarks related to this measuring, gauging if they had good execution or poor execution on their orders. Traders and analysts use the VWAP to eliminate the noise that occurs throughout the day, so they can measure what prices buyers and sellers are really trading. VWAP gives traders insight into how a stock trades for that day and deter
FREE
Donchian Pro
Paulo Henrique Faquineli Garcia
5 (2)
The Donchian Channel Channels are among the most popular tools of technical analysis, as they visually convey to the analyst the limits within which most price movement tends to occur. Channel users know that valuable information can be obtained at any time, whether prices are in the central region of a band or close to one of the border lines. One of the best known techniques to explore these concepts is Bollinger Bands. However, John Bollinger was not the only one to research the applicatio
FREE
ADX consolidado
OTAVIO AGUIAR CAMPOS Aguiar
4.75 (4)
Mostra a média móvel quando ADX > 20 e pinta de verde ou vermelho quando os valores de ADX estão subindo indicando tendência. Quando o ADX é menor que 20 indica movimento lateral consolidado. O indicador não define pontos de entrada, somente mostra a média colorida quando a tendência está se fortalecendo. Faz parte do grupo de indicadores do Indicador Tavim.
FREE
Zero Lag MACD
Flavio Javier Jarabeck
For those who are fans of the traditional MACD ( Moving Average Convergece/Divergence ) indicator, here it is a way faster indicator that could be very useful for intraday trading. Of course it could be used in higher timeframes, with the proper settings. Here at Minions Labs we always encourage traders to calibrate every single indicator you have to extract and distill every drop of good information it has for you. And this is the case with this speedy friend... This Zero Lag MACD could be used
Macd Rsi
Ignacio Agustin Mene Franco
macd rsi It is a macd indicator added to the rsi to capture perfect entries in the average crossovers! As seen in the indicator, it has 2 lines, one of gold color and the other violet line, where the cross of the violet with the gold downwards is a sell signal when it crosses the violet up from the gold it is a buy signal! very good to make shorts works for forex markets and synthetic indices It is used in any temporality! Good profit! World Investor.
KT De Munyuk MT5
KEENBASE SOFTWARE SOLUTIONS
The KT De Munyuk is a trend-based indicator that uses   Parabolic SAR   to identify the market direction. The indicator shows the PSAR in the form of green/red dots using a separate window. Buy Signal:   When a green dot appears after a series of at least three red dots. Buy Exit:   When a red dot appears on the current or next higher time frame. Sell Signal:   When a red dot appears after a series of at least three green dots. Sell Exit:   When a green dot appears on the current or next higher
Volume Waves
Paulo Henrique Faquineli Garcia
One of the best tools for analyzing volume, Weis Wave was devised by David Weis to facilitate reading the directional flow. For the disciples of the Wyckoff method, this means an evolution, facilitating a predictive reading of the market, always looking for Accumulation and Distribution zones for traded assets. For better understanding, in this indicator we try to cover every reading of EFFORT (traded volume) versus RESULT (price change). Thus, you can apply the indicator on the chart twice
Contact me for instruction, any questions! Introduction The Elliott Wave in technical analysis describes price movements in the financial market that are related to changes in trader sentiment and psychology. The 5 W Pattern (Known as 3 Drives) is an Elliott Wave pattern that is formed by 5 consecutive symmetrical moves up or down. In its bullish form, the market is making 5 drives to a bottom before an uptrend forms. In a bearish 5-drive, it is peaking before the bears take over.  5W Pattern S
Market Momentum
Flavio Javier Jarabeck
3.86 (7)
The Market Momentum indicator is based on the Volume Zone Oscillator (VZO), presented by Waleed Aly Khalil in the 2009 edition of the International Federation of Technical Analysts journal, and presents a fresh view of this market valuable data that is oftenly misunderstood and neglected: VOLUME. With this new approach of "seeing" Volume data, traders can infer more properly market behavior and increase their odds in a winning trade. "The VZO is a leading volume oscillator; its basic usefulnes
FREE
Renko System
Marco Montemari
This indicator can be considered as a trading system. It offers a different view to see the currency pair: full timeless indicator, can be used for manual trading or for automatized trading with some expert advisor. When the price reaches a threshold a new block is created according to the set mode. The indicator beside the Renko bars, shows also 3 moving averages. Features renko mode median renko custom median renko 3 moving averages wicks datetime indicator for each block custom notificatio
Gli utenti di questo prodotto hanno anche acquistato
Innanzitutto è importante sottolineare che questo sistema di trading è un indicatore Non-Repainting, Non-Redrawing e Non-Lagging, il che lo rende ideale sia per il trading manuale che per quello automatico. Il "Sistema di Trading Smart Trend MT5" è una soluzione completa pensata sia per i trader principianti che per quelli esperti. Combina oltre 10 indicatori premium e offre più di 7 robuste strategie di trading, rendendolo una scelta versatile per diverse condizioni di mercato. Strategia di Tre
Atomic Analyst MT5
Issam Kassas
5 (12)
Innanzitutto, vale la pena sottolineare che questo indicatore di trading non è repaint, non è ridisegno e non presenta ritardi, il che lo rende ideale sia per il trading manuale che per quello automatico. L'Analista Atomico è un indicatore di azione del prezzo PA che utilizza la forza e il momentum del prezzo per trovare un miglior vantaggio sul mercato. Dotato di filtri avanzati che aiutano a rimuovere rumori e segnali falsi, e aumentare il potenziale di trading. Utilizzando più strati di in
Quantum Trend Sniper
Bogdan Ion Puscasu
5 (37)
Presentazione       Quantum Trend Sniper Indicator   , l'innovativo indicatore MQL5 che sta trasformando il modo in cui identifichi e scambi le inversioni di tendenza! Sviluppato da un team di trader esperti con un'esperienza di trading di oltre 13 anni,       Indicatore Quantum Trend Sniper       è progettato per spingere il tuo viaggio di trading verso nuove vette con il suo modo innovativo di identificare le inversioni di tendenza con una precisione estremamente elevata. *** Acquista Quant
Trend Screener Pro MT5
STE S.S.COMPANY
4.87 (62)
Indicatore di tendenza, soluzione unica rivoluzionaria per il trading di tendenze e il filtraggio con tutte le importanti funzionalità di tendenza integrate in un unico strumento! È un indicatore multi-timeframe e multi-valuta al 100% non ridipingibile che può essere utilizzato su tutti i simboli/strumenti: forex, materie prime, criptovalute, indici e azioni. Trend Screener è un indicatore di tendenza che segue un indicatore efficiente che fornisce segnali di tendenza a freccia con punti nel gra
FX Volume MT5
Daniel Stein
4.94 (17)
Ricevi il tuo aggiornamento quotidiano sul mercato con dettagli e schermate tramite il nostro Morning Briefing qui su mql5 e su Telegram ! FX Volume è il PRIMO e UNICO indicatore di volume che fornisce una visione REALE del sentiment del mercato dal punto di vista del broker. Fornisce informazioni straordinarie su come gli operatori di mercato istituzionali, come i broker, sono posizionati sul mercato Forex, molto più velocemente dei rapporti COT. Vedere queste informazioni direttamente sul vo
Innanzitutto, vale la pena sottolineare che questo Strumento di Trading è un Indicatore Non-Ridipingente, Non-Ridisegnante e Non-Laggante, il che lo rende ideale per il trading professionale. L'Indicatore Smart Price Action Concepts è uno strumento molto potente sia per i nuovi che per i trader esperti. Racchiude più di 20 utili indicatori in uno solo, combinando idee di trading avanzate come l'Analisi del Trader del Circolo Interno e le Strategie di Trading dei Concetti del Denaro Intelligen
Advanced Supply Demand MT5
Bernhard Schweigert
4.53 (15)
La migliore soluzione per qualsiasi principiante o trader esperto! Questo indicatore è uno strumento di trading unico, di alta qualità e conveniente perché abbiamo incorporato una serie di funzionalità proprietarie e una nuova formula. Con questo aggiornamento, sarai in grado di mostrare fusi orari doppi. Non solo potrai mostrare una TF più alta, ma anche entrambe, la TF del grafico, PIÙ la TF più alta: SHOWING NESTED ZONES. Tutti i trader di domanda di offerta lo adoreranno. :) Informazioni imp
A key element in trading is zones or levels from which decisions to buy or sell a trading instrument are made. Despite attempts by major players to conceal their presence in the market, they inevitably leave traces. Our task was to learn how to identify these traces and interpret them correctly. Reversal First Impulse levels (RFI)   -  Version MT4                  INSTRUCTIONS                 RUS                 ENG                         R ecommended to use with an indicator   -  TREND PRO  
AW Trend Predictor MT5
AW Trading Software Limited
4.76 (55)
La combinazione di trend e livelli di rottura in un unico sistema. Un algoritmo di indicatore avanzato filtra il rumore del mercato, determina la tendenza, i punti di ingresso e i possibili livelli di uscita. I segnali indicatori sono registrati in un modulo statistico, che permette di selezionare gli strumenti più adatti, mostrando l'efficacia dello storico dei segnali. L'indicatore calcola i segni Take Profit e Stop Loss. Manuale e istruzioni ->   QUI   / versione MT4 ->   QUI Come fare tradi
TPSproTREND PrO MT5
Roman Podpora
5 (5)
TPSpro TRENDPRO  - is a trend indicator that automatically analyzes the market and provides information about the trend and each of its changes, as well as giving signals for entering trades without redrawing! The indicator uses each candle, analyzing them separately. referring to different impulses - up or down impulse. Exact entry points into transactions for currencies, crypto, metals, stocks, indices!  -  Version MT4                  DETAILED DESCRIPTION        /       TRADING SETUPS       
FX Power MT5 NG
Daniel Stein
5 (4)
Ricevi il tuo aggiornamento quotidiano sul mercato con dettagli e schermate tramite il nostro Morning Briefing qui su mql5 e su Telegram ! FX Power MT5 NG è la nuova generazione del nostro popolare misuratore di forza delle valute, FX Power. Cosa offre questo misuratore di forza di nuova generazione? Tutto ciò che avete amato dell'FX Power originale IN PIÙ Analisi della forza di ORO/XAU Risultati di calcolo ancora più precisi Periodi di analisi configurabili individualmente Limite di calcolo pe
Top indicator for MT5   providing accurate signals to enter a trade without repainting! It can be applied to any financial assets:   forex, cryptocurrencies, metals, stocks, indices .  Watch  the video  (6:22) with an example of processing only one signal that paid off the indicator! MT4 version is here It will provide pretty accurate trading signals and tell you when it's best to open a trade and close it. Most traders improve their trading results during the first trading week with the help of
RelicusRoad Pro MT5
Relicus LLC
4.82 (22)
Ora $ 147 (aumentando a $ 499 dopo alcuni aggiornamenti) - account illimitati (PC o MAC) Manuale utente di RelicusRoad + Video di formazione + Accesso al gruppo Discord privato + Stato VIP UN NUOVO MODO DI GUARDARE IL MERCATO RelicusRoad è l'indicatore di trading più potente al mondo per forex, futures, criptovalute, azioni e indici, fornendo ai trader tutte le informazioni e gli strumenti di cui hanno bisogno per rimanere redditizi. Forniamo analisi tecniche e piani di trading per aiutar
Gartley Hunter Multi
Siarhei Vashchylka
5 (5)
Gartley Hunter Multi - An indicator for searching for harmonic patterns simultaneously on dozens of trading instruments and on all classic timeframes: (m1, m5, m15, m30, H1, H4, D1, Wk, Mn). Manual (Be sure to read before purchasing) | Version for MT4 Advantages 1. Patterns: Gartley, Butterfly, Shark, Crab. Bat, Alternate Bat, Deep Crab, Cypher 2. Simultaneous search for patterns on dozens of trading instruments and on all classic timeframes 3. Search for patterns of all possible sizes. Fr
Noize Absorption Index - is the manual trading system that measures the difference of pressure between bears forces and bulls forces. Green line - is a noize free index that showing curent situation. Zero value of index shows totally choppy/flat market.Values above zero level shows how powerfull bullish wave is and values below zero measures bearish forces.Up arrow appears on bearish market when it's ready to reverse, dn arrow appears on weak bullish market, as a result of reverse expectation.
ICT, SMC, SMART MONEY CONCEPTS, SMART MONEY, Smart Money Concept, Support and Resistance, Trend Analysis, Price Action, Market Structure, Order Blocks, BOS/CHoCH,   Breaker Blocks ,  Momentum Shift,   Supply&Demand Zone/Order Blocks , Strong Imbalance,   HH/LL/HL/LH,    Fair Value Gap, FVG,  Premium  &   Discount   Zones, Fibonacci Retracement, OTE, Buy Side Liquidity, Sell Side Liquidity, BSL/SSL Taken, Equal Highs & Lows, MTF Dashboard, Multiple Time Frame, BigBar, HTF OB, HTF Market Structure
Professional Scalping Tool on Deriv Attention! The indicator will be sold in limited quantities!!! The previous 5 copies were sold for $250 The next 5 copies will be sold for $350 The next price is $500 Description: This trading indicator is designed for professional traders focused on scalping. Designed with the market in mind, it provides highly accurate spike trading signals. It works on the M1 timeframe and supports the following symbols: Boom 300 Index, Boom 500 Index, Boom 1000 Index,
Volume by Price MT5
Brian Collard
5 (3)
The Volume by Price Indicator for MetaTrader 5 features Volume Profile and Market Profile TPO (Time Price Opportunity). Get valuable insights out of currencies, equities and commodities data. Gain an edge trading financial markets. Volume and TPO histogram bar and line charts. Volume Footprint charts. TPO letter and block marker charts including split structures. Versatile segmentation and compositing methods. Static, dynamic and flexible ranges with relative and/or absolute visualizations. Lay
MetaForecast M5
Vahidreza Heidar Gholami
5 (2)
MetaForecast predice e visualizza il futuro di qualsiasi mercato basandosi sull'armonia dei dati dei prezzi. Sebbene il mercato non sia sempre prevedibile, se esiste un modello nei prezzi, MetaForecast può prevedere il futuro con la massima precisione possibile. Rispetto ad altri prodotti simili, MetaForecast può generare risultati più accurati analizzando le tendenze di mercato. Parametri di input Past size (Dimensione passata) Specifica il numero di barre che MetaForecast utilizza per creare
Auto Order Block with break of structure based on ICT and Smart Money Concepts Futures Break of Structure ( BoS )             Order block ( OB )            Higher time frame Order block / Point of Interest ( POI )    shown on current chart           Fair value Gap ( FVG ) / Imbalance   ,  MTF      ( Multi Time Frame )    Volume Imbalance     ,  MTF          vIMB Gap’s Equal High / Low’s     ,  MTF             EQH / EQL Liquidity               Current Day High / Low           HOD /
Quantum Heiken Ashi PRO MT5
Bogdan Ion Puscasu
4.5 (8)
Ti presentiamo   Quantum Heiken Ashi PRO Progettate per fornire informazioni chiare sulle tendenze del mercato, le candele Heiken Ashi sono rinomate per la loro capacità di filtrare il rumore ed eliminare i falsi segnali. Dì addio alle confuse fluttuazioni dei prezzi e dai il benvenuto a una rappresentazione grafica più fluida e affidabile. Ciò che rende il Quantum Heiken Ashi PRO davvero unico è la sua formula innovativa, che trasforma i dati tradizionali delle candele in barre colorate di faci
Il profitto dalla struttura del mercato cambia quando il prezzo si inverte e si ritira. L'indicatore di avviso di inversione della struttura del mercato identifica quando una tendenza o un movimento di prezzo si sta avvicinando all'esaurimento e pronto a invertire. Ti avvisa dei cambiamenti nella struttura del mercato che in genere si verificano quando stanno per verificarsi un'inversione o un forte pullback. L'indicatore identifica inizialmente i breakout e lo slancio del prezzo, ogni volta
Blahtech Supply Demand MT5
Blahtech Limited
4.57 (14)
Was: $299  Now: $99   Supply Demand uses previous price action to identify potential imbalances between buyers and sellers. The key is to identify the better odds zones, not just the untouched ones. Blahtech Supply Demand indicator delivers functionality previously unavailable on any trading platform. This 4-in-1 indicator not only highlights the higher probability zones using a multi-criteria strength engine, but also combines it with multi-timeframe trend analysis, previously confirmed swings
Presentazione       Quantum Breakout PRO   , l'innovativo indicatore MQL5 che sta trasformando il modo in cui scambi le zone di breakout! Sviluppato da un team di trader esperti con un'esperienza di trading di oltre 13 anni,       Quantum Breakout PRO       è progettato per spingere il tuo viaggio di trading a nuovi livelli con la sua strategia innovativa e dinamica della zona di breakout. Quantum Breakout Indicator ti fornirà frecce di segnalazione sulle zone di breakout con 5 zone target
XQ Indicator MetaTrader 5
Marzena Maria Szmit
5 (1)
Step into the realm of Forex trading with confidence and precision using XQ, a cutting-edge Forex indicator designed to elevate your trading game to unprecedented heights. Whether you're a seasoned trader or just stepping into the world of currency exchange, XQ Forex Indicator empowers you with the insights and signals needed to make informed trading decisions. The signal conditions are a combination of three indicators, and XQ Forex Indicator only display  medium and long-term trends . The ind
Owl Smart Levels MT5
Sergey Ermolov
4.49 (37)
Versione MT4  |  FAQ L' indicatore Owl Smart Levels è un sistema di trading completo all'interno dell'unico indicatore che include strumenti di analisi di mercato popolari come i frattali avanzati di Bill Williams , Valable ZigZag che costruisce la corretta struttura a onde del mercato, e i livelli di Fibonacci che segnano i livelli esatti di entrata nel mercato e luoghi per prendere profitti. Descrizione dettagliata della strategia Istruzioni per lavorare con l'indicatore Consulente-assistente
Eng Gold
Ely Alkrar Xshkaky
ENG-GOLD Scalper It is an auxiliary indicator that identifies potential targets and determines the place of entry with a stop loss that works on Heiken Ashi candles  The green lines are usually the targets, the red lines are the stop loss, and the yellow lines are the entry location.  This file is recognized on small and medium frames, usually less than the watch frame I highly recommend using XAUUSD US100 US30 USOIL 
Innanzitutto, è importante sottolineare che questo sistema di trading è un indicatore non repainting, non redrawing e non lagging, il che lo rende ideale per il trading professionale. Il "Sistema di Trading di Supporto e Resistenza Intelligente" è un indicatore avanzato progettato per trader nuovi ed esperti. Permette ai trader di ottenere precisione e fiducia sul mercato forex. Questo sistema completo combina più di 7 strategie, 10 indicatori e varie approcci di trading, tra cui strategie di
Malaysian SNR Levels
Matthias Horst Pieroth
This indicator can be used to display Support and Resistance levels according to  the  Malaysian SNR concept , in which Support and Resistance are exact levels of a line chart. Malaysian SNR There are 3 different horizontal levels in Malaysian SNR: A-Level : This level is located at the peak of this line chart. (shape looks like the letter A) V-Level : Level at the valley of a line chart, (shape looks like the letter V) Gap-Leve l: This level is located at the Close/Open gap between two cand
Was: $249  Now: $99   Market Profile defines a number of day types that can help the trader to determine market behaviour. A key feature is the Value Area, representing the range of price action where 70% of trading took place. Understanding the Value Area can give traders valuable insight into market direction and establish the higher odds trade. It is an excellent addition to any system you may be using. Inspired by Jim Dalton’s book “Mind Over Markets”, this indicator is designed to suit the
Altri dall’autore
KT Stoch Divergence MT5
KEENBASE SOFTWARE SOLUTIONS
Divergence is one of the vital signals that depicts the upcoming price reversal in the market. KT Stoch Divergence shows the regular and hidden divergences build between the price and stochastic oscillator. Limitations of KT Stoch Divergence Using the Stochastic divergence as a standalone entry signal can be risky. Every divergence can't be interpreted as a strong reversal signal. For better results, try to combine it with price action and trend direction. Features Marks regular and hidde
If you trade Forex, having detailed information about the currency strength and currency pairs correlation can take your trading to new heights. The correlation will help to cut your risk in half, and strength analysis will help to maximize the profits. This indicator provides a hybrid approach for selecting the most appropriate currency pairs using the strength analysis and currency pairs correlation. How to use the Currency Strength Analysis Suppose your trading strategy provides a buying o
ACB Breakout Arrows
KEENBASE SOFTWARE SOLUTIONS
4.17 (35)
The ACB Breakout Arrows indicator provides a crucial entry signal in the market by detecting a special breakout pattern. The indicator constantly scans the chart for a settling momentum in one direction and provide the accurate entry signal right before the major move.  Get multi-symbol and multi-timeframe scanner from here - Scanner for ACB Breakout Arrows MT4 Key features Stoploss and Take Profit levels are provided by the indicator. Comes with a MTF Scanner dashboard which tracks the brea
KT Trend Magic MT5
KEENBASE SOFTWARE SOLUTIONS
KT Trend Magic shows the trend depiction on chart using the combination of market momentum and volatility. A smoothing coefficient is used to smooth out the noise from the signal.It can be used to find out the new entries or confirm the trades produced by other EA or indicator. Features Drag n drop MTF scanner which scans for the new signals across multiple time-frames. Find new entries in the trend direction. Improve the accuracy of other indicators when used in conjunction. Can be used as a
KT Currency Strength and Correlation MT5
KEENBASE SOFTWARE SOLUTIONS
5 (1)
If you trade Forex, having detailed information about the currency strength and currency pairs correlation can take your trading to new heights. The correlation will help to cut your risk in half, and strength analysis will help to maximize the profits. This indicator provides a hybrid approach for selecting the most appropriate currency pairs using the strength analysis and currency pairs correlation. How to use the Currency Strength Analysis Suppose your trading strategy provides a buying o
ACB Breakout Arrows MT5
KEENBASE SOFTWARE SOLUTIONS
5 (1)
The ACB Breakout Arrows indicator provides a crucial entry signal in the market by detecting a special breakout pattern. The indicator constantly scans the chart for a settling momentum in one direction and provide the accurate entry signal right before the major move. Get multi-symbol and multi-timeframe scanner from here - Scanner for ACB Breakout Arrows MT 5 Key features Stoploss   and Take Profit levels are provided by the indicator. Comes with a MTF Scanner dashboard which tracks the br
KT Asian Breakout MT5
KEENBASE SOFTWARE SOLUTIONS
KT Asian Breakout carefully analyzes the range-bound market during the Asian session and then fires a long or short trade after doing some preassessment based on its inbuilt technical analysis module. The executed orders are closed within a day before the completion of the next day session. The inbuilt technical analysis module checks for the session range and compares it with the last 20 days price movement. If it finds any erratic price movement within the session, the orders are not execute
KT RSI Divergence Robot MT4
KEENBASE SOFTWARE SOLUTIONS
KT RSI Divergence robot is a 100% automated expert advisor that trades regular and hidden divergence built between the price and Relative Strength Index (RSI) oscillator. The divergence signals are fetched from our freely available RSI divergence indicator. Not every divergence ends up in a successful price reversal, that's why this ea combines the raw divergences signals with its inbuilt technical analysis module to exploit the price inefficiency that occurs after some selected divergence si
KT Ichimoku Trader MT5
KEENBASE SOFTWARE SOLUTIONS
1 (1)
KT Ichimoku Trader is a fully automated expert advisor that offers five popular trading strategies based on the Ichimoku indicator. Each strategy has it's own entry and exit method without any interference to other strategies. The Ichimoku system can be applied to all major currency pairs and metals. However, we found that it performs reasonably well mainly on two pairs.   MT4 Version is available here  https://www.mql5.com/en/market/product/35041 Features Trade up to 5 famous trading strate
KT Heiken Ashi Smoothed MT5
KEENBASE SOFTWARE SOLUTIONS
KT Heiken Ashi Smoothed is a smoothed version of the standard Heiken Ashi. Moreover, it also plots buy/sell arrows on a trend change. A buy arrow is plotted when it change to a bullish state from bearish state. A sell arrow is plotted when it change to a bearish state from bullish state. Mobile notifications, Email, Sound and Pop-up alerts included. What exactly is Heiken Ashi Smoothed? It filters out the false signals and noise in the standard Heiken Ashi. It applies the set of two moving a
KT Trend Magic
KEENBASE SOFTWARE SOLUTIONS
KT Trend Magic shows the trend depiction on chart using the combination of market momentum and volatility. A smoothing coefficient is used to smooth out the noise from the signal.It can be used to find out the new entries or confirm the trades produced by other EA/Indicators. Usage Drag n drop MTF scanner which scans for the new signals across multiple time-frames. Find new entries in the trend direction. Improve the accuracy of other indicators when used in conjunction. Can be used as a dyna
KT Auto Fibo MT5
KEENBASE SOFTWARE SOLUTIONS
5 (1)
KT Auto Fibo draws Fibonacci retracement levels based on the ongoing trend direction. The Highs and Lows are automatically selected using the Maximum and Minimum points available on the chart. You can zoom in/out and scroll to adjust the Fibonacci levels accordingly. Modes Auto:  It draws the Fibonacci levels automatically based on the chart area. Manual:  It draws the Fibonacci levels only one time. After that, you can change the anchor points manually. Usage: Helps to predict the future p
KT CCI Divergence MT5
KEENBASE SOFTWARE SOLUTIONS
KT CCI Divergence shows the regular and hidden divergence created between the price and CCI oscillator. Divergence is one of the vital signals that depicts the upcoming price reversal in the market. Manually spotting the divergence between price and CCI can be a hectic and ambiguous task. Limitations of KT CCI Divergence   Using the CCI divergence as a standalone entry signal can be risky. Every divergence can't be interpreted as a strong reversal signal. For better results, try to combine it
ACB Trade Filter MT4
KEENBASE SOFTWARE SOLUTIONS
5 (2)
The ACB Trade Filter indicator provides a solution for filtering out the low probability trading setups in a trading strategy. The indicator uses a sophisticated filtration algorithm based on the market sentiment and trend. Applications Works great with our indicator " ACB Breakout Arrows ". Filter out low probability signals from any indicator. Avoid overtrading and minimize the losses. Trade in the direction of market sentiment and trend. Avoid the choppiness in the market. How to use Only
KT Momentum Arrows
KEENBASE SOFTWARE SOLUTIONS
KT Momentum Arrows Indicator is based on a momentary breakout which is calculated using the bands deviation and emerging volatility in a certain direction. A buy signal is generated when the price close above the upper band and a sell signal is generated when the price close below the lower band. A magnitude coefficient is used as the input which affects the band deviation and volatility at the same time. The coefficient value should be carefully selected and analyzed based on the instrument and
KT COG Advanced MT4
KEENBASE SOFTWARE SOLUTIONS
1 (1)
KT COG is an advanced implementation of the center of gravity indicator presented by John F. Ehlers in the May 2002 edition of Technical Analysis of Stocks & Commodities magazine. It's a leading indicator which can be used to identify the potential reversal points with the minimum lag. The COG oscillator catches the price swings quite effectively. MT5 version of the same indicator is available here KT COG Advanced MT5 Calculation of COG The COG indicator is consist of the two lines. The mai
KT Pin Bar
KEENBASE SOFTWARE SOLUTIONS
KT Pin Bar identifies the pin bar formation which is a type of price action pattern which depicts a sign of reversal or rejection of the trend. When combined with support and resistance, BRN and other significant levels, Pin Bar pattern proved to be a very strong sign of reversal. Basically, a pin bar is characterized by a small body relative to the bar length which is closed either in upper or lower 50% part of its length. They have very large wicks and small candle body. A pin bar candlest
KT Auto Fibo
KEENBASE SOFTWARE SOLUTIONS
KT Auto Fibo draws Fibonacci retracement levels based on the ongoing trend direction. The Highs and Lows are automatically selected using the Maximum and Minimum points available on the chart. You can zoom in/out and scroll to adjust the Fibonacci levels accordingly. Modes Auto:  It draws the Fibonacci levels automatically based on the chart area. Manual: It draws the Fibonacci levels only one time. After that, you can change the anchor points manually. Usage: Helps to predict the future pr
KT Psar Arrows
KEENBASE SOFTWARE SOLUTIONS
KT Psar Arrows plots the arrows on chart using the standard Parabolic SAR indicator. A bullish arrow is plotted when the candle's high touch the SAR. A bearish arrow is plotted when the candle's low touch the SAR. The signals are generated in the real-time without waiting for the bar close.  Features A beneficial tool for traders who want to experiment with the trading strategies that include the use of Parabolic Sar indicator.  Can be used to find turning points in the market. Use custom PSA
KT Ichimoku Trader
KEENBASE SOFTWARE SOLUTIONS
1 (1)
KT Ichimoku Trader is a fully automated expert advisor that offers five popular trading strategies based on the Ichimoku indicator. Each strategy has it's own entry and exit method without any interference to other strategies. The Ichimoku system can be applied to all major currency pairs and metals. However, we found that it performs reasonably well mainly on two pairs.   MT5 Version is available here  https://www.mql5.com/en/market/product/35043 Features Trade up to 5 famous trading strate
KT Volatility Oscillator
KEENBASE SOFTWARE SOLUTIONS
KT Volatility oscillator analyze the past and current market data with a mathematical formula to display the result in a form of an oscillator. The growing and deteriorating waves are equivalent to high and low volatility in the asset.  In a nutshell, volatility is simply a measurement of the price fluctuation of an asset over a certain period of time. Without volatility, there would not much movement in the market and traders would not be able to profit from the price movements. Use of Volati
KT COG Robot
KEENBASE SOFTWARE SOLUTIONS
KT COG Robot is a fully automated Expert Advisor based on the KT COG Indicator . The COG indicator was originally presented by John F. Ehlers in the May 2002 edition of Technical Analysis of Stocks & Commodities magazine. The EA fires a long trade when COG line cross above the signal line and a short trade is fired when the COG line cross below the signal line.  Adaptive Filtration Our adaptive filtration algorithm combines the original COG formula with the major trend direction and market ac
ACB Breakout Arrows EA
KEENBASE SOFTWARE SOLUTIONS
This is a 100% automated expert advisor based on our custom indicator named "ACB Breakout Arrows" . The entries are based on a breakout pattern that constantly occurs in a bi-directional manner. The intensity of entry signals can be manipulated using the external input called "Signal Sensitivity". MT5 Version is available here  https://www.mql5.com/en/market/product/35785 Trades Confirmation ACB Breakout Arrows EA provides an ability to filter the entries using our another custom indicator n
KT Asian Breakout
KEENBASE SOFTWARE SOLUTIONS
4 (1)
KT Asian Breakout carefully analyzes the range-bound market during the Asian session and then fires a long or short trade after doing some preassessment based on its inbuilt technical analysis module. The executed orders are closed within a day before the completion of the next day session. The inbuilt technical analysis module checks for the session range and compares it with the last 20 days price movement. If it finds any erratic price movement within the session, the orders are not execute
KT London Breakout
KEENBASE SOFTWARE SOLUTIONS
First thirty minutes are essential for a trading session. The early reaction of traders and market players sets a path for the rest of the day. KT London Breakout EA takes advantage of this phenomenon, and after analyzing the first thirty minutes of London session, it places two bidirectional pending orders. One of pending order is eventually canceled after realizing the market direction with certainty. It has been strictly tested and developed for EUR/JPY using 30-Min Time Frame. You can ex
Use of support and resistance in systematic trading is very subjective. Every trader has their own idea and way to plotting the support and resistance levels on the chart. KT Support and Resistance indicator take out this ambiguity out of the situation and automatically draws support and resistance levels following an algorithmic approach using a unique multi-timeframe analysis. When launched on the chart, It immediately scan the most significant extreme points across all the available timefr
MACD Divergence Seeker
KEENBASE SOFTWARE SOLUTIONS
KT MACD Divergence Seeker trades the regular and hidden divergence signals generated by our free indicator named KT MACD Divergence indicator. Trading the standalone divergences can be a risky affair that's why the KT MACD Divergence Seeker combines the standard divergence signals with an advanced analysis module to exploit the price inefficiencies on some FX pairs. What is the Divergence exactly? As a general conception if the price is making higher highs, then macd should also be making
KT Asian Breakout Indicator
KEENBASE SOFTWARE SOLUTIONS
KT Asian Breakout indicator scans and analyzes a critical part of the Asian session to generate bi-directional buy and sell signals with the direction of a price breakout. A buy signal occurs when the price breaks above the session high, and a sell signal occurs when the price breaks below the session low. MT5 Version is available here https://www.mql5.com/en/market/product/41704 Things to remember If the session box is vertically too wide, a new trade should be avoided as most of the price
MACD Divergence MT4
KEENBASE SOFTWARE SOLUTIONS
KT MACD Divergence shows the regular and hidden divergences build between the price and oscillator. If your trading strategy anticipates the trend reversal, you can include the MACD regular divergence to speculate the potential turning points. And if your trading strategy based on the trend continuation, MACD hidden divergence would be a good fit. Limitations of KT MACD Divergence Using the macd divergence as a standalone entry signal can be a risky affair. Every divergence can't be interpr
KT Bollinger Bands Trader MT4
KEENBASE SOFTWARE SOLUTIONS
KT Bollinger Bands Trader is a 100% automated expert advisor that's incorporated a mean reversion trading strategy using the Bollinger bands during the period of low volatility. Price often reacts at the upper or lower line of Bollinger bands, but a reversal not always occurs. However, there is more chance of price reversal during the time of low volatility. Entries A buy trade is activated when price correctly aligns below the bottom line of Bollinger bands. A sell trade is activated when pri
Filtro:
Nessuna recensione
Rispondi alla recensione