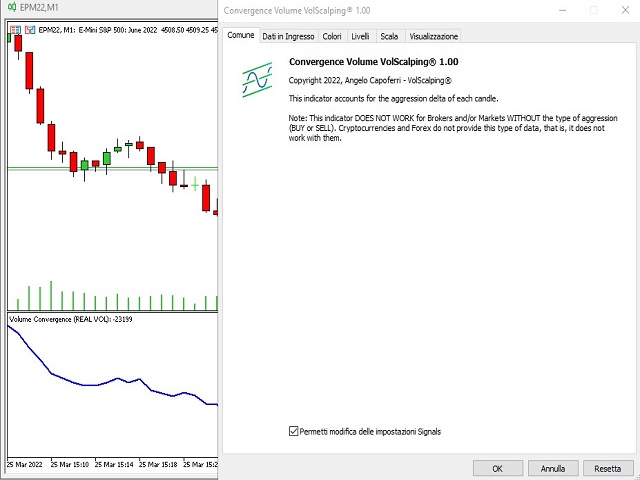
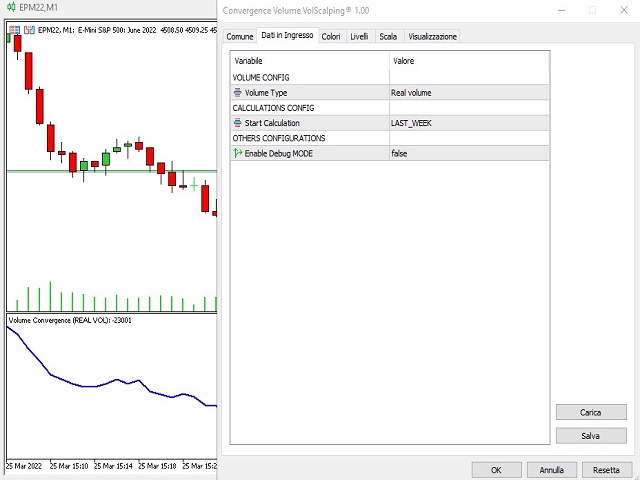
Volume Convergence
- Indicatori
- Angelo Capoferri
- Versione: 1.0
- Attivazioni: 5
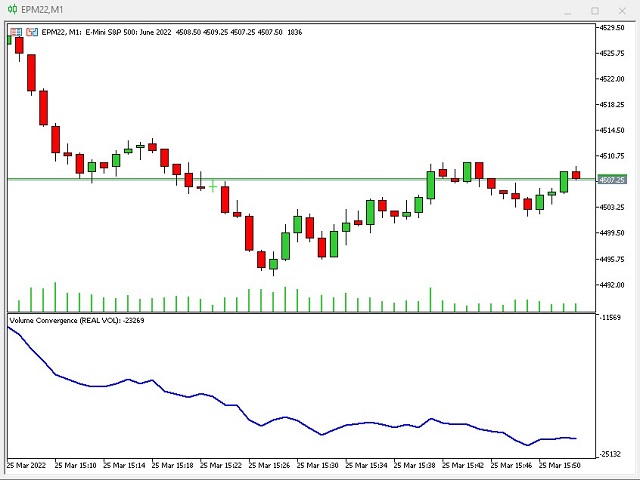
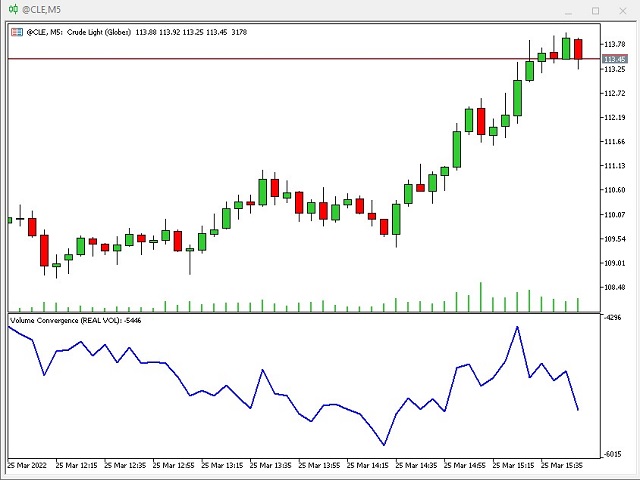
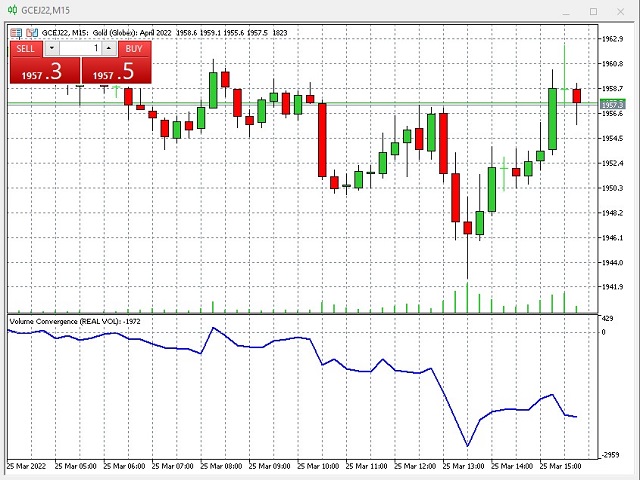
questo indicatore mostra la forza del volume reale rispetto al prezzo.
se il grafico del prezzo e l'andamento del volume hanno lo stesso andamento, significa che tutto è regolare. se l'indicatore è in divergenza rispetto al grafico del prezzo, significa che è prossima l'inversione.
quando il prezzo sale ed il grafico "volume convergence" scende, significa che i soldi stanno uscendo dal mercato, i venditori vendono sulla salita e il prezzo presto dovrebbe iniziare a crollare.
al contrario, se il grafico "volume convergence" sale mentre il grafico del prezzo scende, significa che i compratori, comprano sulle discese ed il rpezzo dovrebbe invertire in salita.
l'indicatore va abbinato ad una strategia di trading valida per filtrare i falsi segnali della stessa.
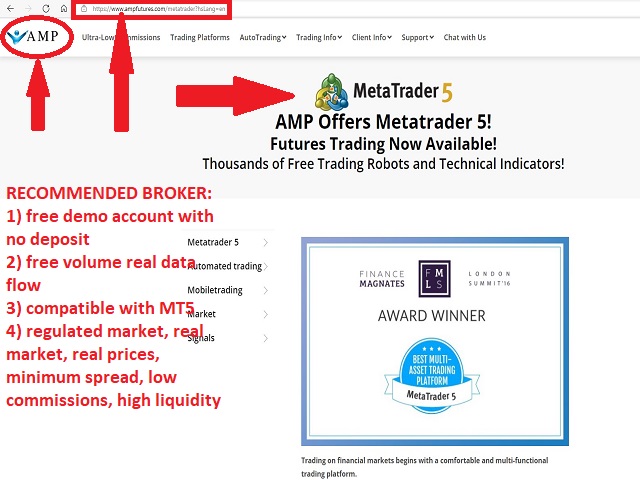
ATTENZIONE: l'indicatore funziona SOLO con broker che offrono il flusso dati volumetrico reale, con la scissione dei contratti battuti in BID E ASK. CFD, CRYPTOVALUTE E FOREX appartenfgono al mercato sintetico, non regolamentato, pertanto non dispongono di queste inforamzioni ed di conseguenza l'indicatore non funziona.
un broker compatibile con mt5 che offre flusso dati reale sul conto demo, senza bisogno di versamento, è AMP FUTURE.