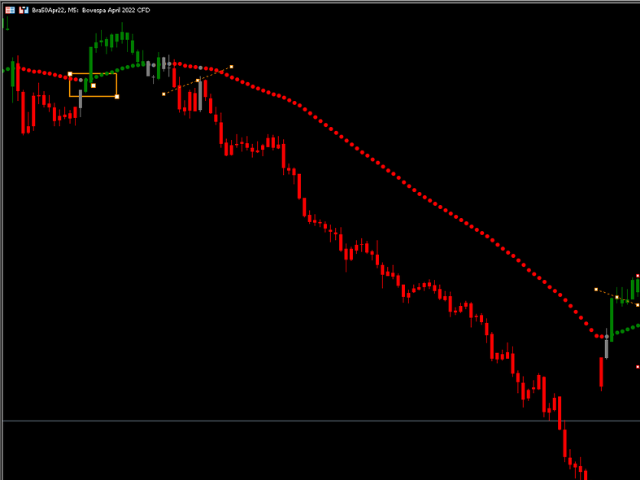
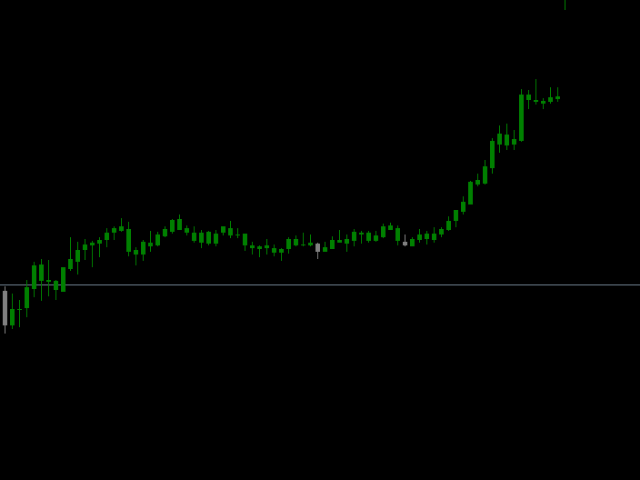
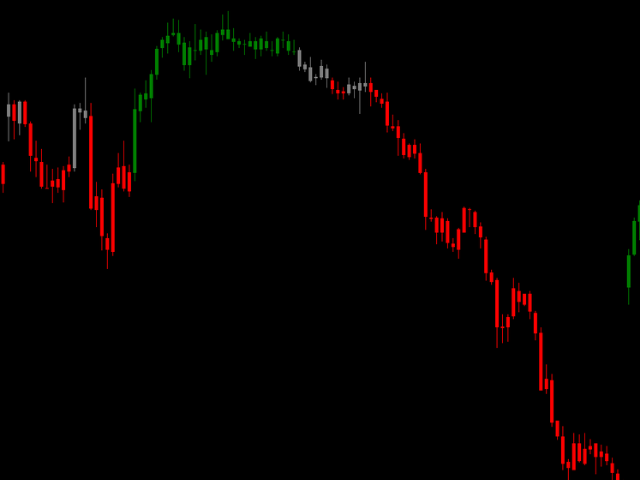
JAC Trend Color Candle
- Indicatori
- Eduardo Da Costa Custodio Santos
- Versione: 1.0
- Attivazioni: 20
L'indicatore "JAC Trend Color Candle" per Meta Trader 5, è stato creato per facilitare visivamente il trend per il trader. Si basa su tre parametri, che identificano il mercato rialzista, ribassista e non-trend. I colori sono configurabili dal trader e anche il trader medio configurabile. i parametri di trend non possono essere configurati in quanto sono differenziali dell'indicatore.