• Panoramica
  • Recensioni (13)
  • Commenti (4)
  • Novità

UPD1 Volume Cluster

4.77

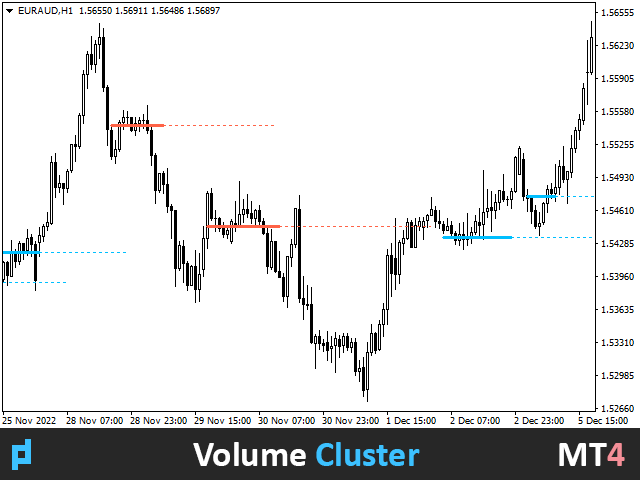
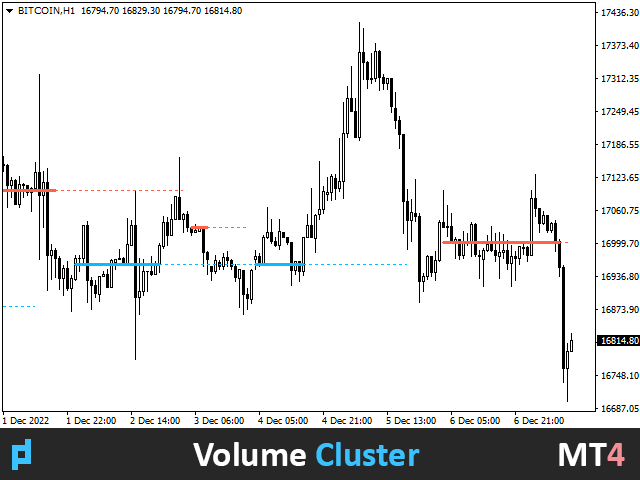
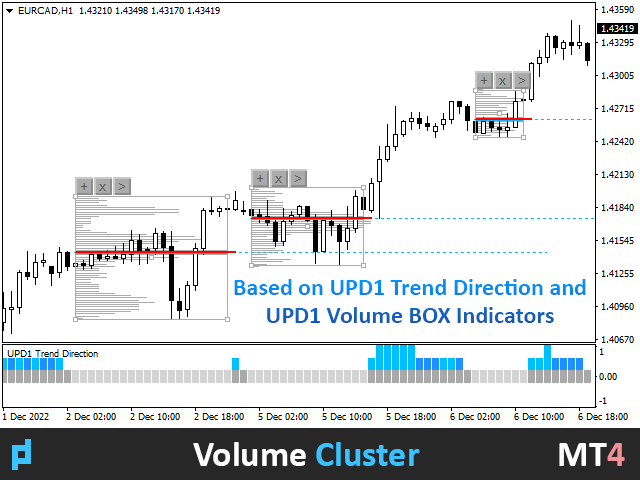
L'algoritmo trova le zone di volatilità ridotta in base all'indicatore UPD1 Trend Direction e traccia il volume orizzontale massimo in base all'indicatore UPD1 Volume Box.

Di norma, un forte movimento di tendenza si verifica quando si esce dall'accumulo. Se il prezzo ha lasciato l'accumulo, può testare il suo volume orizzontale massimo (POC).

Smart Alert sono disponibili nelle impostazioni.


Parametri di input.


Impostazioni di base.

Bars Count – numero di barre della cronologia su cui verrà eseguito l'indicatore.

Timeframe Flat - seleziona il periodo di tempo su cui viene eseguita la ricerca flat e viene creato il cluster. Per impostazione predefinita, è sempre corrente.

Data Source - selezione del periodo di tempo delle quotazioni. Rileva automaticamente (in modo ottimale).

Vertical Step - influisce sulla densità e sulla precisione verticale.

Period - seleziona il periodo dell'oscillatore.

Start Flat After Bar - quante candele ignorare dopo la fine della tendenza per iniziare a disegnare flat.

Minimal Flat Bars - numero minimo di candele in Flat.

ID - numero dell'indicatore .  Selezionare un ID diverso per impostare l'indicatore sul grafico più volte. Ad esempio, con diversi periodi di Flat.


Impostazioni visive.

Cluster Width - POC / spessore della linea del cluster.

Cluster UP / DN Color - selezione del colore della linea.

Extend Line Multiplier - continuazione della linea POC, moltiplicatore. È uguale a 2. La linea viene estesa dello stesso numero di candele moltiplicato per 2.

Extend Line Style - stile della linea di continuazione. Punti. È possibile selezionare la linea tratteggiata, ecc.

Touch First Bar - la linea si ferma al primo tocco.

Draw Current Flat - Visualizza POC flat fino al completamento.

Flat Color - colore della linea POC flat.


Impostazioni degli avvisi.

Alert (1, 2, 3) - attiva/disattiva le impostazioni di notifica.

1. Flat Start - avvisa quando appare una linea grigia del cluster.

2. End of Flat (Probable) - avviso quando il cluster è terminato.

3. Touch Bar - avviso quando il prezzo tocca la linea del cluster.

Repeat Signal - Consenti segnali su candele vicine.

Visual Alert Object - visualizzazione delle icone di allarme.

Alert Work Time - specificare il periodo di tempo in cui l'avviso sarà attivo.

Alert Pop Up - Abilita / Disabilita avviso popup.

Alert Push - abilita / disabilita la notifica sul telefono.

Alert E-mail -  abilita / disabilita la notifica e-mail.

Alert Sound - attiva / disattiva la notifica audio.

Alert Sound Name - seleziona il file di avviso audio.


Recensioni 13
Karlfx4
21
Karlfx4 2023.11.04 10:04 
 

The indicator is exactly what I was looking for it shows hidden distribution and accumulation on a chart, Going see how it performs in real time

Eric Raygoza
133
Eric Raygoza 2023.10.01 09:27 
 

I think this is a very good indicator, have just started using it, Thank you Vitaly.

Suvashish Halder
12710
Suvashish Halder 2023.08.13 05:33 
 

It would be great if you can add 2 Buttons for the Chart. One Button show/hides Cluster Line and another Increase or Decrease Bars(input way) to Scan.

Prodotti consigliati
Market Profile 3
Hussien Abdeltwab Hussien Ryad
4 (4)
Market Profile 3 MetaTrader 4 indicator  — is a classic Market Profile implementation that can show the price density over time, outlining the most important price levels, value area, and control value of a given trading session. This indicator can be attached to timeframes between M1 and D1 and will show the Market Profile for daily, weekly, monthly, or even intraday sessions. Lower timeframes offer higher precision. Higher timeframes are recommended for better visibility. It is also possible t
FREE
Profilo del mercato Forex (FMP in breve) se preferisci vederlo su un grafico in tempo reale invece di leggere la descrizione, puoi scaricare immediatamente una demo gratuita qui. Cosa non è: FMP non è il classico display TPO con codice alfabetico, non mostra il calcolo generale del profilo dati del grafico e non segmenta il grafico in periodi e non li calcola. Cosa fa : Soprattutto, l'indicatore FMP elaborerà i dati che risiedono tra il bordo sinistro dello spettro definito dall'utente
FREE
Pips forex - is a ready trading system . This indicator shows with arrows on the chart when and in what direction you need to open an order. If the arrow is green, then we open a buy deal, and if the arrow is red, then we open a sell deal. Everything is very simple and quite effective. TakeProfit set 15-25 points. StopLoss set at the level of points. When the dots move, we immediately override the StopLoss. Recommended timeframe for trading M1 and M5. This is a scalping strategy and works best
Lisek Weis Wave
Darius Hans Lischka
5 (3)
This Weis Wave Volume indicator is a tool to help traders identify the current price trend.  Understanding volume can provide insight into a market's behavior to help you determine its overall health. The most important rule is this: volume precedes price. Typically, before a market price moves, volume comes into play. It has 2 main colors histogram which are green and red. – Green indicates an upward wave. The more the price increases, the bigger the green volume gets. – The red color shows a d
FREE
This indicator displays the historical bid and ask prices on the chart. This is an extremely useful tool for watching the spread rise and fall, as well as watching to see whether or not the bid and ask prices are converging or diverging. This tool will allow you to enter the market at just the right time. This indicator will help you stay out of the market when the spread begins to rise and help you get into the market as the spread begins to fall again. ON SALE FOR FREE, GET IT FREE FOR A LIM
FREE
BoxInside MT4
Evgeny Shevtsov
4.56 (9)
This indicator calculates the volume profile and places labels that correspond to the VAH, VAL and POC levels, for each candle individually. Indicator operation features The indicator works on the timeframes from M5 to MN, but it uses the history data of smaller periods: M1 - for periods from M5 to H1, M5 - for the H4 period, M30 - for the D1 period, H4 - for the W1 period, D1 - for the MN period. The color and location of the VAL, VAH and POC labels on the current candle are considered to be
FREE
The   Volume Weighted ATR indicator   is a helpful tool for measuring market activity. It is based on the idea of the Volume-Weighted ATR. Combining these two elements helps identify potential turning points or breakout opportunities. The indicator for the classification of the activity of the market uses the moving average and its multiples. Accordingly, where the VWATR bar is located (relative to the moving average), it is labelled as ultra-low, low, average, high, very high or ultra high. Th
FREE
The indicator analyzes the change in the minimum and maximum prices of the previous bars fixing the entrance of the big players. If the change (delta) increases, a signal is displayed on the graph in the form of an arrow. At the same time, virtual trade on history is carried out. In the free version, virtual trade is performed without refills in case of a repeat of the signal. The results of virtual trading in the form of losses / losses, profitability, drawdown and transaction lines are display
FREE
Cumulative Delta MT4
Evgeny Shevtsov
4.69 (35)
The indicator analyzes the volume scale and splits it into two components - seller volumes and buyer volumes, and also calculates the delta and cumulative delta. The indicator does not flicker or redraw, its calculation and plotting are performed fairly quickly, while using the data from the smaller (relative to the current) periods. The indicator operation modes can be switched using the Mode input variable: Buy - display only the buyer volumes. Sell - display only the seller volumes. BuySell -
FREE
PZ Penta O MT4
PZ TRADING SLU
2.25 (4)
The Penta-O is a 6-point retracement harmonacci pattern which usually precedes big market movements. Penta-O patterns can expand and repaint quite a bit. To make things easier this indicator implements a twist: it waits for a donchian breakout in the right direction before signaling the trade. The end result is an otherwise repainting indicator with a very reliable trading signal. The donchian breakout period is entered as an input. [ Installation Guide | Update Guide | Troubleshooting | FAQ | A
FREE
The ProfileVolumesMarket indicator calculates tick volume on each price level in a selected range. Volume is vital when determining strength and therefore significance of price levels. The calculation range is set by a trader by means of moving two vertical lines. Thus the indicator allows to track important levels on different steps of a symbol price formation. A histogram of volume profile can be displayed on the chart (or removed from the chart) if you press "ON" ("OFF") button. When you chan
BoxProfile MT4
Evgeny Shevtsov
4.8 (15)
The indicator displays volume profiles based on the nesting principle. Profiles periods are pre-set so that each subsequent profile has a length twice as long as the length of the previous profile. In addition to profiles, the indicator displays volume clusters sorted by color, depending on the volume they contain. Indicator operation features The indicator works on typical timeframes from M5 to MN, but for calculations uses historical data from smaller timeframes: M1 - for timeframes from M5
FREE
Investment Castle Volatility Index MT4
Ahmed Alaaeldin Abdulrahman Ahmed Elherzawi
3.67 (3)
Investment Castle Volatility Index has the following features: 1. This indicator shows the volumes of the current symbol and the market volatility. 2. This indicator is built-in in the Investment Castle EA which works as volatility index for the EA dynamic distance and opposite start. 3. Parameters available for optimization for each pairs. 4. Works with any chart.
FREE
Moving Average Convergence Divergence (MACD) combined with Traders Dynamic Index (TDI) Input parameters: signal mode: true if you want to plug it into STAT (Signal Tester and Trader) arrow shift: distance between TDI line to arrow on chart middle band: use middle band (middle bolinger band) signal filter price line: use 50 price line signal filter RSI period RSI price method volatility period moving average RSI period moving average signal period moving average method use MACD indicator fast MAC
FREE
Sweet VWAP
Francisco Gomes Da Silva
3.67 (3)
Scopri dove le grandi istituzioni stanno negoziando e ottimizza i tuoi investimenti con l'Indicatore VWAP Ancorata Gratuito per MetaTrader 4. Scopri il prezzo a cui le grandi istituzioni stanno effettuando le negoziazioni con il nostro Indicatore VWAP Ancorata Gratuito per MetaTrader 4! Ora puoi risparmiare il tuo prezioso tempo automatizzando la creazione delle VWAP ancorate ai massimi e minimi di mercato. La nostra versione gratuita ti consente di visualizzare facilmente la VWAP in tempo reale
FREE
AQ XFifteen
HIT HYPERTECH INNOVATIONS LTD
4.36 (11)
Χ15 indicator is a MetaTrader 4 tool that allows you to BUILD & BACKTEST ON REAL TIME your own strategies quickly, easily and efficiently. It contains 15 of the most popular technical analysis indicators that you can use, each one in a different way. Choose the indicators that you want to use, select how you will use them and you will see on the chart BUY (green) and SELL (red) arrows implementing your strategy. Choose Take Profit and Stop Loss and you will see the results of your strategy with
FREE
VWap Bands EForex
Veridiana Adorno Kendrick
VWAP Bands Metatrader 4 Forex Indicator The VWAP Bands Metatrader 4 Forex indicator is a quite similar to the Bollinger bands, but it deploys volume weighted average as the core value of the bands. There is an option of using the tick volume or real volume for calculation when using the VWAP Bands Metatrader 5 custom forex indicator, especially when the forex broker displays symbol alongside real volume. Similarly, you can decide to have deviations calculated with the sample correction or not
Symbol Overlay
John Louis Fernando Diamante
5 (2)
This indicator plots another symbol on the current chart. A different timeframe can be used for the symbol, with an option to display in multiple timeframe mode (1 overlay candle per several chart candles). Basic indicators are provided. To adjust scaling of prices from different symbols, the overlay prices are scaled to the visible chart price space. Features symbol and timeframe input MTF display option to vertically invert chart, eg overlay USDJPY, invert to show JPYUSD data window values
FREE
Traditional MACD MT4
Daniel Lewis
4.59 (69)
MACD indicator in MetaTrader 4/5 looks different than MACD does in most other charting software. That is because the MetaTrader 4/5 version of MACD displays the MACD line as a histogram when it is traditionally displayed as a line. Additionally, the MetaTrader 4/5 version computes the Signal line using an SMA, while according to MACD definition it is supposed to be an EMA. The MetaTrader 4/5 version also does not compute a true MACD Histogram (the difference between the MACD/Signal lines). This
FREE
TSim
Sergey Kruglov
Утилита  TSim   позволяет симулировать ручную торговлю в Тестере Стратегий MetaTrader 4. В панеле можно устанавливать размеры лота, тейпрофита и стоплосса. Панель имеет кнопки Sell   и Buy для выставления рыночных ордеров, а также кнопки CloseSell, CloseBuy и CloseAll для быстрого закрытия ордеров. Под панелью отображается список открытых ордеров. Внимание. Панель работает только в Визуальном режиме Тестера Стратегий MetaTrader 4.
FREE
Rainbow MT4
Jamal El Alama
Rainbow MT4 is a technical indicator based on Moving average with period 34 and very easy to use. When price crosses above MA and MA changes color to green, it’s a signal to buy. When price crosses below MA and MA changes color to red, it’s a signal to sell. The Expert advisor ( Rainbow EA MT4) based on Rainbow MT4 indicator, as you can see in the short video below is now available here .
FREE
MT Supply Demand
Issara Seeboonrueang
4.33 (6)
MT Supply Demand : It is an indicator created to find supply and demand, which will be important support and resistance levels for the price.  It can be set pending orders or used in conjunction with other indicators to send buy or sell signals. PLATFROM: MT4 Only TRADE: Forex   TIME FRAME:  All Time Frame SYMBOL PAIR: All Symbol    SETTINGS: Supply & Demand : ON | OFF  Candle MA: Set the MA to change the candle color to show the trend. Show Symbol : ON | OFF It's a free v
FREE
This is Demo Version of PipsFactoryMonthly This indicator depends on High and Low price of Currency in last Month and then i made some secret equations to draw 10 lines. Features You will know what exactly price you should enter the market. You will know when to be out of market. You will know you what should you do in market: Buy Sell Take profit and there are 3 levels to take your profit Support Resistance Risk to buy Risk to Sell Signal Types and Timeframe Used You can use this indicator
FREE
In the age of speed, everyone wants to gets what he/she wants quickly. Trading is all about gaining money, and scalping is a way of doing it in a short time. The "Scorpion Scalper Pro" has been named on the scorpion because of its speed. The indicator serves to provide signals for the M15 timeframe. It also sends Alerts (window alert, email alert, push notification alert) whenever a buy/sell signal occurs, and the alerts are customizable (they can be turned ON or OFF). Indicator inputs : - Buy
Mirror chart
Salavat Yulamanov
4.8 (5)
L'indicatore mostra due coppie diverse su un grafico, progettate per semplificare le informazioni visualizzate,     In grado di lavorare con quasi tutti gli strumenti disponibili nel terminale (non solo coppie di valute, ma anche metalli e materie prime). Caratteristica dell'utilizzo di un metodo di correlazione visiva per qualsiasi        coppia di valute   Sottosimbolo. La coppia di valute viene visualizzata sullo schermo con candele colorate. Questa è la stessa coppia correlata.   Mirrorin
FREE
TrendPlus
Sivakumar Subbaiya
4.21 (14)
Trend Plus   Trendplus  Indicator   Time Frame: Suitable for any time frame.  Purpose: Trend Prediction. Blue and red candle indicate the buy and sell call respectively. Buy: When the blue candle is formed buy call is initiated. close the buy trades when the next red candle will formed.   Sell: When the Red candle is formed Sell call is initiated. close the Sell trades when the next blue candle will formed.   Happy trade!!
FREE
Extremum Reverse Bar
Yurij Izyumov
3.55 (11)
This indicator has been created for finding the probable reversal points of the symbol price. A small candlestick reversal pattern is used it its operation in conjunction with a filter of extremums. The indicator is not redrawn! If the extremum filter is disabled, the indicator shows all points that have a pattern. If the extremum filter is enabled, the condition works – if the history Previous bars 1 candles back contains higher candles and they are farther than the Previous bars 2 candle, such
FREE
Highlights trading sessions on the chart The demo version only works on the AUDNZD chart!!! The full version of the product is available at: (*** to be added ***) Trading Session Indicator displays the starts and ends of four trading sessions: Pacific, Asian, European and American. the ability to customize the start/end of sessions; the ability to display only selected sessions; works on M1-H2 timeframes; The following parameters can be configured in the indicator: TIME_CORRECTION = Cor
FREE
Zig Zag reading structure
Maria Cristina Sabatini
'Zig Zag Percentage strenght'   This indicator is awesome. Why? It's able to show the percentage of the last leg, compared with the previous leg. In this way you have a better understanding of the forces in play in that moment.   In fact, for example, if you see that the up extensions are, in percentage, greater of the down legs, that means that there is more bullish pressure or maybe the market is starting to reverse from downtrend to uptrend.   Hope you will ind it useful !
Introduction This indicator detects volume spread patterns for buy and sell opportunity. The patterns include demand and supply patterns. You might use each pattern for trading. However, these patterns are best used to detect the demand zone (=accumulation area) and supply zone (=distribution area). Demand pattern indicates generally potential buying opportunity. Supply pattern indicates generally potential selling opportunity. These are the underlying patterns rather than direct price action. T
FREE
Gli utenti di questo prodotto hanno anche acquistato
Gann Made Easy
Oleg Rodin
4.96 (47)
Gann Made Easy è un sistema di trading Forex professionale e facile da usare che si basa sui migliori principi del trading utilizzando la teoria di mr. WD Gann. L'indicatore fornisce segnali ACQUISTA e VENDI accurati, inclusi i livelli di Stop Loss e Take Profit. Puoi fare trading anche in movimento utilizzando le notifiche PUSH. Vi prego di contattarmi dopo l'acquisto! Condividerò i miei consigli di trading con te e fantastici indicatori bonus gratuitamente! Probabilmente hai già sentito parlar
Atomic Analyst
Issam Kassas
5 (1)
Innanzitutto, vale la pena sottolineare che questo indicatore di trading non è repaint, non è ridisegno e non presenta ritardi, il che lo rende ideale sia per il trading manuale che per quello automatico. L'Analista Atomico è un indicatore di azione del prezzo PA che utilizza la forza e il momentum del prezzo per trovare un miglior vantaggio sul mercato. Dotato di filtri avanzati che aiutano a rimuovere rumori e segnali falsi, e aumentare il potenziale di trading. Utilizzando più strati di in
Gold Stuff
Vasiliy Strukov
4.89 (250)
Gold Stuff è un indicatore di tendenza progettato specificamente per l'oro e può essere utilizzato anche su qualsiasi strumento finanziario. L'indicatore non ridisegna e non è in ritardo. Periodo consigliato H1. Su di esso l'indicatore funziona in modo completamente automatico Expert Advisor EA Gold Stuff. Lo trovi nel mio profilo. Contattami subito dopo l'acquisto per avere le impostazioni e un bonus personale!   IMPOSTAZIONI Disegna freccia - acceso spento. disegnando frecce sul grafi
ATTUALMENTE SCONTATO DEL 26% La soluzione migliore per ogni principiante o trader esperto! Questo indicatore è uno strumento di trading unico, di alta qualità e conveniente perché abbiamo incorporato una serie di caratteristiche proprietarie e una nuova formula. Con un solo grafico è possibile leggere la forza delle valute per 28 coppie Forex! Immaginate come migliorerà il vostro trading perché sarete in grado di individuare l'esatto punto di innesco di una nuova tendenza o di un'opportunit
Innanzitutto, vale la pena sottolineare che questo Strumento di Trading è un Indicatore Non-Ridipingente, Non-Ridisegnante e Non-Laggante, il che lo rende ideale per il trading professionale. L'Indicatore Smart Price Action Concepts è uno strumento molto potente sia per i nuovi che per i trader esperti. Racchiude più di 20 utili indicatori in uno solo, combinando idee di trading avanzate come l'Analisi del Trader del Circolo Interno e le Strategie di Trading dei Concetti del Denaro Intelligen
Scalper Vault
Oleg Rodin
5 (27)
Scalper Vault è un sistema di scalping professionale che ti fornisce tutto il necessario per scalping di successo. Questo indicatore è un sistema di trading completo che può essere utilizzato dai trader di forex e opzioni binarie. L'intervallo di tempo consigliato è M5. Il sistema fornisce segnali di freccia accurati nella direzione della tendenza. Ti fornisce anche i segnali più alti e più bassi e i livelli di mercato di Gann. Gli indicatori forniscono tutti i tipi di avvisi, comprese le notifi
TPSproTREND PrO
Roman Podpora
5 (15)
TPSpro TRENDPRO  - is a trend indicator that automatically analyzes the market and provides information about the trend and each of its changes, as well as giving signals for entering trades without redrawing! The indicator uses each candle, analyzing them separately. referring to different impulses - up or down impulse. Exact entry points into transactions for currencies, crypto, metals, stocks, indices!  -  Version MT5               DETAILED DESCRIPTION        /       TRADING SETUPS           
Trend Screener
STE S.S.COMPANY
4.83 (86)
Indicatore di tendenza, soluzione unica rivoluzionaria per il trading di tendenze e il filtraggio con tutte le importanti funzionalità di tendenza integrate in un unico strumento! È un indicatore multi-timeframe e multi-valuta al 100% non ridipingibile che può essere utilizzato su tutti i simboli/strumenti: forex, materie prime, criptovalute, indici e azioni. Trend Screener è un indicatore di tendenza che segue un indicatore efficiente che fornisce segnali di tendenza a freccia con punti nel gra
Attualmente 20% di sconto! La soluzione migliore per ogni principiante o trader esperto! Questo software per cruscotti funziona su 28 coppie di valute. Si basa su 2 dei nostri indicatori principali (Advanced Currency Strength 28 e Advanced Currency Impulse). Offre un'ottima panoramica dell'intero mercato Forex. Mostra i valori di forza delle valute avanzate, la velocità di movimento delle valute e i segnali per 28 coppie Forex in tutti i (9) timeframe. Immaginate come migliorerà il vostro t
Scalper Inside PRO
Alexey Minkov
4.75 (55)
SALE NOW! Limited Time Offer! An exclusive indicator that utilizes an innovative algorithm to swiftly and accurately determine the market trend. The indicator automatically calculates opening, closing, and profit levels, providing detailed trading statistics. With these features, you can choose the most appropriate trading instrument for the current market conditions. Additionally, you can easily integrate your own arrow indicators into Scalper Inside Pro to quickly evaluate their statistics and
Market Reversal Alerts
LEE SAMSON
4.21 (121)
Il profitto dalla struttura del mercato cambia quando il prezzo si inverte e si ritira. L'indicatore di avviso di inversione della struttura del mercato identifica quando una tendenza o un movimento di prezzo si sta avvicinando all'esaurimento e pronto a invertire. Ti avvisa dei cambiamenti nella struttura del mercato che in genere si verificano quando stanno per verificarsi un'inversione o un forte pullback. L'indicatore identifica inizialmente i breakout e lo slancio del prezzo, ogni volta
TPSpro RFI Levels
Roman Podpora
5 (13)
A key element in trading is zones or levels from which decisions to buy or sell a trading instrument are made. Despite attempts by major players to conceal their presence in the market, they inevitably leave traces. Our task was to learn how to identify these traces and interpret them correctly. Reversal First Impulse levels (RFI)   -  Version MT5                INSTRUCTIONS                 RUS                 ENG                                       R ecommended to use with an indicator   -  
Presentazione       Quantum Trend Sniper Indicator   , l'innovativo indicatore MQL5 che sta trasformando il modo in cui identifichi e scambi le inversioni di tendenza! Sviluppato da un team di trader esperti con un'esperienza di trading di oltre 13 anni,       Indicatore Quantum Trend Sniper       è progettato per spingere il tuo viaggio di trading verso nuove vette con il suo modo innovativo di identificare le inversioni di tendenza con una precisione estremamente elevata. *** Acquista Quant
Quantum Breakout Indicator PRO
Bogdan Ion Puscasu
4.96 (26)
Presentazione       Quantum Breakout PRO   , l'innovativo indicatore MQL5 che sta trasformando il modo in cui scambi le zone di breakout! Sviluppato da un team di trader esperti con un'esperienza di trading di oltre 13 anni,   Quantum Breakout PRO   è progettato per spingere il tuo viaggio di trading a nuovi livelli con la sua strategia innovativa e dinamica della zona di breakout. Quantum Breakout Indicator ti fornirà frecce di segnalazione sulle zone di breakout con 5 zone target di prof
Advanced Supply Demand
Bernhard Schweigert
4.92 (310)
CURRENTLY 26% OFF !! Best Solution for any Newbie or Expert Trader! This indicator is a unique, high quality and affordable trading tool because we have incorporated a number of proprietary features and a new formula. With this update, you will be able to show double timeframe zones. You will not only be able to show a higher TF but to show both, the chart TF, PLUS the higher TF: SHOWING NESTED ZONES. All Supply Demand traders will love it. :) Important Information Revealed Maximize the potenti
Scopri il segreto per il trading Forex di successo con il nostro indicatore MT4 personalizzato! Ti sei mai chiesto come raggiungere il successo nel mercato Forex, guadagnando costantemente profitti minimizzando il rischio? Ecco la risposta che hai cercato! Permettici di presentare il nostro indicatore MT4 proprietario che rivoluzionerà il tuo approccio al trading. Versatilità unica Il nostro indicatore è appositamente progettato per gli utenti che preferiscono le formazioni di candele Ren
Presentazione dell'indicatore Miraculous Forex: Libera il potere del trading preciso Sei stanco di cercare il miglior indicatore Forex che fornisca risultati eccezionali su tutti i timeframe? Non cercare oltre! L'indicatore Miraculous Forex è qui per rivoluzionare la tua esperienza di trading e portare i tuoi profitti a nuove vette. Basato su tecnologia all'avanguardia e anni di sviluppo accurato, l'indicatore Miraculous Forex si distingue come l'apice di potenza e precisione nel mercato delle v
Break and Retest
Mohamed Hassan
5 (2)
Break & Retest is unstoppable when combined with our other divergence indicator. After purchase, send us a message and you could get this  2nd indicator  for  FREE  as a  BONUS! ‍You can visually backtest Break & Retest to see how it behaved in the past!    Manual guide:   Click here $59  for the first 25 copies ( 4  left)! Next price is $120 .  After many months of hard work and dedication, we are extremely proud to present you our  Break and Retest price action indicator crea
Entry Points Pro
Yury Orlov
4.7 (225)
Indicatore top per MT5 che fornisce segnali accurati per entrare in un trade senza riverniciare! Può essere applicato a qualsiasi attività finanziaria: forex, criptovalute, metalli, azioni, indici.  La versione MT5 è qui Fornirà segnali di trading piuttosto precisi e ti dirà quando è meglio aprire un trade e chiuderlo. Guarda il video (6:22) con un esempio di elaborazione di un solo segnale che ha ripagato l'indicatore! La maggior parte dei trader migliora i propri risultati di trading
Currency Strength Wizard è un indicatore molto potente che ti fornisce una soluzione all-in-one per un trading di successo. L'indicatore calcola la potenza di questa o quella coppia forex utilizzando i dati di tutte le valute su più intervalli di tempo. Questi dati sono rappresentati in una forma di indice di valuta facile da usare e linee elettriche di valuta che puoi utilizzare per vedere il potere di questa o quella valuta. Tutto ciò di cui hai bisogno è collegare l'indicatore al grafico che
TrendMaestro
Stefano Frisetti
5 (2)
nota: questo indicatore e' per METATRADER4, se vuoi la versione per  METATRADER5 questo e' il link:  https://www.mql5.com/it/market/product/108123 TRENDMAESTRO riconosce un nuovo TREND sul nascere, non sbaglia mai. La sicurezza di identificare un nuovo TREND non ha prezzo. DESCRIZIONE TRENDMAESTRO identifica un nuovo TREND sul nascere, questo indicatore prende in esame la volatilita' i volumi ed il momentum per identificare il momento in cui c'e' un'esplosione di uno  opiu' di questi dati
TrendDecoder Premium
Christophe, Pa Trouillas
5 (3)
Identificare i range e le prossime mosse probabili   |  Ottenere i primi segnali e la forza delle tendenze   |  Ottenere uscite chiare prima dell'inversione   |  Individuare i livelli di Fibo che il prezzo testerà Indicatore non tracciante e non ritardato - ideale per il trading manuale e automatizzato - adatto a tutti gli asset e a tutte le unità temporali Offerta limitata nel tempo >>   50% OFF Dopo l'acquisto, contattatemi su questo canale  per le impostazioni personalizzate. Versione   MT5 :
AVVISO DI ACQUISTO E VENDITA MULTIVALUTA e MULTITIMEFRAME. AUTO TAILING STOP E RISCHIO PREMIO TAKEPROFIT! L'INDICATORE SCANSIONA E ANALIZZA IL MERCATO COSÌ NON HAI NULLA DA FARE! SCAMBIA TUTTE LE TUE VALUTE SU 1 TABELLA!   Dopo l'acquisto lascia un commento contattami e ti invierò l'assistente commerciale EA. L'indicatore utilizza diversi oscillatori e filtri allegati per trovare i migliori punti di ingresso CONFERMATI, quindi non devi preoccuparti di questo! Ti avviserà e disegnerà un pu
FX Power MT4 NG
Daniel Stein
5 (8)
Ricevi il tuo aggiornamento quotidiano sul mercato con dettagli e schermate tramite il nostro Morning Briefing qui su mql5 e su Telegram ! FX Power MT4 NG è la nuova generazione del nostro popolare misuratore di forza delle valute, FX Power. Cosa offre questo misuratore di forza di nuova generazione? Tutto ciò che avete amato dell'FX Power originale IN PIÙ Analisi della forza di ORO/XAU Risultati di calcolo ancora più precisi Periodi di analisi configurabili individualmente Limite di calcolo pe
Trend Forecasting
Mohamed Hassan
5 (15)
This indicator is unstoppable when combined with our other indicator called Katana. After purchase, send us a message and you could get Katana for FREE as a BONUS After purchase, send us a private message for your instructions.  MT5 version: click here 3 copies left available at $45. Next price is $99. Don't miss this great deal!  The Trend Forecasting indicator is a very unique & easy tool that is able to make prediction about future price movement based on the signals generated
Price Action Entry Alerts
Stephen Sanjeeve Sahayam
5 (3)
Questo indicatore controlla ogni barra per la pressione di acquisto o vendita e identifica 4 tipi di modelli di candele con il volume più alto. Queste candele vengono quindi filtrate utilizzando diversi filtri lineari per mostrare segnali di acquisto o vendita. I segnali funzionano meglio, in combinazione con una direzione temporale più elevata e quando scambiati durante le ore ad alto volume. Tutti i filtri sono personalizzabili e funzionano in modo indipendente. Può visualizzare i segnali di
Advanced Currency IMPULSE with ALERT
Bernhard Schweigert
4.91 (494)
ATTUALMENTE SCONTATO DEL 31%! La soluzione migliore per ogni principiante o trader esperto! Questo indicatore è uno strumento di trading unico, di alta qualità e conveniente perché abbiamo incorporato una serie di caratteristiche proprietarie e una formula segreta. Con un solo grafico fornisce avvisi per tutte le 28 coppie di valute. Immaginate come migliorerà il vostro trading perché sarete in grado di individuare l'esatto punto di innesco di una nuova tendenza o opportunità di scalping!
FX Volume
Daniel Stein
4.6 (35)
Ricevi il tuo aggiornamento quotidiano sul mercato con dettagli e schermate tramite il nostro Morning Briefing qui su mql5 e su Telegram ! FX Volume è il PRIMO e UNICO indicatore di volume che fornisce una visione REALE del sentiment del mercato dal punto di vista del broker. Fornisce informazioni straordinarie su come gli operatori di mercato istituzionali, come i broker, sono posizionati sul mercato Forex, molto più velocemente dei rapporti COT. Vedere queste informazioni direttamente sul vo
Up down v6T
Guner Koca
5 (1)
Thise indicator is up down v6  comes with tradingwiev version. purchased people, after installed on terminal ,contact me on mql5  to get BONUS  TradingView version. up-down indicator is no repaint and works all pairs and lower than weekly time frames charts. it is suitable also 1 m charts for all pairs. and hold long way to signal. dont gives too many signals. when red histogram cross trigger line that is up signal.and price probably will down when blue histogram cross trigger line that is dow
Disegna automaticamente i livelli di supporto e resistenza PIÙ i gap delle candele di propulsione sul vostro grafico, in modo da poter vedere dove il prezzo potrebbe dirigersi successivamente e/o potenzialmente invertire. Questo indicatore è stato progettato per essere utilizzato come parte della metodologia di trading di posizione insegnata sul mio sito web (The Market Structure Trader) e visualizza informazioni chiave per il targeting e le potenziali entrate. L'indicatore presenta 2 funzi
Altri dall’autore
UPD1 Volume BOX
Vitaliy Kuznetsov
5 (14)
L'indicatore mostra il profilo del volume orizzontale nell'area specificata (BOX) e il volume massimo (POC). Caratteristiche del prodotto. 1. Puoi usare i tick o solo il prezzo. 2. Spaziatura della griglia adattiva (M1-MN). 3. Fase di ricerca adattiva ad alto volume (mediana) a seconda delle dimensioni della casella. 4. Colore camaleonte automatico per linee di scatole e pulsanti. 5. Caselle multiple, facili da creare ed eliminare. 6. Area del volume del 70% (abilitata nelle impostazioni). 7. 
L'indicatore costruisce un semaforo a tre periodi e un pattern di inversione 123 dall'estremo. Il segnale arriva all'apertura della seconda candela. Questo pattern può essere negoziato in diversi modi (test point 3, breakout e altri). L'uscita dal canale o il breakout della trendline è il principale fattore scatenante per trovare un punto di ingresso. Le icone sono colorate in base ai livelli di Fibonacci. Le icone gialle indicano il test di un livello al quale il segnale è amplificato. Utilizz
Pannello di trading con ordini preimpostati e calcolo automatico del lotto per il terminale MT4. Attenzione, il Trading Panel non funziona nel tester della strategia (solo il test del trailing stop). Manuale, Descrizione, Download Light Demo. I trader di successo si distinguono per l'autodisciplina e la gestione competente. Se usi un lotto fisso, allora sei a rischio. Dopotutto, in diversi intervalli di tempo, una distanza diversa e una transazione in perdita possono bloccare diversi profitti. S
UPD1 Trend Direction
Vitaliy Kuznetsov
4.75 (8)
Questo indicatore viene utilizzato per visualizzare le posizioni piatte e di tendenza. Il design si basa su un oscillatore. Viene utilizzato come filtro aggiuntivo, sia per il trading su un grafico normale che per le opzioni binarie. Le posizioni piatte vengono utilizzate nell'indicatore UPD1 volume Cluster per il trading secondo il concetto di Smart Money. Un avviso incorporato segnala i luoghi più ipercomprati / ipervenduti. Parametri di input. Impostazioni di base. Bars Count - specifica
FREE
UPD1 Profile Levels MT5
Vitaliy Kuznetsov
5 (3)
L'indicatore trova i livelli del volume di prezzo massimo e minimo (profilo di mercato) nell'istogramma di lavoro per il numero specificato di barre.   Profilo composito. L'altezza dell'istogramma è completamente automatica e si adatta a qualsiasi strumento e periodo di tempo. Viene utilizzato l'algoritmo dell'autore e non ripete analoghi noti. L'altezza dei due istogrammi è approssimativamente uguale all'altezza media della candela. Smart alert (smart alert) ti aiuta a comunicare il prezzo rela
UPD1 Volume Footer
Vitaliy Kuznetsov
5 (8)
L'indicatore mostra il volume verticale. Nelle impostazioni ci sono 2 fattori per determinare l'alto e l'estremo e 1 per determinare il basso volume. Un algoritmo simile viene utilizzato anche nell'indicatore UPD1 Volume Pixel . Quando viene rilevato un volume specificato, l'istogramma viene colorato nel colore corrispondente. La larghezza dell'istogramma viene selezionata automaticamente, a seconda della scala. Di norma, il prezzo reagisce al volume massimo e minimo. Ma è necessario utilizzare
FREE
UPD1 Pin Bar Dashboard
Vitaliy Kuznetsov
5 (2)
L'indicatore visualizza il modello di candela della barra Pin. Le impostazioni del rapporto consentono di regolare facilmente il rapporto tra ombra, corpo e dimensione. È possibile filtrare per tendenza (2 medie mobili) e per inversione (RSI e bande di Bollinger). Questo è il modello più popolare di Price Action. Disponibile cruscotto multivaluta. Con esso, puoi passare facilmente da un grafico all'altro. Modelli di trading: Retest per tendenza. Falsa ripartizione. Terzo. EURUSD, GBPUSD, XA
UPD1 Volume TimeFrame POC
Vitaliy Kuznetsov
5 (3)
L'indicatore visualizza il volume orizzontale massimo nel periodo di tempo selezionato. Basato sull'indicatore UPD1 Volume Box . Le linee possono essere collegate o separate. Nelle impostazioni, è possibile abilitare l'avviso Smart Touch. Tale indicatore sarà utile per coloro che commerciano utilizzando il profilo di mercato e il concetto di Smart Money. Parametri di input. Impostazioni di base. Bars Count - specifica il numero di barre su cui verrà disegnato TF POC. Data Source - periodo d
FREE
UPD1 Impulse Level
Vitaliy Kuznetsov
5 (8)
L'indicatore trova le onde impulsive sul grafico. Analizza la rottura del canale frattale e costruisce i livelli di impulso.  Inoltre, Trova i luoghi presunti Di false rotture e sequestro di liquidità. Nelle impostazioni, è possibile abilitare il dashboard multivaluta e selezionare qualsiasi strumento e intervallo di tempo. Avviso scegli tra il programma corrente o l'intero elenco. Ci sono segnali separati di impulso e falsa rottura. Blog-Link -  Retest and Fake Breakout with UPD1 . Modelli
UPD1 Profile Levels
Vitaliy Kuznetsov
5 (6)
L'indicatore trova i livelli del volume di prezzo massimo e minimo (profilo di mercato) nell'istogramma di lavoro per il numero specificato di barre.   Profilo composito. L'altezza dell'istogramma è completamente automatica e si adatta a qualsiasi strumento e periodo di tempo. Viene utilizzato l'algoritmo dell'autore e non ripete analoghi noti. L'altezza dei due istogrammi è approssimativamente uguale all'altezza media della candela. Smart alert (smart alert) ti aiuta a comunicare il prezzo rel
UPD1 Watermark MT4
Vitaliy Kuznetsov
5 (1)
L'indicatore visualizza qualsiasi testo e qualsiasi immagine sul grafico e può anche visualizzare le informazioni richieste dalle macro. Sono disponibili tre blocchi di testo e un blocco per le immagini. Sono disponibili la selezione dei caratteri, la dimensione, il colore, l'indentazione e il posizionamento. Se si desidera marcare le schermate o visualizzare le informazioni richieste su un grafico, UPD1 Watermark sarà uno strumento molto utile. Descrizione delle impostazioni. Impostazioni
FREE
UPD1 Rsi Dots Dashboard
Vitaliy Kuznetsov
5 (1)
L'indicatore mostra segnali basati sull'oscillatore RSI terminale sul grafico. È possibile filtrare i segnali ripetuti. Qui l'oscillatore viene utilizzato per cercare un segnale inverso. È raccomandato come punto di ingresso nelle strategie swing e nel trading dai livelli. È disponibile una dashboard multi-valuta. Con esso, puoi facilmente passare da un grafico all'altro. Nelle discussioni sui prodotti, è possibile suggerire un algoritmo in cui è possibile incorporare un dashboard. Parame
FREE
Lo scopo di questo indicatore è trovare i livelli di Murray su tutti i timeframe e combinarli in livelli combo che includono livelli di segnale basati su forti livelli di Murray (+2, +1, 8, 4, 0, -1, -2). Più piccolo è il timeframe, maggiori sono le possibilità di vedere immediatamente il livello combo. Sarà evidenziato in colore. Se si posiziona il cursore su un numero qualsiasi, apparirà un tooltip che indicherà a quale timeframe appartiene il livello. Tuttavia, il timeframe corrente sarà semp
UPD1 Impulse Channel
Vitaliy Kuznetsov
5 (8)
Un canale non disegnato per il trading di tendenza. È costruito dall'ATR e ha un limite di volatilità opposto. L'indicatore si è dimostrato valido nella strategia sui livelli di impulso e sui falsi breakout. Il punto di ingresso va cercato sulla correzione della linea dell'indicatore e il take profit va fissato sul confine opposto. Blog-Link -   Retest and Fake Breakout with UPD1 . Parametri di ingresso. Bars Count   - cronologia da visualizzare. ATR   - periodo di calcolo. Coefficient   -
FREE
UPD1 X00 Levels MT5
Vitaliy Kuznetsov
5 (1)
L'indicatore mostra livelli circolari sul grafico. Sono anche chiamati livelli psicologici, bancari o dei principali operatori. A questi livelli si verifica una vera e propria lotta tra tori e orsi, l'accumulo di molti ordini, che porta a un aumento della volatilità. L'indicatore si adatta automaticamente a qualsiasi strumento e timeframe. Se il livello 80 viene rotto e poi testato, acquistare. Se il livello 20 viene rotto e poi testato, vendere. L'obiettivo è 00. Attenzione. A causa dei forti
FREE
L'Average True Range ( ATR ) è una misura della volatilità del mercato in un determinato numero di giorni. Non ci si deve aspettare un grande movimento di continuazione quando il prezzo ha raggiunto la fine del range. Si ritiene che il mercato abbia esaurito il carburante. Se il prezzo non ha raggiunto il limite, ha ancora un margine di movimento. La formula dell'indicatore consente di calcolare i livelli High-Low sia in aggregato che singolarmente. È inoltre possibile utilizzare questi livelli
FREE
UPD1 Murrey Math Levels
Vitaliy Kuznetsov
5 (7)
I livelli matematici di Murray si basano sulle osservazioni di Gann e sulla sua teoria della quadraticità dei prezzi. Secondo Gunn, il prezzo si muove in intervalli di 1/8. Questi 1/8 ci permettono di ottenere diversi livelli di resistenza e supporto per un dato grafico, che hanno le loro caratteristiche. Quando i livelli -2 o +2 vengono rotti o quando la volatilità diminuisce, vengono ricostruiti. È possibile scegliere il periodo da visualizzare (corrente o tutta la storia). Tutte le linee son
FREE
UPD1 X00 Levels
Vitaliy Kuznetsov
4.92 (12)
L'indicatore mostra livelli circolari sul grafico. Sono anche chiamati livelli psicologici, bancari o dei principali operatori. A questi livelli si verifica una vera e propria lotta tra tori e orsi, l'accumulo di molti ordini, che porta a un aumento della volatilità. L'indicatore si adatta automaticamente a qualsiasi strumento e timeframe. Se il livello 80 viene rotto e poi testato, acquistare. Se il livello 20 viene rotto e poi testato, vendere. L'obiettivo è 00. Attenzione. A causa dei forti
FREE
UPD1 Volume Pixel
Vitaliy Kuznetsov
5 (3)
L'indicatore Trova il volume basso, alto, estremo in base ai coefficienti specificati e li colora nei colori specificati. Sostituisce la funzione di disegno del volume standard nel terminale metatrader. Le candele possono anche essere dipinte nel colore del volume. Sulle candele con volume estremo, viene determinato il volume orizzontale massimo (cluster/POC). A seconda della sua posizione (spinta, neutro, arresto), il cluster ha anche il suo colore. Se il cluster è in ombra e la candela ha un
UPD1 D Levels
Vitaliy Kuznetsov
5 (1)
L'indicatore dei livelli si basa sui dati del giorno precedente. La formula matematica determina i livelli di entrata e di uscita.  Raccomandazioni di trading. I livelli vengono negoziati all'inizio della sessione europea, quando appare la volatilità. In caso di volatilità insufficiente, utilizzare metà del take profit per uscire. Se il prezzo si è invertito a metà del take profit, allora sull'inversione cercate un target anche al livello di metà del take profit. Se il prezzo rimbalza dal liv
FREE
L'indicatore cerca le candele a impulso e le visualizza sul grafico. Include un filtro per le ombre. Trova anche i livelli di breakout delle Bande di Bollinger. È possibile attivare il cruscotto multivaluta nelle impostazioni. Per gli avvisi si può scegliere tra il grafico corrente o l'intero elenco. Blog-Link -  Retest and Fake Breakout with UPD1 Modelli di trading: Trend retest. Falso breakout. Altri. EURUSD, GBPUSD, XAUUSD, ... M15, M30, H1. Parametri di ingresso. Di base. Bars Count
UPD1 Fibo Levels
Vitaliy Kuznetsov
5 (3)
L'indicatore analizza il numero di candele specificato e costruisce i livelli di Fibonacci in base al massimo e al minimo. Poiché i livelli vengono ricostruiti, siamo interessati al lato destro dell'intervallo. Il prezzo è magnetico rispetto ai livelli e reagisce a un tocco. Utilizzate questo strumento per trovare un punto di ingresso nel trend dopo una correzione. Se a sinistra vediamo che i livelli sono perfettamente al rialzo, allora possiamo presumere di aver trovato la fine del movimento ne
FREE
Lo scopo di questo indicatore è trovare i livelli di Murray su tutti i timeframe e combinarli in livelli combo che includono livelli di segnale basati su forti livelli di Murray (+2, +1, 8, 4, 0, -1, -2). Più piccolo è il timeframe, maggiori sono le possibilità di vedere immediatamente il livello combo. Sarà evidenziato in colore. Se si posiziona il cursore su un numero qualsiasi, apparirà un tooltip che indicherà a quale timeframe appartiene il livello. Tuttavia, il timeframe corrente sarà semp
UPD1 Pivot Levels
Vitaliy Kuznetsov
5 (3)
L'indicatore mostra i classici livelli di pivot sul grafico, calcolati sulla base del giorno precedente. È possibile scegliere da quale ora calcolare la formula. Scambiate in un mercato piatto per l'inversione. In un mercato in trend, utilizzateli come target. Combinateli con le vostre strategie per un trading di successo. I livelli vengono costruiti utilizzando i buffer e visualizzati sull'intero storico delle quotazioni disponibili. Parametri di input. Start Hour - da quale ora considerar
FREE
L'indicatore costruisce un semaforo a tre periodi e un pattern di inversione 123 dall'estremo. Il segnale arriva all'apertura della seconda candela. Questo pattern può essere negoziato in diversi modi (test point 3, breakout e altri). L'uscita dal canale o il breakout della trendline è il principale fattore scatenante per trovare un punto di ingresso. Le icone sono colorate in base ai livelli di Fibonacci. Le icone gialle indicano il test di un livello al quale il segnale è amplificato. Utilizz
L'indicatore Cerca e visualizza automaticamente grandi ombre sul grafico in base alla volatilità. Le ombre sono ulteriormente filtrate dalla dimensione dell'onda. L'algoritmo analizza la rottura del frattale con un'ombra nell'intervallo specificato e visualizza il livello. Nelle impostazioni, è possibile abilitare il dashboard multi-valuta. L'avviso viene scelto tra il grafico corrente o l'intero foglio del dashboard. Segnali a grandi ombre e quelli che hanno sfondato il livello frattale posson
L'indicatore visualizza il modello "Rails" sul grafico. Questo schema consiste in due candele multidirezionali con corpi identici e piccole ombre. Se sul timeframe corrente il pattern "Rails", sul timeframe x2 apparirà come una Pin Bar (Doji). Questo indicatore è stato creato per trovare automaticamente il pattern nel modo più efficiente, con impostazioni logicamente semplici che possono essere facilmente modificate. È possibile filtrare in base alla tendenza (2 medie mobili) e all'inversione (
Un indicatore che visualizza il pattern candela inghiottendo. Nelle impostazioni, è possibile specificare il tipo di engulfing (corpo, ombra e combinazione). È possibile filtrare per tendenza (2 medie mobili) e per inversione (RSI e Bande di Bollinger). Questo è un modello di azione dei prezzi molto popolare. È disponibile una dashboard multi-valuta. Con esso, puoi facilmente passare da un grafico all'altro. Modelli di trading: Ripetere il test per tendenza. Falso breakout. Blocco ordine. Alt
L'indicatore mostra un segnale sul grafico quando la seconda candela è all'interno della prima, cioè non ha superato i suoi limiti. Questo modello di candela è chiamato Inner Bar. Questo schema non è così popolare come la Pin Bar o il Engulfing, ma viene talvolta utilizzato da alcuni trader. Esiste la possibilità di filtrare per tendenza (2 medie mobili) e per inversione (RSI e Bande di Bollinger). È disponibile un pannello multivaluta. Con il suo aiuto è possibile passare facilmente da un graf
Filtro:
Karlfx4
21
Karlfx4 2023.11.04 10:04 
 

The indicator is exactly what I was looking for it shows hidden distribution and accumulation on a chart, Going see how it performs in real time

Vitaliy Kuznetsov
29673
Risposta dello sviluppatore Vitaliy Kuznetsov 2023.11.04 10:51
Thank you for the high rating
Eric Raygoza
133
Eric Raygoza 2023.10.01 09:27 
 

I think this is a very good indicator, have just started using it, Thank you Vitaly.

Vitaliy Kuznetsov
29673
Risposta dello sviluppatore Vitaliy Kuznetsov 2023.10.01 09:35
Thank you for the high rating
topline8000
1144
topline8000 2023.08.13 10:54 
 

it's ok good

Vitaliy Kuznetsov
29673
Risposta dello sviluppatore Vitaliy Kuznetsov 2023.08.13 13:37
Ok
Suvashish Halder
12710
Suvashish Halder 2023.08.13 05:33 
 

It would be great if you can add 2 Buttons for the Chart. One Button show/hides Cluster Line and another Increase or Decrease Bars(input way) to Scan.

Vitaliy Kuznetsov
29673
Risposta dello sviluppatore Vitaliy Kuznetsov 2023.08.13 09:29
Thanks for the feedback, I'll think about it.
paddock
305
paddock 2023.05.22 12:05 
 

excellent, easy to follow but I agree with Martian Brown. Then it would be 10 stars :)

Vitaliy Kuznetsov
29673
Risposta dello sviluppatore Vitaliy Kuznetsov 2023.05.22 12:17
Thank you for the high rating. I 'll think about a new alert
yalewang
1120
yalewang 2023.05.03 11:31 
 

i can not understand

Vitaliy Kuznetsov
29673
Risposta dello sviluppatore Vitaliy Kuznetsov 2023.05.03 11:50
It's a pity that you made an assessment of the volume cluster indicator only because you didn't understand it
Edgar Dario Ortigoza Vera
458
Edgar Dario Ortigoza Vera 2023.03.27 00:20 
 

Funciona perfecto, buen trabajo

Vitaliy Kuznetsov
29673
Risposta dello sviluppatore Vitaliy Kuznetsov 2023.03.27 08:29
Gracias por la retroalimentación
emir2018
333
emir2018 2023.03.21 10:05 
 

super

Vitaliy Kuznetsov
29673
Risposta dello sviluppatore Vitaliy Kuznetsov 2023.03.21 10:24
Thanks
Martin Brown
711
Martin Brown 2023.01.26 11:51 
 

There should be an option to receive an alert when the "flat" bar first appears and is gray. But this indicator is still without a doubt marvelous.

Vitaliy Kuznetsov
29673
Risposta dello sviluppatore Vitaliy Kuznetsov 2023.01.26 13:00
Thanks for the rating
Saishala
67
Saishala 2023.01.13 22:23 
 

I just want to say Thanks for this Amazing indicator Mr Vitaliy Kuznetsov. And i really think this indicator have high possibilities to become a future "Classic" between Volume Traders. Just looking to all the indicators you have programed Is easy to see the how "Gifted" coder/programmer you are and the good they are, Everything is smart and useful and zero fluffiness . You have the Spark!

Vitaliy Kuznetsov
29673
Risposta dello sviluppatore Vitaliy Kuznetsov 2023.01.14 10:01
Thank you for these wonderful words!
Alan Kantor
45
Alan Kantor 2023.01.02 22:10 
 

Incredibly, ten indicators are free! Trade ATS sells it for $250 a month

Vitaliy Kuznetsov
29673
Risposta dello sviluppatore Vitaliy Kuznetsov 2023.01.03 08:04
Thank you for the high rating!
jiab
436
jiab 2022.12.26 04:58 
 

wow..!! goodjob

Vitaliy Kuznetsov
29673
Risposta dello sviluppatore Vitaliy Kuznetsov 2022.12.26 07:14
Thanks
RvdHo
185
RvdHo 2022.12.09 02:27 
 

This is such a useful indicator, a must for any volume based trading system. Very surprised to see it is free. Thank you Vitaliy!

Vitaliy Kuznetsov
29673
Risposta dello sviluppatore Vitaliy Kuznetsov 2022.12.09 05:33
Thanks for the feedback. I'm just used to finding visually flat places and putting a Volume Box there. That's more accurate. But to understand the strategy, I decided to make such an indicator free.
Rispondi alla recensione
Versione 3.30 2024.01.06
added a new type of alert when a gray cluster appears (start flat)
expanded Data Source settings
added Current (timeframe) to Data Source by default.
minor bugs fixed
compiled a new build 1400
Versione 3.17 2023.09.05
New build