Heikin Ashi Volume Weighted for MT4
- Indicatori
- Fernando Carreiro
- Versione: 1.3
- Aggiornato: 1 ottobre 2023
- Attivazioni: 20
(Traduzione automatica)
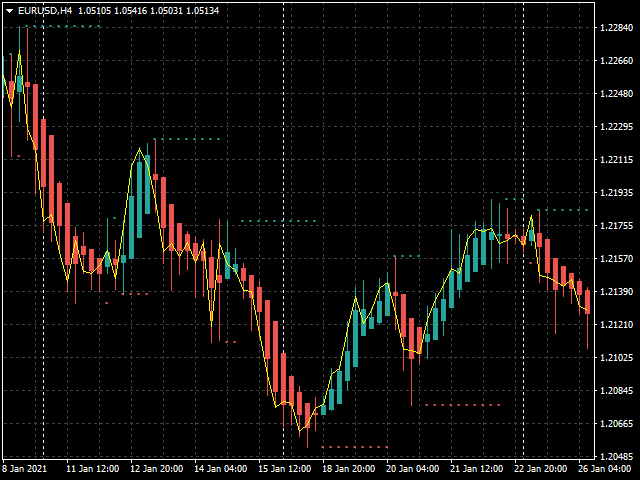
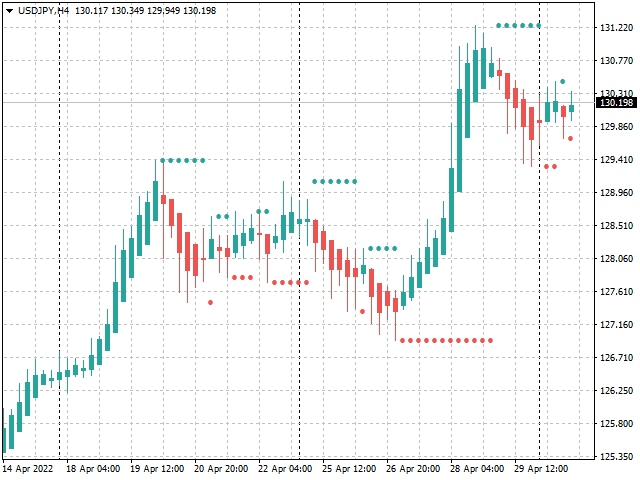
La maggior parte dei trader conosce il famoso indicatore giapponese Heikin-Ashi , creato nel 1700 da Munehisa Homma . A volte viene scritto Heiken-Ashi , ma il suo significato rimane lo stesso, ovvero “barra media” in giapponese.
Questa è un'implementazione del noto indicatore Heikin Ashi , ma con alcune funzionalità aggiunte.
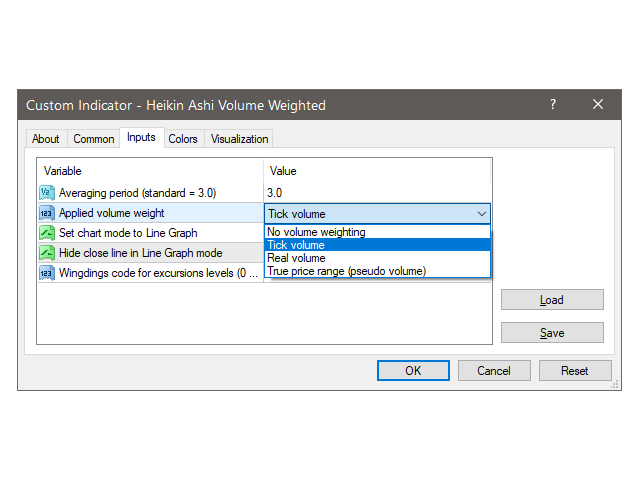
Per prima cosa, consente che i suoi valori siano ponderati in base al volume , sia esso il volume del conteggio dei tick , il volume reale o lo pseudo-volume in base all'intervallo reale. Il vantaggio principale è ridurre il numero di false inversioni, soprattutto durante i periodi di basso volume. Aiuta anche a rallentare la scia degli alti e dei bassi.
Come opzione, consente l'utilizzo di pseudo-volumi basati sull'escursione reale della barra. Ciò è utile per i simboli che non hanno a disposizione né il volume reale né i dati sul volume del conteggio dei tick.
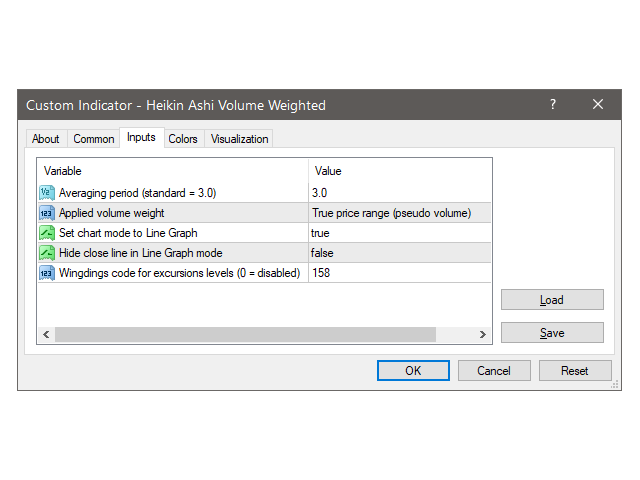
Come caratteristica aggiuntiva, questo indicatore mostra anche i livelli di escursione massima, che possono essere utilizzati per le soste.
Pochi trader comprendono le basi del suo calcolo, ma l' Heikin Ashi si basa infatti su una media mobile esponenziale. Questa implementazione consente inoltre di adeguare il periodo, invece di avere un periodo fisso predefinito come nell'originale.
Per impostazione predefinita, imposterà il grafico sottostante su Grafico a linee . Ciò aiuta a ridurre l'ingombro del display, pur mostrando i prezzi di chiusura originali. Puoi, tuttavia, modificare il comportamento nei suoi parametri.
Tieni presente che questo indicatore è disponibile per entrambe le piattaforme MetaTrader 5 e MetaTrader 4.