Ticks Stochastic
- Indicatori
- Andrej Nikitin
- Versione: 1.12
- Aggiornato: 18 novembre 2021
- Attivazioni: 5
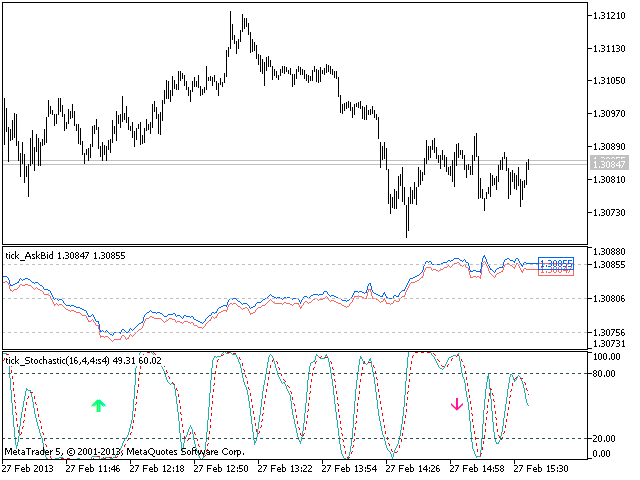
The Stochastic Oscillator indicator is drawn on the tick price chart.
After launching it, wait for enough ticks to come.
Parameters:- K period - number of single periods used for calculation of the stochastic oscillator;
- D period - number of single periods used for calculation of the %K Moving Average line;
- Slowing - period of slowing %K;
- Calculated bar - number of bars in the chart for calculation of the indicator.
The following parameters are intended for adjusting the weight of signals of the Stochastic oscillator (0 - 100). Their description can be found in MQL5 Reference in the section Signals of the Oscillator Stochastic.
- The oscillator has required direction.
- Reverse of the oscillator to required direction.
- Crossing of main and signal line.
- Divergence of the oscillator and price.
- Double divergence of the oscillator and price.
Buffer indexes: 0 - MACD_LINE, 1 - SIGNALLINE, 2 - SIGNAL_UP, 3 - SIGNAL_DOWN.