Ticks Bands
- Indicatori
- Andrej Nikitin
- Versione: 1.12
- Aggiornato: 18 novembre 2021
- Attivazioni: 5
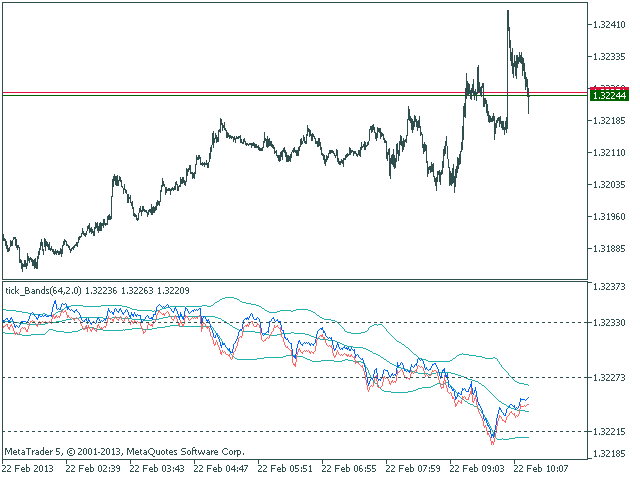
The Bollinger Bands indicator drawn using a tick chart.
After launching it, wait for enough ticks to come.
Parameters:
- Period - period of averaging.
- Deviation - deviation from the main line.
- Price levels count - number of displayed price levels (no levels are displayed if set to 0).
- Bar under calculation - number of bars on the chart for the indicator calculation.
Buffer indexes: 0 - BASE_LINE, 1 - UPPER_BAND, 2 - LOWER_BAND, 3 - BID, 4 - ASK.