UDWay
- Indicatori
- Xiong Luo
- Versione: 3.1
- Attivazioni: 10
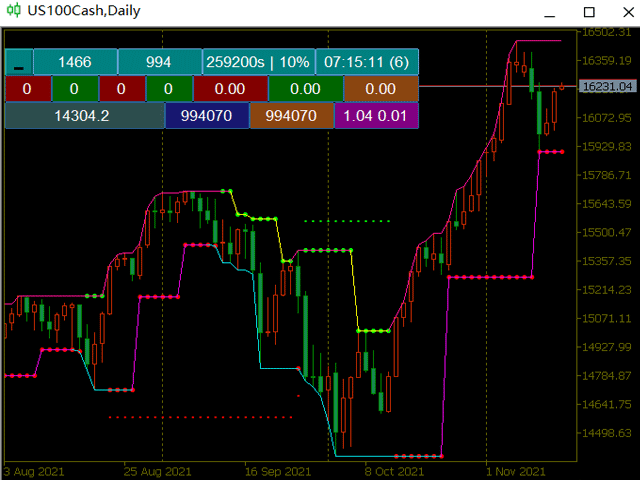
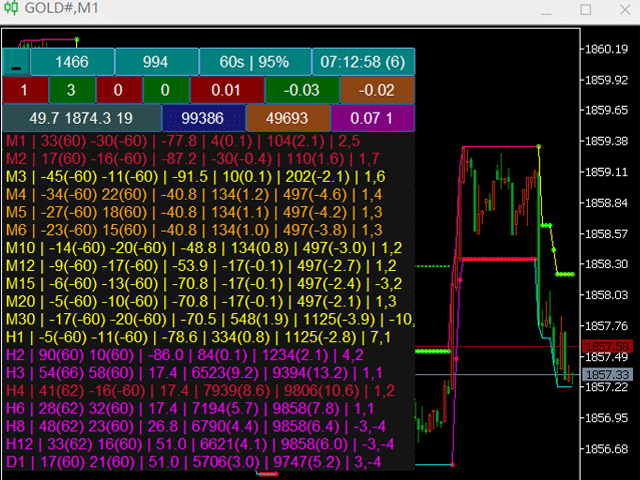
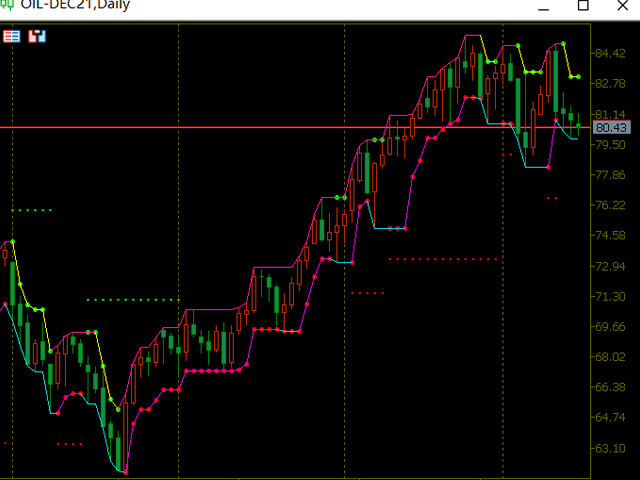
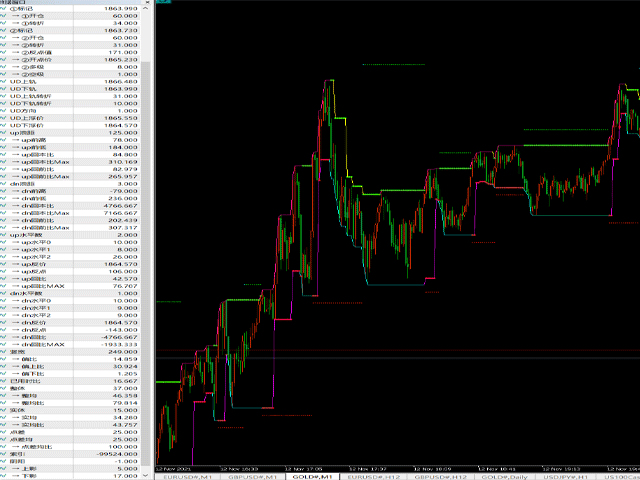
K线极点轨道UD
【input 参数】
InpMyMagic: 幻数
InpShowPanel: 是否展示面板
InpOneLot: 开单量1份[最大99.99](=0最小手,>0固定手,<0>=-1净亏比,<-1净余最小亏比)
InpAllLot: 总净单量,100%(=0最小手,>0固定手,<0>=-1净亏比,<-1净余最小亏比)
InpLotMaxMoney: 开单量计算的最大金额(=0不管,>0超过该值即限制为该值,<0超过整数值即限制为小数倍数)
InpLot1Dot1Money: 开单1手变化1点时金额变化值。(<=0自动计算(美元),>0指定)
InpDotBig: 大间隔点值(>=0点值,<1三位数点差均,<0整均比)
InpDotSml: 小间隔点值(>=0点值,<1三位数点差均,<0整均比)
========== UD ==========
InpUDType: 类型(=0不开,=1常规,=4偏极,=6平台,=8慢跟,=10超前,=12跟随)
InpMinWidth: 上下轨宽度最小值(>=0点值,<1三位数点差均,<0整均比)
InpHTurnThr: 平台时(6)水平转折阀值
InpOffPerMaxThr: 偏极时(4)可改轨偏极比值
========== 综合 ==========
InpDirMainOp1: 主趋势操盘线1(0不设,1近零,2近轨比)
InpDirMainOp2: 主趋操盘线2(=0不设,>0偏极比,<1三位数点差均,<0整均比)
InpDMOp2SLC: 主趋操盘线2止损初价数(0~3,推荐1)
InpJGPerThr: 近轨比时所用偏极比阀值
InpJGPerBack: 近轨比时偏极比回撤脱控值
InpIsUseMoreTF: 是否使用多周期
========== 裸K ==========
InpZtMa: 整体均值
InpStMa: 实体均值
InpDcMa: 点差均值
========== EA ==========
InpIndPeriodS: 多周期组合选择(0全,1少246,2再少,3继少,8M1H1,9仅M1)
InpIsCreatInd: 是否程序创建指标
InpMinTestMoney: 净值低于该值停止测试
InpMaxTestTime: 最大测试时间(秒)
InpIndStartK: 起始周期索引(0~max-1)
InpIndEndK: 结束周期索引(0~max-1)
InpEAType: EA类型
【panel 面板】
当参数“InpShowPanel”设置为“true”时开启面板
row1: 余额 净值 单K秒数 | 已用时比 服务器时间
row2: 多单 空单 多盈利单 空盈利单 多仓量 空仓量 净仓量
row3: 当前周期整均 最大周期整均 多周期数 最小仓量时可亏损点值 当前仓量可亏损点值 指定风险比内最大净仓量 1手变化1点时对应美元金额
row4~max: 开启多周期有效
周期 | 信号2转折(信号2指示) 信号1转折(信号1指示) | 偏比 | ②开点价点值(整均比) | ②反点值(整均比) | ②多级,②空级
【buffers and plots】
op1Buffer(①标记): 1号信号
op1Color: 1号信号颜色
op1OpenFlag(①开仓): 1号信号多空指示
op1OFTurn(①转折): 1号信号多空转向值
op2Buffer(②标记): 2号信号 也作为止损价格
op2Color: 2号信号颜色
op2OpenFlag(②开仓): 2号信号多空指示
op2OFTurn(②转折): 2号信号多空转向值
op2AuxSLDot(②反点值): 2号信号止损基准点值
op2AuxOpenPrice(②开点价):2号信号触发时的价格
op2AuxBLevel(②多级): 2号信号连续看多时的级数
op2AuxSLevel(②空级): 2号信号连续看空时的级数
upBuffer(UD上轨): 上轨道价格
downBuffer(UD下轨): 下轨道价格
upColor: 上轨道颜色
downColor: 下轨道颜色
upTurn(UD上轨转折): 上轨道多空转向值
downTurn(UD下轨转折): 下轨道多空转向值
udDir(UD方向): 多空方向
upFloatPrice(UD上浮价):上轨道阻力价格
downFloatPrice(UD下浮价):下轨道支撑价格
upWaveDot(up浪距): 上轨连续向上整浪的点值
upHighDiff(up前高): 上轨本浪高点与前浪高点的差值
upLowDiff(up前低): 上轨本浪低点与前浪低点的差值
upBackPerCurr(up回本比):上轨本浪中当前回调百分比
upBackPerCurrMax(up回本比Max): 上轨本浪中最大回调百分比
upBackPerLast(up回前比): 上轨与前浪当前回调百分比
upBackPerLastMax(up回前比Max): 上轨与前浪最大回调百分比
downWaveDot(dn浪距): 下轨连续向上整浪的点值
downHighDiff(dn前高): 下轨本浪高点与前浪高点的差值
downLowDiff(dn前低): 下轨本浪低点与前浪低点的差值
downBackPerCurr(dn回本比):下轨本浪中当前回调百分比
downBackPerCurrMax(dn回本比Max):下轨本浪中最大回调百分比
downBackPerLast(dn回前比):下轨与前浪当前回调百分比
downBackPerLastMax(dn回前比Max):下轨与前浪最大回调百分比
upHCount(up水平数): 上轨同向时平台数
upHorizontal0(up水平0):上轨同向时平台数
upHorizontal1(up水平1):上轨纯单个水平K数
upHorizontal2(up水平2):上轨纯全水平K数
upReverse(up反价): 上轨支撑阻力价格
upRevDot(up反点): 上轨本平台回调点值
upBackPer(up回比): 上轨本平台回调百分比
upBackPerMax(up回比MAX):上轨本平台最大回调百分比
downHCount(dn水平数): 下轨同向时平台数
downHorizontal0(dn水平0):下轨同向时平台数
downHorizontal1(dn水平1):下轨纯单个水平K数
downHorizontal2(dn水平2):下轨纯全水平K数
downReverse(dn反价): 下轨支撑阻力价格
downRevDot(dn反点): 下轨本平台回调点值
downBackPer(dn回比): 下轨本平台回调百分比
downBackPerMax(dn回比MAX):下轨本平台最大回调百分比
udVWidth(竖宽): 上下轨之间的点差
udOffPer(偏比): 当前价格在当前宽度中点偏向百分比
udOffPerMax(偏上比): 最高价格在前个宽度中点偏向百分比
udOffPerMin(偏下比): 最低价格在前个宽度中点偏向百分比
useTimePer(已用时比): 本K柱已消耗时间百分比
ztAllBuffer: 用于保存所有整体
ztDotBuffer(整体): K柱高低价间的点差值
ztMaBuffer(整均): 指定柱数内平均整体点差值
ztMaPer(整均比): 当前K柱整体与均值之比
stAllBuffer: 用于保存所有实体
stDotBuffer(实体): K柱开收价间的点差值
stMaBuffer(实均): 指定柱数内平均实体点差值
stMaPer(实均比): 当前K柱实体与均值之比
dcAllBuffer: 用于保存所有点差
dcBuffer(点差): K柱买卖价间的点差值
dcMaBuffer(点差均): 指定柱数内平均点差点差值
dcMaPer(点差均比): 当前K柱点差与均值之比
iBuffer(索引): 所有加载K柱中当前K柱所属索引
yyBuffer(阴阳): 当前K柱是阴线还是阳线
syDotBuffer(上影): 当前K柱上影线点值
xyDotBuffer(下影): 当前K柱下影线点值