• Panoramica
  • Recensioni
  • Commenti

Segmented Volume MT5

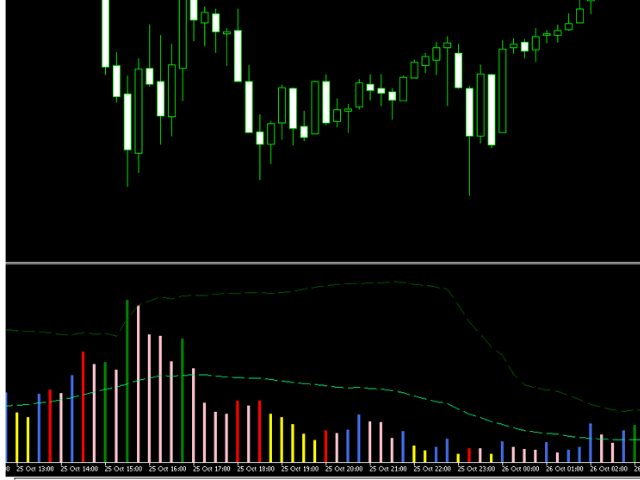
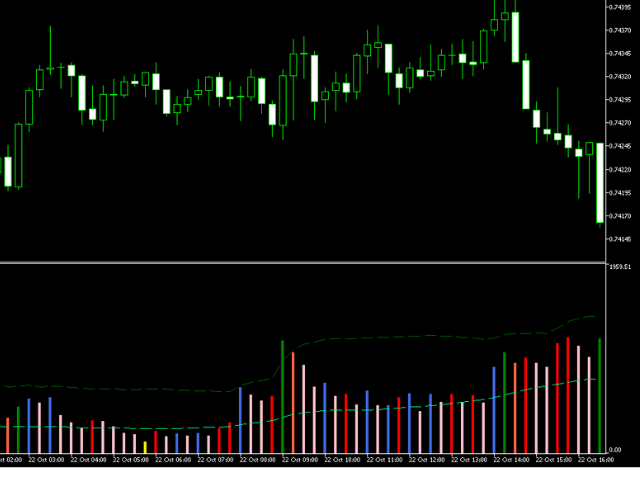
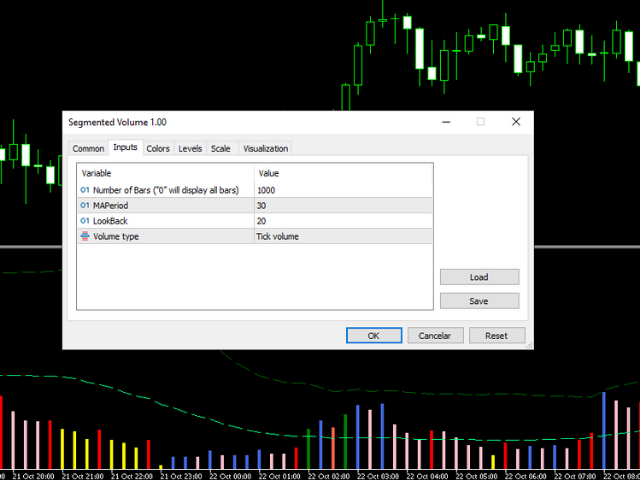
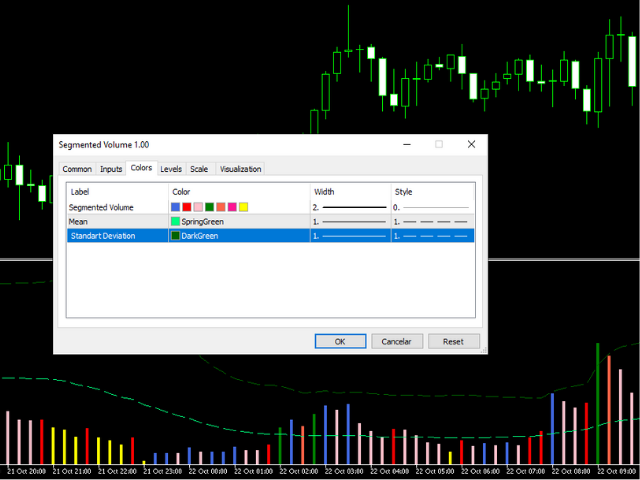
L'indicatore MT5 Segmented Volume è stato creato per facilitare coloro che fanno trading utilizzando l'analisi dei prezzi e dei volumi, VSA, VPA, metodo Wyckoff e Smart Money System. Il volume segmentato funziona su qualsiasi mercato (Crypto, CFD, Forex, Futures, Azioni...) e funziona in qualsiasi momento del grafico. Guarda quanto è facile la tua interpretazione: #Green: Volume molto più alto della media del mercato #Rosa scuro: volume più grande della media #Blu: volume normale positivo #Rosso: volume normale negativo #Rosa: volume basso #Giallo: volume ultra basso L'indicatore di volume segmentato MT5 può essere utilizzato in volume tick o volume reale. Aiuta a leggere il movimento del denaro intelligente facilitando il processo decisionale.


Prodotti consigliati
Wapv Price and volume
Eduardo Da Costa Custodio Santos
L'indicatore di prezzo e volume WAPV per MT5 fa parte del set di strumenti (Wyckoff Academy Wave Market) e (Wyckoff Academy Price and Volume). L'indicatore di prezzo e volume WAPV per MT5 è stato creato per semplificare la visualizzazione del movimento del volume sul grafico in modo intuitivo. Con esso puoi osservare i momenti di picco del volume e i momenti in cui il mercato non ha interesse professionale Identifica i momenti in cui il mercato si muove per inerzia e non per movimento di "denaro
Weis Waves
Flavio Javier Jarabeck
3.15 (26)
The original author is David Weis, an expert in the Wyckoff Method. The Weis Wave is a modern adaptation of the 1930's Wyckoff Method, another expert in Tape Reading techniques and Chart Analysis. Weis Waves takes market volume and stacks it into waves according to price conditions giving the trader valuable insights about the market conditions. If you want to learn more about this subject you can find tons of videos in YouTube. Just look for "The Wickoff Method", "Weis Wave" and "Volume Spread
FREE
Value Chart Candlesticks
Flavio Javier Jarabeck
4.67 (9)
The idea of a Value Chart indicator was presented in the very good book I read back in 2020 , " Dynamic Trading Indicators: Winning with Value Charts and Price Action Profile ", from the authors Mark Helweg and David Stendahl. The idea is simple and the result is pure genius: Present candlestick Price analysis in a detrended way! HOW TO READ THIS INDICATOR Look for Overbought and Oversold levels. Of course, you will need to test the settings a lot to find the "correct" one for your approach.
FREE
Mini Chart Indicators
Flavio Javier Jarabeck
The Metatrader 5 has a hidden jewel called Chart Object, mostly unknown to the common users and hidden in a sub-menu within the platform. Called Mini Chart, this object is a miniature instance of a big/normal chart that could be added/attached to any normal chart, this way the Mini Chart will be bound to the main Chart in a very minimalist way saving a precious amount of real state on your screen. If you don't know the Mini Chart, give it a try - see the video and screenshots below. This is a gr
Balance Aggression
Edson Cavalca Junior
The indicator measures the balance of aggression. The formula is as follows:   Aggression  = Purchase Volume - Sales Volume. Note : It is rec ommended to use the default configuration and VPS values. It does not work in Forex. Meet Our Products     Parameters : Numbers of days prior to the current one for calculation; Volume Divider e; Enables calculation of the current candle; Histogram Line style and; Size; Line Line style and; Size;  Follow us on our website to check the next new
Donchian Pro
Paulo Henrique Faquineli Garcia
5 (2)
The Donchian Channel Channels are among the most popular tools of technical analysis, as they visually convey to the analyst the limits within which most price movement tends to occur. Channel users know that valuable information can be obtained at any time, whether prices are in the central region of a band or close to one of the border lines. One of the best known techniques to explore these concepts is Bollinger Bands. However, John Bollinger was not the only one to research the applicatio
FREE
WAPV Box Effort x Result
Eduardo Da Costa Custodio Santos
RISULTATO WA_PV_BOX_EFFORT X per MT5 Il WAPV Box Effort x Result Indicator fa parte del gruppo Package Indicators (Wyckoff Academy Wave Market). L'indicatore WAPV Box Effort x Result Indicator per MT5 ti aiuta a leggere il prezzo e il volume. La sua lettura consiste nell'assistere nell'identificazione dello sforzo x risultato in onde create dal grafico. L'indicatore WAPV Box Effort x Result Indicator per MT5 quando la casella è verde significa che il volume è a favore della domanda e quando la c
Volumes Direction MT5
William Oswaldo Mayorga Urduy
DIREZIONE VOLUMI MT5 Normalmente l'indicatore del volume ha un cambio di colore predefinito quando il volume corrente è più alto del precedente, è importante ma non molto utile. Per questo motivo è stato creato questo indicatore che oltre al volume normale, quando la candela è rialzista o ribassista, le dipinge di un colore diverso, di default è blu per rialzista e rosso per ribassista, ma questi colori possono essere personalizzati al Il gusto del commerciante. Non dimenticare di con
Follow The Line MT5
Oliver Gideon Amofa Appiah
4.42 (31)
This indicator obeys the popular maxim that: "THE TREND IS YOUR FRIEND" It paints a GREEN line for BUY and also paints a RED line for SELL. (you can change the colors). It gives alarms and alerts of all kinds. IT DOES NOT REPAINT and can be used for all currency pairs and timeframes. Yes, as easy and simple as that. Even a newbie can use it to make great and reliable trades. NB: For best results, get my other premium indicators for more powerful and reliable signals. Get them here: https://www.m
FREE
HLC bar MT5 Wyckoff
Eduardo Da Costa Custodio Santos
L'indicatore "HLC_bar_MT5 Wyckoff" per MT5 è stato creato per facilitare l'analisi al momento del trading. La barra HLC è stata utilizzata da Richard Wyckoff ed è attualmente ampiamente utilizzata nelle operazioni "VSA". Wyckoff ha scoperto che l'utilizzo di High, Low e Close ha reso il grafico molto più pulito e più facile da analizzare. L'indicatore "HLC_bar_MT5 Wyckoff" consente: # Cambia la larghezza della barra; # Lascia la barra dello stesso colore; # Ed evidenzia la barra che si è aperta
Key level wedge MT5
Presley Annais Tatenda Meck
The   Key level wedge MT5   indicator automatically draws rising wedge pattern and falling wedge pattern for you on the chart. This pattern is really good when used as a confirmation entry at key support & resistance, supply & demand and reversal zones. Advantages  The   Key level wedge MT5   block DOES NOT RE-PAINT, giving you confidence when a signal appears and also helps when looking back.  The   Key level wedge MT5   includes an on/off button on the chart to easily keep the charts cle
The best time to trade Using this Indicator is when the time reach exactly hour,half,45 minutes,15 minutes and sometimes 5 minutes.. This indicators is helpful to those who trade boom and crash indecies.How to read this indicator first you'll see Blue allow and Red allow all these allows used to indicate or to detect the spike which will happen so the allow happens soon before the spike happen.This indicator works properly only in boom and crash trading thing which you have to consider when
The Accumulation / Distribution is an indicator which was essentially designed to measure underlying supply and demand. It accomplishes this by trying to determine whether traders are actually accumulating (buying) or distributing (selling). This indicator should be more accurate than other default MT5 AD indicator for measuring buy/sell pressure by volume, identifying trend change through divergence and calculating Accumulation/Distribution (A/D) level. Application: - Buy/sell pressure: above
Bear Bull
Ignacio Agustin Mene Franco
Bear Bull! It is an indicator that marks with Heikin Ashi candles but modified, the sales and purchases long and short trend! with 2 colors green marks the purchase, purple marks the sale, works for any type of temporality, works for forex markets and synthetic indices! ideal for any pair, it also works for crypto pairs, Good profit! World Investor - World Inversor - 
ZigZag with Fibonacci
Rafael Caetano Pinto
This indicator uses the metaquotes ZigZag indicator as base to plot fibonacci extension and fibonacci retracement based in the Elliot waves. A fibonacci retracement will be plotted on every wave draw by the ZigZag. A fibonacci extension will be plotted only after the 2nd wave. Both fibonacci will be updated over the same wave tendency. Supporting until 9 consecutive elliot waves. Parameters: Depth: How much the algorithm will iterate to find the lowest and highest candles Deviation: Amoun
Weis Wave Result MT5
Sant Clear Ali Costa
Features 3 types of waves: bullish, bearish and unknown. The unknown tower comes when prices move in opposite the direction of the current tower. Label that shows the percentage remaining for the next tower. Allows you set the type of volume that will be accumulated in the towers, either real or tick volumes. Thus, the indicator works in any market, for example: stocks, futures, forex, commodities, etc. Allows you to set the required score for the tower exchange. Allows you to set the font size
Do you use volume in your reading of the market? Certainly many traders use it, and do not imagine operating without it. The Color Histogram Volume Set indicator allows the user to choose the value that he considers interesting to monitor. When you pass this you will have visual confirmation and if you want you will also have the audible alert that is given by the indicator. Of course, there are other ways to try to find a high volume, such as assessing whether the volume
Aggression Volume
Flavio Javier Jarabeck
3.8 (20)
Aggression Volume Indicator is the kind of indicator that is rarely found in the MQL5 community because it is not based on the standard Volume data provided by the Metatrader 5 platform. It requires the scrutiny of all traffic Ticks requested on the platform... That said, Aggression Volume indicator requests all Tick Data from your Broker and processes it to build a very special version of a Volume Indicator, where Buyers and Sellers aggressions are plotted in a form of Histogram. Additionally,
FREE
Order Book, known also as Market Book, market depth, Level 2, - is a dynamically updated table with current volumes of orders to buy and to sell specific financial instument at price levels near Bid and Ask. MetaTrader 5 provides the means for receiving market book from your broker, but in real time only, without access to its history. The indicator OrderBook Cumulative Indicator accumulates market book data online and visualizes them on the chart. In addition, the indicator can show the market
MIDAS Super VWAP
Flavio Javier Jarabeck
4.29 (14)
Imagine VWAP, MVWAP and MIDAS in one place... Well, you found it! Now you can track the movement of Big Players in various ways, as they in general pursue the benchmarks related to this measuring, gauging if they had good execution or poor execution on their orders. Traders and analysts use the VWAP to eliminate the noise that occurs throughout the day, so they can measure what prices buyers and sellers are really trading. VWAP gives traders insight into how a stock trades for that day and deter
FREE
Tabajara V5
Flavio Javier Jarabeck
4.87 (38)
Metatrader 5 version of the famous Andre Machado's Tabajara indicator. If you don't know Andre Machado's Technical Analysis work you don't need this indicator... For those who need it and for those several friend traders who asked this porting from other platforms, here it is... FEATURES 8-period Moving Average 20-period Moving Average 50-period Moving Average 200-period Moving Average Colored candles according to the inflexion of the 20-period MA SETTINGS You can change the Period of all M
FREE
Waves PRO
Flavio Javier Jarabeck
For those who appreciate Richard Wyckoff approach for reading the markets, we at Minions Labs designed a tool derived - yes, derived, we put our own vision and sauce into this indicator - which we called Waves PRO . This indicator provides a ZigZag controlled by the market volatility (ATR) to build its legs, AND on each ZigZag leg, we present the vital data statistics about it. Simple and objective. This indicator is also derived from the great book called " The Secret Science of Price and Volum
LT Donchian Channel
Thiago Duarte
4.75 (4)
Donchian Channel is an indicator created by Richard Donchian. It is formed by taking the highest high and the lowest low of the last specified period in candles. The area between high and low is the channel for the chosen period. Its configuration is simple. It is possible to have the average between the upper and lower lines, plus you have alerts when price hits one side. If you have any questions or find any bugs, please contact me. Enjoy!
FREE
RENKO PRICE ACTION ATR is an "Expert Advisor" developed through the construction of the Renko Chart where each BRICK has the size calculated through the ATR of the period selected by the user. Renko charts are designed to filter out minor price movements, thus making it easier for traders to focus on important trends. Due to its efficiency in detecting price trends, it is also possible to clearly identify supports and resistances as well as top and bottom divergences, thus making better use of t
Questo indicatore ti mostrerà i valori TP e SL (in quella valuta) che hai già impostato per ogni ordine sui grafici (chiuso alla riga della transazione/ordine) che ti aiuteranno molto a stimare il tuo profitto e la tua perdita per ogni ordine. E ti mostra anche i valori PIP. il formato mostrato è "Valori valutari dei nostri profitti o perdite / valori PIP". Il valore TP sarà mostrato in colore verde e il valore SL sarà mostrato in colore rosso. Per qualsiasi domanda o ulteriori informazioni,
Description The indicator uses market profile theory to show the most relevant trading zones, on a daily basis. The zones to be shown are LVN (low volume nodes) and POC (point of control). An LVN zone is one which represents price areas with the least time or volume throughout the day. Typically, these areas indicate a supply or demand initiative, and in the future, they can turn into important breakout or retracement zones. A POC zone is one which represents price areas with the most time or vo
Your Trend Friend
Luigi Nunes Labigalini
The trend is your friend! Look at the color of the indicator and trade on that direction. It does not  repaint. After each candle is closed, that's the color of the trend. You can focus on shorter faster trends or major trends, just test what's most suitable for the symbol and timeframe you trade. Simply change the "Length" parameter and the indicator will automatically adapt. You can also change the color, thickness and style of the lines. Download and give it a try! There are big movements
Are you tired of drawing trendlines every time you're analyzing charts? Or perhaps you would like more consistency in your technical analysis. Then this is for you. This indicator will draw trend lines automatically when dropped on a chart. How it works Works similar to standard deviation channel found on mt4 and mt5. It has 2 parameters: 1. Starting Bar 2. Number of bars for calculation The   starting bar   is the bar which drawing of the trend lines will begin, while the   number of bars for c
FREE
Owl Smart Levels MT5
Sergey Ermolov
4.47 (36)
Versione MT4  |  FAQ L' indicatore Owl Smart Levels è un sistema di trading completo all'interno dell'unico indicatore che include strumenti di analisi di mercato popolari come i frattali avanzati di Bill Williams , Valable ZigZag che costruisce la corretta struttura a onde del mercato, e i livelli di Fibonacci che segnano i livelli esatti di entrata nel mercato e luoghi per prendere profitti. Descrizione dettagliata della strategia Istruzioni per lavorare con l'indicatore Consulente-assistente
Was: $249  Now: $99   Market Profile defines a number of day types that can help the trader to determine market behaviour. A key feature is the Value Area, representing the range of price action where 70% of trading took place. Understanding the Value Area can give traders valuable insight into market direction and establish the higher odds trade. It is an excellent addition to any system you may be using. Inspired by Jim Dalton’s book “Mind Over Markets”, this indicator is designed to suit the
Gli utenti di questo prodotto hanno anche acquistato
Innanzitutto è importante sottolineare che questo sistema di trading è un indicatore Non-Repainting, Non-Redrawing e Non-Lagging, il che lo rende ideale sia per il trading manuale che per quello automatico. Il "Sistema di Trading Smart Trend MT5" è una soluzione completa pensata sia per i trader principianti che per quelli esperti. Combina oltre 10 indicatori premium e offre più di 7 robuste strategie di trading, rendendolo una scelta versatile per diverse condizioni di mercato. Strategia di Tre
Atomic Analyst MT5
Issam Kassas
4.27 (11)
Innanzitutto, vale la pena sottolineare che questo indicatore di trading non è repaint, non è ridisegno e non presenta ritardi, il che lo rende ideale sia per il trading manuale che per quello automatico. L'Analista Atomico è un indicatore di azione del prezzo PA che utilizza la forza e il momentum del prezzo per trovare un miglior vantaggio sul mercato. Dotato di filtri avanzati che aiutano a rimuovere rumori e segnali falsi, e aumentare il potenziale di trading. Utilizzando più strati di in
Quantum Trend Sniper
Bogdan Ion Puscasu
5 (37)
Presentazione       Quantum Trend Sniper Indicator   , l'innovativo indicatore MQL5 che sta trasformando il modo in cui identifichi e scambi le inversioni di tendenza! Sviluppato da un team di trader esperti con un'esperienza di trading di oltre 13 anni,       Indicatore Quantum Trend Sniper       è progettato per spingere il tuo viaggio di trading verso nuove vette con il suo modo innovativo di identificare le inversioni di tendenza con una precisione estremamente elevata. *** Acquista Quant
FX Volume MT5
Daniel Stein
4.94 (17)
Ricevi il tuo aggiornamento quotidiano sul mercato con dettagli e schermate tramite il nostro Morning Briefing qui su mql5 e su Telegram ! FX Volume è il PRIMO e UNICO indicatore di volume che fornisce una visione REALE del sentiment del mercato dal punto di vista del broker. Fornisce informazioni straordinarie su come gli operatori di mercato istituzionali, come i broker, sono posizionati sul mercato Forex, molto più velocemente dei rapporti COT. Vedere queste informazioni direttamente sul vo
Trend Screener Pro MT5
STE S.S.COMPANY
4.89 (61)
Indicatore di tendenza, soluzione unica rivoluzionaria per il trading di tendenze e il filtraggio con tutte le importanti funzionalità di tendenza integrate in un unico strumento! È un indicatore multi-timeframe e multi-valuta al 100% non ridipingibile che può essere utilizzato su tutti i simboli/strumenti: forex, materie prime, criptovalute, indici e azioni. Trend Screener è un indicatore di tendenza che segue un indicatore efficiente che fornisce segnali di tendenza a freccia con punti nel gra
Innanzitutto, vale la pena sottolineare che questo Strumento di Trading è un Indicatore Non-Ridipingente, Non-Ridisegnante e Non-Laggante, il che lo rende ideale per il trading professionale. L'Indicatore Smart Price Action Concepts è uno strumento molto potente sia per i nuovi che per i trader esperti. Racchiude più di 20 utili indicatori in uno solo, combinando idee di trading avanzate come l'Analisi del Trader del Circolo Interno e le Strategie di Trading dei Concetti del Denaro Intelligen
FX Power MT5 NG
Daniel Stein
5 (4)
Ricevi il tuo aggiornamento quotidiano sul mercato con dettagli e schermate tramite il nostro Morning Briefing qui su mql5 e su Telegram ! FX Power MT5 NG è la nuova generazione del nostro popolare misuratore di forza delle valute, FX Power. Cosa offre questo misuratore di forza di nuova generazione? Tutto ciò che avete amato dell'FX Power originale IN PIÙ Analisi della forza di ORO/XAU Risultati di calcolo ancora più precisi Periodi di analisi configurabili individualmente Limite di calcolo pe
Advanced Supply Demand MT5
Bernhard Schweigert
4.53 (15)
La migliore soluzione per qualsiasi principiante o trader esperto! Questo indicatore è uno strumento di trading unico, di alta qualità e conveniente perché abbiamo incorporato una serie di funzionalità proprietarie e una nuova formula. Con questo aggiornamento, sarai in grado di mostrare fusi orari doppi. Non solo potrai mostrare una TF più alta, ma anche entrambe, la TF del grafico, PIÙ la TF più alta: SHOWING NESTED ZONES. Tutti i trader di domanda di offerta lo adoreranno. :) Informazioni imp
RelicusRoad Pro MT5
Relicus LLC
4.82 (22)
Ora $ 147 (aumentando a $ 499 dopo alcuni aggiornamenti) - account illimitati (PC o MAC) Manuale utente di RelicusRoad + Video di formazione + Accesso al gruppo Discord privato + Stato VIP UN NUOVO MODO DI GUARDARE IL MERCATO RelicusRoad è l'indicatore di trading più potente al mondo per forex, futures, criptovalute, azioni e indici, fornendo ai trader tutte le informazioni e gli strumenti di cui hanno bisogno per rimanere redditizi. Forniamo analisi tecniche e piani di trading per aiutar
XQ Indicator MetaTrader 5
Marzena Maria Szmit
5 (1)
Step into the realm of Forex trading with confidence and precision using XQ, a cutting-edge Forex indicator designed to elevate your trading game to unprecedented heights. Whether you're a seasoned trader or just stepping into the world of currency exchange, XQ Forex Indicator empowers you with the insights and signals needed to make informed trading decisions. The signal conditions are a combination of three indicators, and XQ Forex Indicator only display  medium and long-term trends . The ind
Volume by Price MT5
Brian Collard
5 (3)
The Volume by Price Indicator for MetaTrader 5 features Volume Profile and Market Profile TPO (Time Price Opportunity). Get valuable insights out of currencies, equities and commodities data. Gain an edge trading financial markets. Volume and TPO histogram bar and line charts. Volume Footprint charts. TPO letter and block marker charts including split structures. Versatile segmentation and compositing methods. Static, dynamic and flexible ranges with relative and/or absolute visualizations. Lay
Auto Order Block with break of structure based on ICT and Smart Money Concepts Futures Break of Structure ( BoS )             Order block ( OB )            Higher time frame Order block / Point of Interest ( POI )    shown on current chart           Fair value Gap ( FVG ) / Imbalance   ,  MTF      ( Multi Time Frame )    Volume Imbalance     ,  MTF          vIMB Gap’s Equal High / Low’s     ,  MTF             EQH / EQL Liquidity               Current Day High / Low           HOD /
Top indicator for MT5   providing accurate signals to enter a trade without repainting! It can be applied to any financial assets:   forex, cryptocurrencies, metals, stocks, indices .  Watch  the video  (6:22) with an example of processing only one signal that paid off the indicator! MT4 version is here It will provide pretty accurate trading signals and tell you when it's best to open a trade and close it. Most traders improve their trading results during the first trading week with the help of
ICT, SMC, SMART MONEY CONCEPTS, SMART MONEY, Smart Money Concept, Support and Resistance, Trend Analysis, Price Action, Market Structure, Order Blocks, BOS/CHoCH,   Breaker Blocks ,  Momentum Shift,   Supply&Demand Zone/Order Blocks , Strong Imbalance,   HH/LL/HL/LH,    Fair Value Gap, FVG,  Premium  &   Discount   Zones, Fibonacci Retracement, OTE, Buy Side Liquidity, Sell Side Liquidity, BSL/SSL Taken, Equal Highs & Lows, MTF Dashboard, Multiple Time Frame, BigBar, HTF OB, HTF Market Structure
Il profitto dalla struttura del mercato cambia quando il prezzo si inverte e si ritira. L'indicatore di avviso di inversione della struttura del mercato identifica quando una tendenza o un movimento di prezzo si sta avvicinando all'esaurimento e pronto a invertire. Ti avvisa dei cambiamenti nella struttura del mercato che in genere si verificano quando stanno per verificarsi un'inversione o un forte pullback. L'indicatore identifica inizialmente i breakout e lo slancio del prezzo, ogni volta
Blahtech Supply Demand MT5
Blahtech Limited
4.57 (14)
Was: $299  Now: $99   Supply Demand uses previous price action to identify potential imbalances between buyers and sellers. The key is to identify the better odds zones, not just the untouched ones. Blahtech Supply Demand indicator delivers functionality previously unavailable on any trading platform. This 4-in-1 indicator not only highlights the higher probability zones using a multi-criteria strength engine, but also combines it with multi-timeframe trend analysis, previously confirmed swings
L'indicatore Quadrato di Gann è uno strumento potente di analisi di mercato basato sull'articolo "Formula Matematica per le Previsioni di Mercato" scritto da W.D. Gann. Questo strumento utilizza concetti matematici e teorie di Gann per effettuare un'analisi precisa del mercato. Utilizza i quadrati di 144, 90, 52 e anche il quadrato di 9. Inoltre, integra il metodo del  per il quadrato di 9 e la sua relazione con canali e modelli stellari di quel quadrato. Manuale Utente e Applicazione: Prima di
Trend Line Map Pro MT5
STE S.S.COMPANY
4.67 (9)
Trend Line Map indicator is an addons for   Trend Screener Indicator . It's working as a scanner for all signals generated by Trend screener ( Trend Line Signals ) . It's a Trend Line Scanner based on Trend Screener Indicator.  If you don't have Trend Screener Pro Indicator,   the Trend Line Map Pro will not work.     LIMITED TIME OFFER : Trend Line Map Indicator is available for only 50 $ and lifetime. ( Original price 125$ ) By accessing to our MQL5 Blog,  you can find all our premium indica
TrendLine PRO MT5
Evgenii Aksenov
4.78 (49)
The Trend Line PRO indicator is an independent trading strategy. It shows the trend change, the entry point to the transaction, as well as automatically calculates three levels of Take Profit and Stop Loss protection Trend Line PRO is perfect for all Meta Trader symbols: currencies, metals, cryptocurrencies, stocks and indices Advantages of Trend Line PRO Never redraws its signals The possibility of using it as an independent strategy It has three automatic levels Take Profit and Stop Loss lev
Presentazione       Quantum Breakout PRO   , l'innovativo indicatore MQL5 che sta trasformando il modo in cui scambi le zone di breakout! Sviluppato da un team di trader esperti con un'esperienza di trading di oltre 13 anni,       Quantum Breakout PRO       è progettato per spingere il tuo viaggio di trading a nuovi livelli con la sua strategia innovativa e dinamica della zona di breakout. Quantum Breakout Indicator ti fornirà frecce di segnalazione sulle zone di breakout con 5 zone target
AW Trend Predictor MT5
AW Trading Software Limited
4.76 (54)
La combinazione di trend e livelli di rottura in un unico sistema. Un algoritmo di indicatore avanzato filtra il rumore del mercato, determina la tendenza, i punti di ingresso e i possibili livelli di uscita. I segnali indicatori sono registrati in un modulo statistico, che permette di selezionare gli strumenti più adatti, mostrando l'efficacia dello storico dei segnali. L'indicatore calcola i segni Take Profit e Stop Loss. Manuale e istruzioni ->   QUI   / versione MT4 ->   QUI Come fare tradi
Gartley Hunter Multi
Siarhei Vashchylka
5 (5)
Gartley Hunter Multi - An indicator for searching for harmonic patterns simultaneously on dozens of trading instruments and on all classic timeframes: (m1, m5, m15, m30, H1, H4, D1, Wk, Mn). Manual (Be sure to read before purchasing) | Version for MT4 Advantages 1. Patterns: Gartley, Butterfly, Shark, Crab. Bat, Alternate Bat, Deep Crab, Cypher 2. Simultaneous search for patterns on dozens of trading instruments and on all classic timeframes 3. Search for patterns of all possible sizes. Fr
TPSproTREND PrO MT5
Roman Podpora
5 (5)
TPSpro TRENDPRO  - is a trend indicator that automatically analyzes the market and provides information about the trend and each of its changes, as well as giving signals for entering trades without redrawing! The indicator uses each candle, analyzing them separately. referring to different impulses - up or down impulse. Exact entry points into transactions for currencies, crypto, metals, stocks, indices!  -  Version MT4                  DETAILED DESCRIPTION        /       TRADING SETUPS       
Golden Spikes Detector
Batsirayi L Marango
5 (1)
Golden Spikes Detector This indicator is based on an advanced strategy primarily for trading spikes on Boom and Crash Indices. Complex algorithms were implemented to detect high probability entries only. It alerts on potential Buy and Sell entries. To trade spikes on the Deriv or Binary broker, only take Buy Boom and Sell Cash alerts. It was optimised to be loaded on 5-minute timeframe although multiple timeframe analysis is done in the background. Features ·             Desktop pop up and sound
Matrix Arrow Indicator MT5
Juvenille Emperor Limited
5 (14)
Matrix Arrow Indicator MT5   è un trend unico 10 in 1 che segue un indicatore multi-timeframe al   100% non ridipinto   che può essere utilizzato su tutti i simboli/strumenti:   forex ,   materie prime ,   criptovalute ,   indici ,   azioni .  Matrix Arrow Indicator MT5  determinerà la tendenza attuale nelle sue fasi iniziali, raccogliendo informazioni e dati da un massimo di 10 indicatori standard, che sono: Indice di movimento direzionale medio (ADX) Indice del canale delle materie prime (CCI
IX Power MT5
Daniel Stein
5 (2)
IX Power   porta finalmente l'imbattibile precisione di FX Power ai simboli non-Forex. Determina con precisione l'intensità delle tendenze a breve, medio e lungo termine dei vostri indici preferiti, azioni, materie prime, ETF e persino criptovalute. Potete   analizzare tutto ciò che   il vostro terminale ha da offrire. Provatelo e sperimentate come   il vostro tempismo migliori significativamente   durante il trading. Caratteristiche principali di IX Power Risultati di calcolo precisi al
Account Graph MT5
Kyra Nickaline Watson-gordon
5 (1)
An indicator to draw a graph of account current and historical state such as Balance, Equity, Margin, Free Margin, Margin Level, Drawdown, Account Profit, Deposit and Withdrawals. Indicator Inputs : Draw Balance Graph Draw Equity Graph Draw Margin Graph Draw Free Margin Graph Draw Margin Level Graph Draw Drawdown Graph Draw Account Profit Graph Hide Data on Chart and Buffers Connect Gaps by Lines Sign of DDs on Profit Sign of DDs on Loss Tips : The Indicator will draw historical balance gra
** All Symbols x All Timeframes scan just by pressing scanner button ** ***Contact me after purchase to send you instructions and add you in "123 scanner group" for sharing or seeing experiences with other users. After 15 years of experience in the markets and 3 years of programming, Winner indicator is ready. I would like to share with you! Introduction The 123 Pattern Scanner indicator with a special enhanced algorithm is a very repetitive common pattern finder with a high success rate . Inte
Smart Peak Bottom
Xiaoyu Huang
5 (2)
Questo è un chiaro indicatore per giudicare massimi e minimi e funziona bene per il mercato oscillante. Prezzo promozionale 49$ → 59$ caratteristiche bravo a giudicare alti e bassi Nessun ridisegno, nessuna deriva Calcolo veloce, nessun ritardo Ricca modalità di promemoria È possibile regolare più parametri e colori parametro "======== Principale ========" HighLowPeriod1 = 9 HighLowPeriod2 = 60 HighLowPeriod3 = 34 HighLowEMAPeriod = 4 MASignalPeriod = 5 "======== Notifica ========" UseAle
Golden Gate Algo MT5
James David Lane
4 (6)
40% DI SCONTO PER NATALE! AUMENTO DEL PREZZO A $250 IL 1 GENNAIO! Presentiamo GoldenGate Entries: una soluzione di trading all'avanguardia! Scopri un approccio rivoluzionario al trading con GoldenGate Entries (GGE), un indicatore avanzato progettato per migliorare la tua esperienza di trading. GGE offre un set completo di funzionalità per fornire agli utenti precisione e fiducia nelle loro decisioni di trading. Coppie: Qualsiasi (FX - Materie prime - Azioni - Azioni - Cripto) TimeFrame
Altri dall’autore
WAPV Full MT5
Eduardo Da Costa Custodio Santos
## Se non riesci a utilizzare la versione demo, ti preghiamo di contattarci tramite messaggio. ## Opera in modo professionale utilizzando WAPV Full ed essere in grado di tracciare dove sono i soldi dei grandi giocatori Immagina di avere tra le mani uno strumento che da solo fa la lettura dei principali attori del mercato, mostrando le migliori regioni di trading basato sull'analisi dei prezzi e dei volumi. WAPV Full è uno strumento completo, focalizzato al 100% sull'operatività di R. Wyckof
WAPV Box Effort x Result
Eduardo Da Costa Custodio Santos
RISULTATO WA_PV_BOX_EFFORT X per MT5 Il WAPV Box Effort x Result Indicator fa parte del gruppo Package Indicators (Wyckoff Academy Wave Market). L'indicatore WAPV Box Effort x Result Indicator per MT5 ti aiuta a leggere il prezzo e il volume. La sua lettura consiste nell'assistere nell'identificazione dello sforzo x risultato in onde create dal grafico. L'indicatore WAPV Box Effort x Result Indicator per MT5 quando la casella è verde significa che il volume è a favore della domanda e quando la c
HLC bar MT5 Wyckoff
Eduardo Da Costa Custodio Santos
L'indicatore "HLC_bar_MT5 Wyckoff" per MT5 è stato creato per facilitare l'analisi al momento del trading. La barra HLC è stata utilizzata da Richard Wyckoff ed è attualmente ampiamente utilizzata nelle operazioni "VSA". Wyckoff ha scoperto che l'utilizzo di High, Low e Close ha reso il grafico molto più pulito e più facile da analizzare. L'indicatore "HLC_bar_MT5 Wyckoff" consente: # Cambia la larghezza della barra; # Lascia la barra dello stesso colore; # Ed evidenzia la barra che si è aperta
VSA Smart Money
Eduardo Da Costa Custodio Santos
L'indicatore VSA Smart Money tiene traccia del movimento di trader professionisti, scambi istituzionali e tutti i movimenti di uomini composti. L'indicatore di denaro intelligente VSA legge barra per barra, essendo uno strumento eccellente per coloro che utilizzano VSA, Wyckoff, PVA e qualsiasi altra analisi che utilizza prezzo e volume. Ci sono 10 indicazioni che troverai nella tua Carta: *No Demand *Climax *UT Thrust *Top Reversal bar *Stop Volume *No Supply *Spring *Bottom Reversal *Shakeout
Volume Zone Fractal
Eduardo Da Costa Custodio Santos
VZO Plus è un indicatore che mostra le regioni di ipercomprato e ipervenduto in base al volume scambiato. #Quando la linea dell'indicatore è compresa tra -40 e -60 è ipervenduta #Quando la linea dell'indicatore è tra 40 e 60 è ipercomprato. Al di fuori di queste regioni, il mercato segue per inerzia il suo percorso naturale. Sopra la linea verde, significa che il mercato è positivo, Un altro modo per analizzare l'indicatore è attraverso le regioni di divergenza. Quando abbiamo il minimo più alto
Jac Trend
Eduardo Da Costa Custodio Santos
Il JAC Trend Indicator per MT5 è stato creato per facilitare l'identificazione del trend di mercato in modo facile e agile. # Quando l'indicatore JAC Trend è verde, abbiamo un mercato da pre-tendenza a tendenza rialzista. # Quando l'indicatore JAC Trend è rosso, abbiamo un mercato pre-tendenza verso un trend ribassista. # Quando l'indicatore JAC Trend è grigio, abbiamo un mercato secondario senza forza. In questo modo hai tutte le parti a cui il mercato può rivolgersi in modo chiaro e obiettivo.
Z Score Plus MT5
Eduardo Da Costa Custodio Santos
In finanza, i punteggi Z sono misure della variabilità di un'osservazione e possono essere utilizzati dai trader per determinare la volatilità del mercato. I punteggi Z indicano ai trader se un punteggio è tipico per un set di dati specificato o è atipico. I punteggi Z consentono inoltre agli analisti di adattare i punteggi di più set di dati per creare punteggi che possono essere confrontati in modo più accurato tra loro. # In pratica abbiamo lo ZScore con punto zero e oscillazioni tra 2 e 3 pe
Trend Everest
Eduardo Da Costa Custodio Santos
L'indicatore Trend Everest MT5 è un indicatore che segue la tendenza che aiuta nel processo decisionale. Si basa sul calcolo dell'ATR che assiste e dello scafo medio. Un problema chiave è che il candidato Trend Everest MT5 non ridipinge, quindi puoi eseguire il backtest con maggiore sicurezza. Quando è Green High Trend Quando è rosso trend ribassista. Non che il mercato sia frattale, quindi più lungo è il tempo grafico, maggiore è il suo grado di assertività.
JAC Trend Color Candle
Eduardo Da Costa Custodio Santos
L'indicatore "JAC Trend Color Candle" per Meta Trader 5, è stato creato per facilitare visivamente il trend per il trader. Si basa su tre parametri, che identificano il mercato rialzista, ribassista e non-trend. I colori sono configurabili dal trader e anche il trader medio configurabile. i parametri di trend non possono essere configurati in quanto sono differenziali dell'indicatore.
WAPV adh Supply and Demand
Eduardo Da Costa Custodio Santos
L'indicatore WAPV ADH Supply and Demand fa parte di una serie di indicatori chiamati (Wyckoff Academy Wave Market) L' indicatore WAPV ADH Supply and Demand per MT5 ha lo scopo di identificare il lato vincente tra acquirenti e venditori. La sua lettura è molto semplice, quando la linea verde è al di sopra della linea rossa la domanda è al comando, quando la linea rossa è al di sopra della linea verde l'offerta è al comando. Più positive sono le linee verde e rossa, più alto è il volume in ingress
WAPV adh Supply and Demand Forex
Eduardo Da Costa Custodio Santos
L'indicatore Forex WAPV ADH Supply and Demand fa parte di una serie di indicatori chiamati (Wyckoff Academy Wave Market) L'indicatore WAPV ADH Forex Supply and Demand per MT5 ha lo scopo di identificare il lato vincente tra acquirenti e venditori. La sua lettura è molto semplice, quando la linea verde è al di sopra della linea rossa la domanda è al comando, quando la linea rossa è al di sopra della linea verde l'offerta è al comando. Più positive sono le linee verde e rossa, più alto è il volume
Wapv Price and volume
Eduardo Da Costa Custodio Santos
L'indicatore di prezzo e volume WAPV per MT5 fa parte del set di strumenti (Wyckoff Academy Wave Market) e (Wyckoff Academy Price and Volume). L'indicatore di prezzo e volume WAPV per MT5 è stato creato per semplificare la visualizzazione del movimento del volume sul grafico in modo intuitivo. Con esso puoi osservare i momenti di picco del volume e i momenti in cui il mercato non ha interesse professionale Identifica i momenti in cui il mercato si muove per inerzia e non per movimento di "denaro
Weis Wave Double Side
Eduardo Da Costa Custodio Santos
L'indicatore laterale Weis Wave Bouble per MT5 fa parte del toolkit (Wyckoff Academy Wave Market) L'indicatore laterale Weis Wave Bouble per MT5 è stato creato sulla base della già consolidata Weis Wave creata da David Weis. L'indicatore Weis Wave Double Side legge il mercato a ondate come è stato fatto da R. Wyckoff nel 1900. Aiuta a identificare sforzo x risultato, causa ed effetto e domanda e offerta Il suo differenziale è che può essere utilizzato sotto l'asse zero, migliorando ulteriormente
Weis Wave Double Side Alert
Eduardo Da Costa Custodio Santos
L'indicatore laterale Weis Wave Bouble per MT5 fa parte del toolkit (Wyckoff Academy Wave Market) L'indicatore laterale Weis Wave Bouble per MT5 è stato creato sulla base della già consolidata Weis Wave creata da David Weis. L'indicatore Weis Wave Double Side legge il mercato a ondate come fece R. Wyckoff nel 1900. Aiuta a identificare sforzo x risultato, causa ed effetto e domanda e offerta Il suo differenziale è che può essere utilizzato sotto l'asse zero e mostra un avviso di breakout Chi è f
VSA Candle Signal
Eduardo Da Costa Custodio Santos
VSA Candle Signal per MT5 fa parte del set di strumenti (prezzo e volume della Wyckoff Academy). La sua funzione è quella di identificare la correlazione di Prezzo e Volume nella formazione della candela. La sua creazione si basa sulle premesse di R.Wyckoff, un precursore nell'analisi del prezzo e del volume. VSA Candle Signal per MT5 aiuta nel processo decisionale, lasciando la tua lettura più chiara e fluida. Vedi le immagini qui sotto.
Force and Weakness Trading
Eduardo Da Costa Custodio Santos
L'indicatore di forza e debolezza per MT5 Forex fa parte del Toolkit (Wyckoff Academy Price and Volume) L'indicatore di forza e debolezza per MT5 Forex è stato sviluppato per identificare la forza e la debolezza del volume in modo accumulato. Consentendo la visione di un panorama tra prezzo e volume. L'indicatore può essere utilizzato come oscillatore e come istogramma. Come al solito ha tutte le premesse delle tre leggi di R. Wyckoff se messe insieme al prezzo: Causa ed effetto, sforzo x risult
WAPV Force and Weakness MT5
Eduardo Da Costa Custodio Santos
L'indicatore di forza e debolezza per il volume reale MT5 fa parte del set di strumenti (Wyckoff Academy Price and Volume) L'indicatore di forza e debolezza per il volume reale MT5 è stato sviluppato per identificare la forza e la debolezza del volume in modo accumulato. Consentendo la visione di un panorama tra prezzo e volume. L'indicatore può essere utilizzato come oscillatore e come istogramma. Come fantasia ha tutte le premesse delle tre leggi di R. Wyckoff se messe insieme al prezzo: Causa
WAPV Weis Wave Chart Forex
Eduardo Da Costa Custodio Santos
Il Weis Wave Chart Forex per MT5 è un indicatore di prezzo e volume. La lettura del prezzo e del volume è stata ampiamente diffusa tramite Richard Demille Wyckoff sulla base delle tre leggi da lui create: offerta e domanda, causa ed effetto e sforzo contro risultato. Già nel 1900 R.Wyckoff utilizzava la carta delle onde nelle sue analisi. Molti anni dopo, intorno al 1990, David Weis ha automatizzato il diagramma delle onde di R. Wyckoff e oggi vi portiamo l'evoluzione del diagramma delle onde di
WAPV Weis Wave Chart MT5
Eduardo Da Costa Custodio Santos
Il grafico Weis Wave per MT5 è un indicatore di prezzo e volume. La lettura del prezzo e del volume è stata ampiamente diffusa tramite Richard Demille Wyckoff sulla base delle tre leggi da lui create: offerta e domanda, causa ed effetto e sforzo contro risultato. Già nel 1900 R.Wyckoff utilizzava la carta delle onde nelle sue analisi. Molti anni dopo, intorno al 1990, David Weis ha automatizzato il diagramma delle onde di R. Wyckoff e oggi vi portiamo l'evoluzione del diagramma delle onde di Dav
WA Order Block FVG bos MT5
Eduardo Da Costa Custodio Santos
O  WA Order Block FVG bos MT5  é um indicador com base no estudo de SMC (Smart Money Concepts) criado pelo ICT Inner Circle Trader, eleplota no seu gráfico as informações de Order Blocks em 3 tempos gráficos diferentes, fair Value Gaps e Regiões de Liquidez além do BOS ( Break os Structures), tudo em um só indicador. Dessa forma você não precisa colocar essas informações de forma manual. Agora você tem tudo isso de forma automática em seu gráfico.
Filtro:
Nessuna recensione
Rispondi alla recensione