• Panoramica
  • Recensioni
  • Commenti
  • Novità

Level Predictor

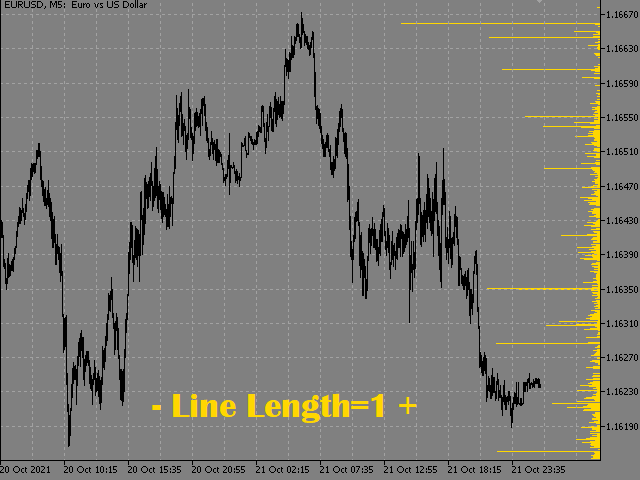
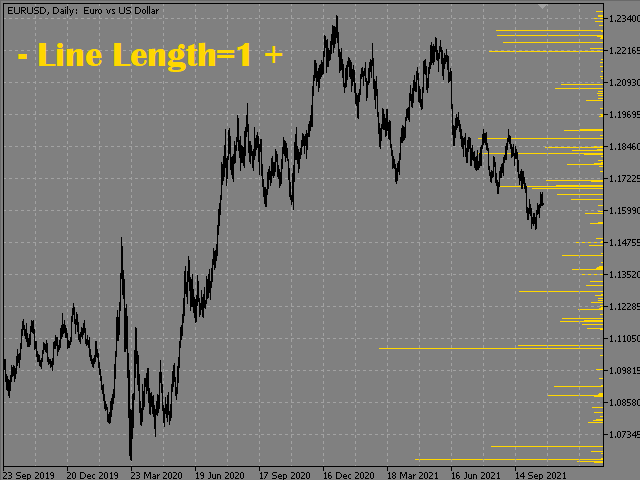
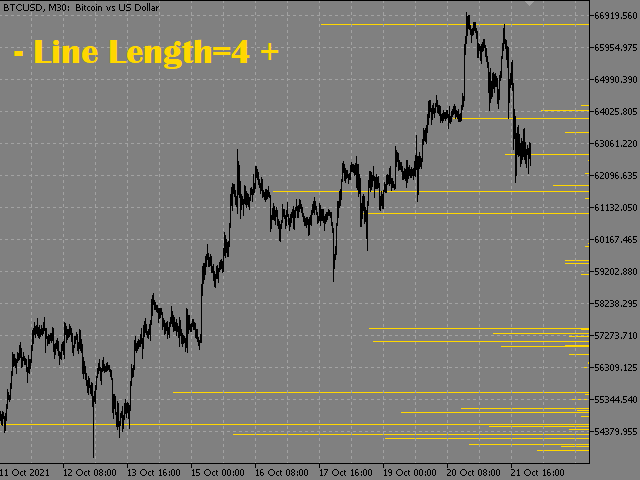
L'indicatore disegna livelli potenziali che potrebbero diventare livelli significativi di supporto e resistenza in futuro.

Più lunga è la linea, maggiore è la probabilità di un'inversione del prezzo o di un aumento del movimento dei Prezzi dopo la rottura di questo livello.
Con la diminuzione della probabilità di formazione del livello, la lunghezza della linea è ridotta.

L'indicatore non richiede alcuna regolazione.

Nelle impostazioni è possibile modificare il design dell'indicatore.

Il grafico mostra il pulsante "Line_Length" per regolare la lunghezza delle linee (per facilitare la percezione dell'indicatore).
L'impostazione "Line_Length" selezionata viene salvata per ogni periodo di tempo e strumento.
Il pulsante "Line_Length"può essere trascinato con il mouse.
Quando si passa sopra il bordo sinistro del pulsante, viene evidenziato con il colore selezionato e, quando si fa clic, il numero diminuisce e le linee dell'indicatore si accorciano.
Quando si passa sopra il bordo destro del pulsante, viene evidenziato con il colore selezionato e, quando viene premuto, il numero aumenta e le linee dell'indicatore si allungano.
Prodotti consigliati
Daily Candle Predictor è un indicatore che prevede il prezzo di chiusura di una candela. L'indicatore è destinato principalmente all'uso sui grafici D1. Questo indicatore è adatto sia per il trading forex tradizionale che per il trading di opzioni binarie. L'indicatore può essere utilizzato come sistema di trading autonomo o può fungere da aggiunta al sistema di trading esistente. Questo indicatore analizza la candela corrente, calcolando alcuni fattori di forza all'interno del corpo della cande
Fibonacci retracement and extension line drawing tool Fibonacci retracement and extended line drawing tool for MT4 platform is suitable for traders who use  golden section trading Advantages: There is no extra line, no too long line, and it is easy to observe and find trading opportunities Trial version: https://www.mql5.com/zh/market/product/35884 Main functions: 1. Multiple groups of Fibonacci turns can be drawn directly, and the relationship between important turning points
VR Cub
Vladimir Pastushak
VR Cub è un indicatore per ottenere punti di ingresso di alta qualità. L'indicatore è stato sviluppato per facilitare i calcoli matematici e semplificare la ricerca dei punti di ingresso in una posizione. La strategia di trading per la quale è stato scritto l'indicatore ha dimostrato la sua efficacia per molti anni. La semplicità della strategia di trading è il suo grande vantaggio, che consente anche ai trader alle prime armi di commerciare con successo con essa. VR Cub calcola i punti di apert
Gold Phoenix
Yaroslav Varankin
The perfect tool for Scalng in the Forex markets You can trade both from signal to signal and using take profit  The algorithm does not use Zigzag!  No redrawing!  This is a channel instrument that uses a moving average as a filter. Moving Average  There are 2 parameters for the settings Ma Period = 5 period Moving Average  Channel 1.0 distance of channel lines from the chart Price Signal Filter - calculation of signal opening and filter There is a complete set of Alert There is a multi-timefram
Cosmic Diviner X Planet
Olena Kondratenko
4 (2)
This unique multi-currency strategy simultaneously determines the strength of trends and market entry points, visualizing this using histograms on the chart. The indicator is optimally adapted for trading on the timeframes М5, М15, М30, Н1. For the convenience of users, the indicator renders the entry point (in the form of an arrow), recommended take profit levels (TP1, TP2 with text labels) and the recommended Stop Loss level. The take profit levels (TP1, TP2) are automatically calculated for
Noize Absorption Index MT4
Ekaterina Saltykova
5 (1)
Noize Absorption Index - is the manual trading system that measures the difference of pressure between bears forces and bulls forces. Green line - is a noize free index that showing curent situation. Zero value of index shows totally choppy/flat market.Values above zero level shows how powerfull bullish wave is and values below zero measures bearish forces.Up arrow appears on bearish market when it's ready to reverse, dn arrow appears on weak bullish market, as a result of reverse expectation. S
Owl smart levels
Sergey Ermolov
4.63 (54)
Versione MT5  |  FAQ L' indicatore Owl Smart Levels   è un sistema di trading completo all'interno dell'unico indicatore che include strumenti di analisi di mercato popolari come i   frattali avanzati di Bill Williams , Valable ZigZag che costruisce   la corretta struttura a onde   del mercato, e i   livelli di Fibonacci che segnano i livelli esatti di entrata nel mercato e luoghi per prendere profitti. Descrizione dettagliata della strategia Istruzioni per lavorare con l'indicatore Consulente-
L'indicatore calcola e traccia automaticamente i livelli di supporto e resistenza di Fibonacci, uno degli strumenti più efficaci per l'analisi di mercato. Il calcolo utilizza i dati del prezzo medio per il periodo e l'intervallo di tempo selezionati. Il minimo e il massimo per questo periodo sono presi come inizio e fine del movimento. I livelli di Fibonacci ti consentono di vedere potenziali punti di riferimento, attorno ai quali il movimento dei prezzi può rallentare o invertire, ovvero vengon
Gold Bricks FX USES THE TREND WAVE INDICATOR AND IT CAN IDENTIFY THE BEGINNING AND THE END OF A NEW WAVE TREND MOVEMENT. AS AN OSCILLATOR, THE INDICATOR IDENTIFIES THE OVERBOUGHT AND OVERSOLD ZONES. IT WORKS GREAT TO CATCH THE SHORT TERM PRICE REVERSALS AND USES A MARTINGALE STRATEGY TO CLOSE ALL TRADES IN PROFIT. USE DEFAULT SETTINGS ON H1 OR HIGHER TIME FRAME ON ANY PAIR FOR MORE ACCURATE TRADES WHY THIS EA : Smart entries calculated by 4 great strategies The EA can be run on even a
Pattern 123
Pavel Verveyko
"Pattern 123" is an indicator-a trading system built on a popular pattern, pattern 123. This is the moment when we expect a reversal on the older trend and enter the continuation of the small trend, its 3rd impulse. The indicator displays signals and markings on an open chart. You can enable/disable graphical constructions in the settings. The indicator has a built-in notification system (email, mobile terminal, standard terminal alert). "Pattern 123" has a table that displays signals from
The Th3Eng PipFinite indicator is based on a very excellent analysis of the right trend direction with perfect custom algorithms. It show the true direction and the best point to start trading. With StopLoss point and Three Take Profit points. Also it show the right pivot of the price and small points to order to replace the dynamic support and resistance channel, Which surrounds the price. And Finally it draws a very helpful Box on the left side on the chart includes (take profits and Stop loss
Trade with Gann on your side!! MASTER CIRCLE 360 CIRCLE CHART, originally created by Gann admitted that this is “The Mother of all charts”. It is one of the last studies that this great trader left for us. The numeric tab le is apparently quite simple like all the tables and is based on square numbers, the SQUARE OF 12 and is by evolution, one of the most important square numbers. Here we can find CYCLE, PRICE AND TIME thanks to angles and grades, to show past and future support and resistance.
Point61 Indicator
Evgeniy Machok
5 (1)
The Point61 indicator is the result of many years of monitoring of price behavior of currency pairs and metals. It is not a secret, that in times of uncertainty, traders are looking for possible levels of support and resistance - the point, where price should stop its movement. There are 2 possible scenarios at these points: 1. Reverse (correction) to the opposite direction; 2. Breakthrough to continue movement. Very often these points are used to set stop orders - TakeProfit or
Infinity Trend Pro
Yaroslav Varankin
1 (1)
This is a trend indicator without redrawing Developed instead of the binary options strategy (by the color of the Martingale candlestick) Also works well in forex trading When to open trades (binary options) A signal will appear in the place with a candle signaling the current candle It is recommended to open a deal for one candle of the current timeframe M1 and M5 When a blue dot appears, open a deal up When a red dot appears, open a trade down. How to open trades on Forex. When a signal is rec
How to use Pair Trading Station Pair Trading Station is recommended for H1 time frame and you can use it for any currency pairs. To generate buy and sell signal, follow few steps below to apply Pair Trading Station to your MetaTrader terminal. When you load Pair Trading Station on your chart, Pair Trading station will assess available historical data in your MetaTrader platforms for each currency pair. On your chart, the amount of historical data available will be displayed for each currency pai
Doesn't redraw! "Xhmaster formula forex indicator" - a new oscillator indicator with regression mathematical modeling of free numerical series. This indicator is 60% more accurate in identifying price reversal points compared to the standard "Xmaster formula" indicator, and it is less sensitive to small price fluctuations. "Xhmaster formula forex indicator" is a unique and advanced tool designed specifically for traders in the Forex market. It provides traders with excellent opportunities for s
Blahtech Market Profile
Blahtech Limited
4.61 (18)
Was: $249  Now: $99   Market Profile defines a number of day types that can help the trader to determine market behaviour. A key feature is the Value Area, representing the range of price action where 70% of trading took place. Understanding the Value Area can give traders valuable insight into market direction and establish the higher odds trade. It is an excellent addition to any system you may be using. Blahtech Limited presents their Market Profile indicator for the MetaTrader community. Ins
This is the FXTraderariel-TakeProfit - Stop Loss Indicator . It provides you 3 potential Take Profits and 1 Stop Loss. These potential targets are computed based on several methods . The indicator can be used on every time frame, but we advise to use it on H1, H4 and D1. Especially if you are a novice trader. Pro Traders can also you use it for scalping in smaller time frames (M1, M5 and M15). This indicator is not a complete trading system. It doesn't provide you a Signal nor can predict the m
Trend Ray
Andriy Sydoruk
The indicator shows the potential trend direction by cyclical-wave dependence. Thus, all the rays of the intersection will be optimal rays, in the direction of which the price is expected to move, taking into account the indicator period. Rays can be used as a direction for potential market movement. But we must not forget that the approach must be comprehensive, the indicator signals require additional information to enter the market.
This is an arrow indicator without a future function,developed based on the most advanced profit trading algorithms.It has the most innovative and advanced dual trend analysis module, as well as the latest and highly effective market trend prediction algorithm.Trends are your friends, and following larger trends can earn the maximum profit in foreign exchange. This indicator helps traders identify current trends and track them. Someone once made a profit of 10 times in a week by relying on it.No
This indicator is a must have tool that scans the active chart for candlestick patterns. It labels each bar according the candlestick pattern(s) that it finds enabling you to more easily analyze price action and be more informed about your trading decision. There are 103 common and uncommon possible patterns plus 6 new patterns based on research that the indicator can identify. If a candlestick(s) meets the requirements for multiple patterns, the bar will be labeled with up to 4 patterns names f
Market Shaver
Remi Passanello
Rasoio da mercato   Scalper del mercato Questo indicatore fa parte dei sistemi RPTrade Pro Solutions. Market Scalper è un indicatore di tendenza giornaliero che utilizza Price Action, Dynamic Support e Resistances. È progettato per essere utilizzato da chiunque, anche il principiante assoluto nel trading può usarlo. NON ridipinge MAI. Le indicazioni sono date da vicino a vicino. Progettato per essere utilizzato da solo, non sono necessari altri indicatori. Ti dà indicazioni chiare e semplici
Atomic Analyst
Issam Kassas
5 (3)
Innanzitutto, vale la pena sottolineare che questo indicatore di trading non è repaint, non è ridisegno e non presenta ritardi, il che lo rende ideale sia per il trading manuale che per quello automatico. L'Analista Atomico è un indicatore di azione del prezzo PA che utilizza la forza e il momentum del prezzo per trovare un miglior vantaggio sul mercato. Dotato di filtri avanzati che aiutano a rimuovere rumori e segnali falsi, e aumentare il potenziale di trading. Utilizzando più strati di in
PZ Support Resistance
PZ TRADING SLU
3.33 (3)
Tired of plotting support and resistance lines? This is a multi-timeframe indicator that detects and plots supports and resistance lines in the chart with the same precision as a human eye would. As price levels are tested over time and its importance increases, the lines become thicker and darker, making price leves easy to glance and evaluate. [ Installation Guide | Update Guide | Troubleshooting | FAQ | All Products ] Boost your technical analysis Customizable timeframe selection Read pri
TrendCand
Andriy Sydoruk
This trend indicator shows successful signals. It can be used with an optimal risk/reward ratio. The efficiency rate of the trend is 80%. The product shows the best opportunity to enter the market using the arrows. The indicator can be used for pipsing on small periods, as well as for the long-term trade. The indicator uses two parameters for the settings. The indicator does not redraw and lag. Take profit exceeds stop loss by 6-8 times on average! The product works on all currency pairs and all
Trend PA
Mikhail Nazarenko
5 (3)
The Trend PA indicator uses   Price Action   and its own filtering algorithm to determine the trend. This approach helps to accurately determine entry points and the current trend on any timeframe. The indicator uses its own algorithm for analyzing price changes and Price Action. Which gives you the advantage of recognizing, without delay, a new nascent trend with fewer false positives. Trend filtering conditions can be selected in the settings individually for your trading style. The indicator
PZ Trend Trading
PZ TRADING SLU
4.75 (4)
Trend Trading is an indicator designed to profit as much as possible from trends taking place in the market, by timing pullbacks and breakouts. It finds trading opportunities by analyzing what the price is doing during established trends. [ Installation Guide | Update Guide | Troubleshooting | FAQ | All Products ] Trade financial markets with confidence and efficiency Profit from established trends without getting whipsawed Recognize profitable pullbacks, breakouts and early reversals The ind
Intraday Levels shows intraday levels grid for intraday trading Shows a grid for the day levels, gives you a guide to know the trend and to measure intraday trades (stop-loss and take-profit). Parameters are: Levels Mode: Basic mode: Shows highest, lowest and middle levels. Advanced mode: Shows highest, lowest, middle and intermediate levels. Fibonacci mode: Shows session Fibonacci retracements levels. Momentum mode: Shows delayed Advanced levels to identify momentum. Smooth Period (Momentum
MetaTrend M4
Vahidreza Heidar Gholami
5 (1)
Meta Trend Indicator is an efficient way to forecast and detect the trend in any market. It reveals the trend, support and resistance levels, volatility and the maximum potential target, all in one indicator. To adapt to the price and to decrease consecutive trend failures, the internal trend detector algorithm studies the market and dynamically chooses the right values for the internal parameters. This indicator is a perfect trend filter for any strategy or expert advisor. Features Super Adapti
Candle GAP
Thushara Dissanayake
L'indicatore   Candle GAP   è uno strumento essenziale per i trader che utilizzano   le strategie di Gap Trading   in quanto identifica automaticamente i gap delle candele per ogni giorno della settimana. Un gap si riferisce a una differenza di livello di prezzo tra la chiusura e l'apertura di due giorni consecutivi. Questo indicatore riconosce quattro tipi di modelli di gap: comune, fuga, continuazione ed esaurimento. Incorporando questo indicatore in qualsiasi grafico, i trader possono convali
Gli utenti di questo prodotto hanno anche acquistato
ATTUALMENTE SCONTATO DEL 26% La soluzione migliore per ogni principiante o trader esperto! Questo indicatore è uno strumento di trading unico, di alta qualità e conveniente perché abbiamo incorporato una serie di caratteristiche proprietarie e una nuova formula. Con un solo grafico è possibile leggere la forza delle valute per 28 coppie Forex! Immaginate come migliorerà il vostro trading perché sarete in grado di individuare l'esatto punto di innesco di una nuova tendenza o di un'opportunit
TPSproTREND PrO
Roman Podpora
5 (15)
TPSpro TRENDPRO  - is a trend indicator that automatically analyzes the market and provides information about the trend and each of its changes, as well as giving signals for entering trades without redrawing! The indicator uses each candle, analyzing them separately. referring to different impulses - up or down impulse. Exact entry points into transactions for currencies, crypto, metals, stocks, indices!  -  Version MT5               DETAILED DESCRIPTION        /       TRADING SETUPS           
TPSpro RFI Levels
Roman Podpora
5 (13)
A key element in trading is zones or levels from which decisions to buy or sell a trading instrument are made. Despite attempts by major players to conceal their presence in the market, they inevitably leave traces. Our task was to learn how to identify these traces and interpret them correctly. Reversal First Impulse levels (RFI)   -  Version MT5                INSTRUCTIONS                 RUS                 ENG                                       R ecommended to use with an indicator   -  
Gold Stuff
Vasiliy Strukov
4.89 (250)
Gold Stuff è un indicatore di tendenza progettato specificamente per l'oro e può essere utilizzato anche su qualsiasi strumento finanziario. L'indicatore non ridisegna e non è in ritardo. Periodo consigliato H1. Su di esso l'indicatore funziona in modo completamente automatico Expert Advisor EA Gold Stuff. Lo trovi nel mio profilo. Contattami subito dopo l'acquisto per avere le impostazioni e un bonus personale!   IMPOSTAZIONI Disegna freccia - acceso spento. disegnando frecce sul grafi
Scopri il segreto per il trading Forex di successo con il nostro indicatore MT4 personalizzato! Ti sei mai chiesto come raggiungere il successo nel mercato Forex, guadagnando costantemente profitti minimizzando il rischio? Ecco la risposta che hai cercato! Permettici di presentare il nostro indicatore MT4 proprietario che rivoluzionerà il tuo approccio al trading. Versatilità unica Il nostro indicatore è appositamente progettato per gli utenti che preferiscono le formazioni di candele Ren
FX Power MT4 NG
Daniel Stein
5 (9)
Ricevi il tuo aggiornamento quotidiano sul mercato con dettagli e schermate tramite il nostro Morning Briefing qui su mql5 e su Telegram ! FX Power MT4 NG è la nuova generazione del nostro popolare misuratore di forza delle valute, FX Power. Cosa offre questo misuratore di forza di nuova generazione? Tutto ciò che avete amato dell'FX Power originale IN PIÙ Analisi della forza di ORO/XAU Risultati di calcolo ancora più precisi Periodi di analisi configurabili individualmente Limite di calcolo pe
Presentazione       Quantum Trend Sniper Indicator   , l'innovativo indicatore MQL5 che sta trasformando il modo in cui identifichi e scambi le inversioni di tendenza! Sviluppato da un team di trader esperti con un'esperienza di trading di oltre 13 anni,       Indicatore Quantum Trend Sniper       è progettato per spingere il tuo viaggio di trading verso nuove vette con il suo modo innovativo di identificare le inversioni di tendenza con una precisione estremamente elevata. *** Acquista Quant
Advanced Supply Demand
Bernhard Schweigert
4.92 (310)
CURRENTLY 26% OFF !! Best Solution for any Newbie or Expert Trader! This indicator is a unique, high quality and affordable trading tool because we have incorporated a number of proprietary features and a new formula. With this update, you will be able to show double timeframe zones. You will not only be able to show a higher TF but to show both, the chart TF, PLUS the higher TF: SHOWING NESTED ZONES. All Supply Demand traders will love it. :) Important Information Revealed Maximize the potenti
Scalper Inside PRO
Alexey Minkov
4.7 (56)
SALE NOW! Limited Time Offer! An exclusive indicator that utilizes an innovative algorithm to swiftly and accurately determine the market trend. The indicator automatically calculates opening, closing, and profit levels, providing detailed trading statistics. With these features, you can choose the most appropriate trading instrument for the current market conditions. Additionally, you can easily integrate your own arrow indicators into Scalper Inside Pro to quickly evaluate their statistics and
Presentazione dell'indicatore Miraculous Forex: Libera il potere del trading preciso Sei stanco di cercare il miglior indicatore Forex che fornisca risultati eccezionali su tutti i timeframe? Non cercare oltre! L'indicatore Miraculous Forex è qui per rivoluzionare la tua esperienza di trading e portare i tuoi profitti a nuove vette. Basato su tecnologia all'avanguardia e anni di sviluppo accurato, l'indicatore Miraculous Forex si distingue come l'apice di potenza e precisione nel mercato delle v
Advanced Currency IMPULSE with ALERT
Bernhard Schweigert
4.91 (494)
ATTUALMENTE SCONTATO DEL 31%! La soluzione migliore per ogni principiante o trader esperto! Questo indicatore è uno strumento di trading unico, di alta qualità e conveniente perché abbiamo incorporato una serie di caratteristiche proprietarie e una formula segreta. Con un solo grafico fornisce avvisi per tutte le 28 coppie di valute. Immaginate come migliorerà il vostro trading perché sarete in grado di individuare l'esatto punto di innesco di una nuova tendenza o opportunità di scalping!
Attualmente 20% di sconto! La soluzione migliore per ogni principiante o trader esperto! Questo software per cruscotti funziona su 28 coppie di valute. Si basa su 2 dei nostri indicatori principali (Advanced Currency Strength 28 e Advanced Currency Impulse). Offre un'ottima panoramica dell'intero mercato Forex. Mostra i valori di forza delle valute avanzate, la velocità di movimento delle valute e i segnali per 28 coppie Forex in tutti i (9) timeframe. Immaginate come migliorerà il vostro t
PZ Harmonacci Patterns
PZ TRADING SLU
3.43 (7)
This is arguably the most complete harmonic price formation auto-recognition indicator you can find for the MetaTrader Platform. It detects 19 different patterns, takes fibonacci projections as seriously as you do, displays the Potential Reversal Zone (PRZ) and finds suitable stop-loss and take-profit levels. [ Installation Guide | Update Guide | Troubleshooting | FAQ | All Products ] It detects 19 different harmonic price formations It plots primary, derived and complementary Fibonacci pro
FX Volume
Daniel Stein
4.6 (35)
Ricevi il tuo aggiornamento quotidiano sul mercato con dettagli e schermate tramite il nostro Morning Briefing qui su mql5 e su Telegram ! FX Volume è il PRIMO e UNICO indicatore di volume che fornisce una visione REALE del sentiment del mercato dal punto di vista del broker. Fornisce informazioni straordinarie su come gli operatori di mercato istituzionali, come i broker, sono posizionati sul mercato Forex, molto più velocemente dei rapporti COT. Vedere queste informazioni direttamente sul vo
TrendMaestro
Stefano Frisetti
5 (2)
nota: questo indicatore e' per METATRADER4, se vuoi la versione per  METATRADER5 questo e' il link:  https://www.mql5.com/it/market/product/108123 TRENDMAESTRO riconosce un nuovo TREND sul nascere, non sbaglia mai. La sicurezza di identificare un nuovo TREND non ha prezzo. DESCRIZIONE TRENDMAESTRO identifica un nuovo TREND sul nascere, questo indicatore prende in esame la volatilita' i volumi ed il momentum per identificare il momento in cui c'e' un'esplosione di uno  opiu' di questi dati
GOLD Impulse with Alert
Bernhard Schweigert
4.56 (9)
Questo indicatore è una super combinazione dei nostri 2 prodotti Advanced Currency IMPULSE with ALERT  +   Currency Strength Exotics . Funziona per tutti i time frame e mostra graficamente l'impulso di forza o debolezza per le 8 valute principali più un simbolo! Questo indicatore è specializzato nel mostrare l'accelerazione della forza delle valute per qualsiasi simbolo come oro, coppie esotiche, materie prime, indici o futures. Primo nel suo genere, qualsiasi simbolo può essere aggiunto
Quantum Breakout Indicator PRO
Bogdan Ion Puscasu
4.96 (26)
Presentazione       Quantum Breakout PRO   , l'innovativo indicatore MQL5 che sta trasformando il modo in cui scambi le zone di breakout! Sviluppato da un team di trader esperti con un'esperienza di trading di oltre 13 anni,   Quantum Breakout PRO   è progettato per spingere il tuo viaggio di trading a nuovi livelli con la sua strategia innovativa e dinamica della zona di breakout. Quantum Breakout Indicator ti fornirà frecce di segnalazione sulle zone di breakout con 5 zone target di prof
Innanzitutto, è importante sottolineare che questo sistema di trading è un indicatore non repainting, non redrawing e non lagging, il che lo rende ideale per il trading professionale. Il "Sistema di Trading di Supporto e Resistenza Intelligente" è un indicatore avanzato progettato per trader nuovi ed esperti. Permette ai trader di ottenere precisione e fiducia sul mercato forex. Questo sistema completo combina più di 7 strategie, 10 indicatori e varie approcci di trading, tra cui strategie di
Price Action Entry Alerts
Stephen Sanjeeve Sahayam
5 (3)
Questo indicatore controlla ogni barra per la pressione di acquisto o vendita e identifica 4 tipi di modelli di candele con il volume più alto. Queste candele vengono quindi filtrate utilizzando diversi filtri lineari per mostrare segnali di acquisto o vendita. I segnali funzionano meglio, in combinazione con una direzione temporale più elevata e quando scambiati durante le ore ad alto volume. Tutti i filtri sono personalizzabili e funzionano in modo indipendente. Può visualizzare i segnali di
Master Pullback
TDINVEST LLP
5 (3)
- 50% OFF - Telegram group : https://t.me/+5RIceImV_OJmNDA0 MT5 version : https://www.mql5.com/en/market/product/85917?source=Site+Market+Product+Page Master Pullback is a complete system that gives unique trading opportunities and a clear indication of the market: trend, signals as well as stop loss and take profit levels. This system has been designed to be as simple as possible and detects extreme overbought and oversold zones, support and resistance levels, as well as the major trend. You
Indicator : RealValueIndicator Description : RealValueIndicator is a powerful tool designed specifically for trading on the EURUSD pair. This indicator analyzes all EUR and USD pairs, calculates their real currency strength values, and displays them as a single realistic value to give you a head start on price. This indicator will tell you moves before they happen if you use it right. RealValueIndicator allows you to get a quick and accurate overview of the EURUSD currency pair tops and bottoms,
Reversal Sniper
Elmira Memish
5 (3)
Reversal Sniper is designed to find the extreme reversals of the price. Indicator collects data of Cycle Sniper Indicator. NOTE: REVERSAL SNIPER Indicator is made for Cycle Sniper Users as an additional tool.  However, it can be used by the traders who look for finding out strong reversal levels. Indicator works on all timeframes and all instruments. Reversal  Sniper  Checks: Harmonic Patterns RSI Zig Zag and Harmonic Swings Cycle Sniper Indicator's Buy / Sell Signals The complex algo i
Entry Points Pro
Yury Orlov
4.7 (225)
Indicatore top per MT5 che fornisce segnali accurati per entrare in un trade senza riverniciare! Può essere applicato a qualsiasi attività finanziaria: forex, criptovalute, metalli, azioni, indici.  La versione MT5 è qui Fornirà segnali di trading piuttosto precisi e ti dirà quando è meglio aprire un trade e chiuderlo. Guarda il video (6:22) con un esempio di elaborazione di un solo segnale che ha ripagato l'indicatore! La maggior parte dei trader migliora i propri risultati di trading
This indicator provides the ability to recognize the SMC pattern, essentially a condensed version of the Wyckoff model. Once the pattern is confirmed by RTO, it represents a significant investment opportunity.    There are numerous indicators related to SMC beyond the market, but this is the first indicator to leverage patterns to identify specific actions of BigBoy to  navigate the market. Upgrade 2024-03-08: Add TP by RR feature. The SMC (Smart Money Concept)   pattern   is a market analysis m
XPointer
Andrey Kozak
5 (3)
XPointer is a completely ready trading system. It shows the trader when to open and close a trade. It works on all currency pairs and all time frames. Very easy to use and does not require additional indicators for its operation. Even a beginner trader can start working with XPointer. But it will also be useful for professional traders to confirm the opening of orders. Features of the XPointer indicator It does not redraw its values. It works on all currency pairs and all time frames. It has a
Up down v6T
Guner Koca
5 (1)
Thise indicator is up down v6  comes with tradingwiev version. purchased people, after installed on terminal ,contact me on mql5  to get BONUS  TradingView version. up-down indicator is no repaint and works all pairs and lower than weekly time frames charts. it is suitable also 1 m charts for all pairs. and hold long way to signal. dont gives too many signals. when red histogram cross trigger line that is up signal.and price probably will down when blue histogram cross trigger line that is dow
Royal Scalping Indicator M4
Vahidreza Heidar Gholami
4.17 (6)
Royal Scalping Indicator is an advanced price adaptive indicator designed to generate high-quality trading signals. Built-in multi-timeframe and multi-currency capabilities make it even more powerful to have configurations based on different symbols and timeframes. This indicator is perfect for scalp trades as well as swing trades. Royal Scalping is not just an indicator, but a trading strategy itself. Features Price Adaptive Trend Detector Algorithm Multi-Timeframe and Multi-Currency Trend Low
Quantum Heiken Ashi PRO MT4
Bogdan Ion Puscasu
4.43 (7)
Presentazione del       Grafici   Quantum Heiken Ashi PRO Progettate per fornire informazioni chiare sulle tendenze del mercato, le candele Heiken Ashi sono rinomate per la loro capacità di filtrare il rumore ed eliminare i falsi segnali. Dì addio alle confuse fluttuazioni dei prezzi e dai il benvenuto a una rappresentazione grafica più fluida e affidabile. Ciò che rende il Quantum Heiken Ashi PRO davvero unico è la sua formula innovativa, che trasforma i dati tradizionali delle candele in barre
XQ Indicator MetaTrader 4
Marzena Maria Szmit
3 (2)
Step into the realm of Forex trading with confidence and precision using XQ, a cutting-edge Forex indicator designed to elevate your trading game to unprecedented heights. Whether you're a seasoned trader or just stepping into the world of currency exchange,   XQ Forex Indicator   empowers you with the insights and signals needed to make informed trading decisions. The signal conditions are a combination of three indicators, and XQ Forex Indicator only display  medium and long-term trends . The
Royal Wave Pro M4
Vahidreza Heidar Gholami
5 (3)
Royal Wave is a Trend-Power oscillator which has been programmed to locate and signal low-risk entry and exit zones. Its core algorithm statistically analyzes the market and generates trading signals for overbought, oversold and low volatile areas. By using a well-designed alerting system, this indicator makes it easier to make proper decisions regarding where to enter and where to exit trades. Features Trend-Power Algorithm Low risk Entry Zones and Exit Zones Predictions for Overbought and Over
Altri dall’autore
The indicator displays the key support and resistance levels on the chart. The significance of these levels lies in that the price may reverse or strengthen the movement when passing such levels, since they are formed as a consequence of the natural reaction of market participants to the price movement, depending on which positions they occupied or did not have time to occupy. The psychology of the level occurrence: there always those who bought, sold, hesitated to enter or exited early. If the
Scalper Assistant MT5
Pavel Verveyko
3.67 (3)
The indicator is a trading system for short-term trading. Scalper Assistant helps to determine the direction of the transaction, and also shows the entry and exit points. The indicator draws two lines (possible points for opening positions). At the moment of the breakdown of the upper line up (and when all trading conditions are met), an up arrow appears (a buy signal), as well as 2 goals. At the moment of the breakdown of the lower line down (and when all trading conditions are met), a do
Trend Sync
Pavel Verveyko
5 (2)
The indicator shows the trend of 3 timeframes: higher timeframe; medium timeframe; smaller (current) timeframe, where the indicator is running. The indicator should be launched on a chart with a timeframe smaller than the higher and medium ones. The idea is to use the trend strength when opening positions. Combination of 3 timeframes (smaller, medium, higher) allows the trend to be followed at all levels of the instrument. The higher timeframes are used for calculations. Therefore, sudden change
Turn
Pavel Verveyko
The indicator shows the market turning points (entry points). Reversals allow you to track rebound/breakout/testing from the reverse side of the lines of graphical analysis or indicators. Reversals can be an independent signal. The indicator allows you to determine reversals taking into account the trend and without it. You can choose a different period for the movement preceding the reversal, as well as the volatility coefficient. When plotting reversals, the indicator takes into account vola
Length Movement
Pavel Verveyko
5 (2)
Measures the length of the selected movement in points, shows the duration of the movement, as well as the speed of movement.   Outputs the average value of each dimension. It is designed to calculate the expected target based on typical market movements. The intended goal will provide information about the ratio of the stop size to the possible profit and will allow you not to open positions with a small expected profit. It will also help you determine the point at which it is more logical t
The indicator allows you to quickly switch from one instrument to another, from one time period to another using the keyboard or buttons on the monitor. Each command can be assigned a hot key from 0-9, a-Z (case-insensitive) and VK_OEM_COMMA ("<" on the keyboard) and VK_OEM_PERIOD (">" on the keyboard). This can help you to operate the maximum number of instruments that are available at your broker, analyze more instruments/periods in less time. This product cannot be tested in the tester , beca
Ratio TP SL
Pavel Verveyko
5 (1)
This indicator allows you to measure the profitability of each specific transaction (the ratio of Stop and Profit). The indicator allows you to adjust the ratio by step size and number of steps. You can build an unlimited number of ratios to compare the risks from different movements. Note: in MT4, the number of horizontal lines in a single ratio cannot exceed 32. Building a line : click the " Ratio " button and draw a line (mouse click - the first point of the line, where the mouse is relea
Corporate Report
Pavel Verveyko
5 (1)
The script displays info about the share's corporate reports and dividends. The data is downloaded from   investing.com : Report date Profit per share (EPS) Revenue Market capitalization Amount of dividends Date of payment of dividends Dividend income The product cannot be tested in the tester (since it is not possible to receive data from the Internet). Before launching:  Add 2   URL   https://ru.investing.com/earnings-calendar/Service/getCalendarFilteredData  and   https://ru.investing.com/
Channel FTF
Pavel Verveyko
5 (2)
The Envelopes indicator determines the presence of a trend or flat. It has 3 types of signals, shows the probable retracement levels and levels of the possible targets. The Fibonacci coefficients are used in the indicator's calculations. Signals (generated when touching the lines or rebounding from lines): Trend - the middle line of the Envelopes has a distinct inclination; the lines below the channel's middle line are used for buy trades, the lines above the middle line and the middle line itse
Mr Big
Pavel Verveyko
The indicator shows and highlights the chart candles, which are formed as a result of large players entering the market in large volumes. Such candles can also be formed after achieving a certainty on the market, when most of the participants hold positions in the same direction. The movement is likely to continue in that direction after such candles. The indicator highlights the significant candles from the existing ones on the chart; The indicator allows identifying the trends based on candles
Splash
Pavel Verveyko
The indicator identifies the most suitable moment for entering the market in terms of market volatility, when the market has the strength to move (the signal is indicated by an arrow under the candle). For each of the signals, the presence of trends on the current and higher timeframes is determined, so that the signal is in the direction of the majority of positions opened on the market (denoted near the signal by abbreviations of timeframes with a trend present). The signal appears after the c
The indicator displays the key support and resistance levels on the chart. The significance of these levels lies in that the price may reverse or strengthen the movement when passing such levels, since they are formed as a consequence of the natural reaction of market participants to the price movement, depending on which positions they occupied or did not have time to occupy. The psychology of the level occurrence: there always those who bought, sold, hesitated to enter or exited early. If the
This indicator is a multitimeframe trading strategy. It has the levels for stop loss, take profit and entry point. The order level can also be set manually. The indicator uses the regularity of the market, which manifests itself on all instruments, and does not require adjustment of the parameters. The strategy uses a proprietary approach to determining: trend, volatility, hierarchy of timeframe significance, the size of the history period (the number of candles), which is important for making a
The indicator detects important peaks and troughs (extremes) on the chart. These points can be used to plot support/resistance levels and trend lines, as well as any other graphical analysis. These points can serve as reference points for setting trading orders. The indicator does not redraw . Settings: Size_History  - the size of the calculated history. Num_Candles_Right  - number of candles to the right of the peak or trough. Num_Candles_Left  - number of candles to the left of the pea
Running along Lines
Pavel Verveyko
3.67 (3)
The indicator draws support and resistance lines on an important part of the chart for making decisions. After the trend line appears, you can trade for a breakout or rebound from it, as well as place orders near it. Outdated trend lines are deleted automatically. Thus, we always deal with the most up-to-date lines. The indicator is not redrawn . Settings: Size_History  - the size of the calculated history. Num_Candles_extremum  - the number of candles on each side of the extremum. Type_Ar
Key Volumes
Pavel Verveyko
1 (1)
The indicator shows key volumes confirmed by the price movement. The indicator allows you to analyze volumes in the direction, frequency of occurrence, and their value. There are 2 modes of operation: taking into account the trend and not taking into account the trend (if the parameter Period_Trend = 0, then the trend is not taken into account; if the parameter Period_Trend is greater than zero, then the trend is taken into account in volumes). The indicator does not redraw . Settings Histo
This trading system is based on market impulses of varying complexity.   To generate a signal, the indicator uses the moments when the direction of the pulse and the necessary section of the trend coincide. The indicator also takes into account the current market volatility. Stop_loss tags can be set with the parameter "0" or "1", then Stop_Loss will take into account market volatility.   Take_Profit tags can be set with the parameter "0", then Take_Profit will take into account market volat
Indexes
Pavel Verveyko
The stocks that make up the index are one of the drivers of the movement. Analyzing the financial performance of all elements of the index, we can assume further development of the situation. The program (script) displays corporate reports of shares that are part of the index selected in the settings.   "Indexes" cannot be tested in the tester (since there is no way to get information from the Internet). Information is downloaded from the site investing.com: Report Date Earnings per share
Fibo World
Pavel Verveyko
The indicator builds a graphical analysis based on the Fibonacci theory. Fibo Fan is used for the analysis of the impulses and corrections of the movement. Reversal lines (2 lines at the base of the Fibonacci fan) are used to analyze the direction of movements. The indicator displays the of 4 the target line in each direction. The indicator takes into account market volatility. If the price is above the reversal lines, it makes sense to consider buying, if lower, then selling. You can op
The indicator determines the state of the market: trend or flat. The state of the market is determined by taking into account volatility. The flat (trading corridor)is displayed in yellow. The green color shows the upward trend. The red color shows the downward trend. The height of the label corresponds to the volatility in the market. The indicator does not redraw . Settings History_Size   - the amount of history for calculation. Period_Candles  - the number of candles to calculate the
The indicator plots flexible support and resistance levels (dots). A special phase of movement is used for construction. Levels are formed dynamically, that is, each new candle can continue the level or complete it. The level can provide resistance or support to the price even where it is no longer there. Also, support and resistance levels can change roles. The importance of levels is affected by: the amount of time the level is formed and the number of touches. The significance of these l
The indicator is a trading system for short-term trading. Scalper Assistant helps to determine the direction of the transaction, and also shows the entry and exit points. The indicator draws two lines (possible points for opening positions). At the moment of the breakdown of the upper line up (and when all trading conditions are met), an up arrow appears (a buy signal), as well as 2 goals. At the moment of the breakdown of the lower line down (and when all trading conditions are met), a do
Gold n XAU
Pavel Verveyko
The trading system is designed to work with gold on time periods: 30M, 1H. The indicator allows you to adjust to the market situation. Parameters for 1H :   PERIOD=9F ,   FILTER=300 .   Parameters for  30M :   PERIOD=22B ,   FILTER=450 .   A small adjustment to a specific broker is allowed .   If you change the amount of history displayed, you may also need to adjust the parameters. The indicator is not redrawn.     "Gold n XAU" uses different rules for entering a trade and different ru
The indicator determines the most important component of any trading system - the possible exit point from the transaction. As the price moves, depending on the market situation, the indicator builds goals. The target becomes relevant when the price starts moving towards the target. If the movement is strong, then it may take a certain number of targets to stop or reverse price. The accumulation of targets is most likely able to stop the price. Some goals are executed several times. But the
The indicator builds "psychological levels": levels of round numbers and intermediate levels of round numbers. Round numbers play an important role in forming support and resistance levels. There is a pattern in which the decline or growth of the price can stop at round numbers. The level whose price ends at 0 is the level of a round number of the first order. Intermediate level, this is the level between two round levels, for example, between 10 and 20 this is level 15. In the " Num_Zero
Ichimoku Map
Pavel Verveyko
Ichimoku Map (instant look at the markets) - built on the basis of the legendary Ichimoku Kinko Hyo indicator. The task of the Ichimoku Map is to provide information about the market strength on the selected time periods and instruments, from the point of view of the Ichimoku indicator. The indicator displays 7 degrees of buy signal strength and 7 degrees of sell signal strength. The stronger the trend, the brighter the signal rectangle in the table. The table can be dragged with the mouse. T
The indicator displays a stock chart of a non-standard type, in which the price and time have the same value. The usual chart of Japanese candlesticks does not take into account all the information that the time analysis can give. Renko charts do not use all the information that price can give in relation to time. The "Chart Price and Time" indicator takes into account price and time equally and shows the predominance of price or time. Taking into account price and time equally gives an i
The indicator tracks sharp volatility (moments when the market has shown increased activity and movement may occur), on the selected instruments and time periods. The information is displayed as colored rectangles. Thus, it is possible to assess at a glance which tool should be given priority attention. The indicator will be useful for scalpers when they need a quick reaction or for traders working with a large number of instruments. The indicator does not redraw. The indicator displays 8 degr
Target Trainer
Pavel Verveyko
This program is designed to test ideas and acquire analytical skills. The main task of the analyst is to be able to predict the direction and range on the chart, where the price should soon come. This product cannot be tested in the tester. All the functionality is shown in full in the description and screenshots. How it works : Situations for analysis are selected at random. (The more historical data, the greater the number of examples). Click " Start Game ". Between the orange vertical li
The Alert Creator indicator is designed to create alerts for selected conditions. You can select one or several indicators for the notification. If several conditions are selected, the alert is triggered when all the selected conditions are met. The signals can be configured separately for buying and separately for selling. Example, a buy alert: the closing price is above the moving average, the RSI is below 20. (In this example, 2 indicators are used to generate an alert: MA and RSI) At
Filtro:
Nessuna recensione
Rispondi alla recensione
Versione 1.1 2021.10.24
Changed the default color