• Panoramica
  • Recensioni (6)
  • Commenti (10)
  • Novità

Aggression Volume Profile

4.4

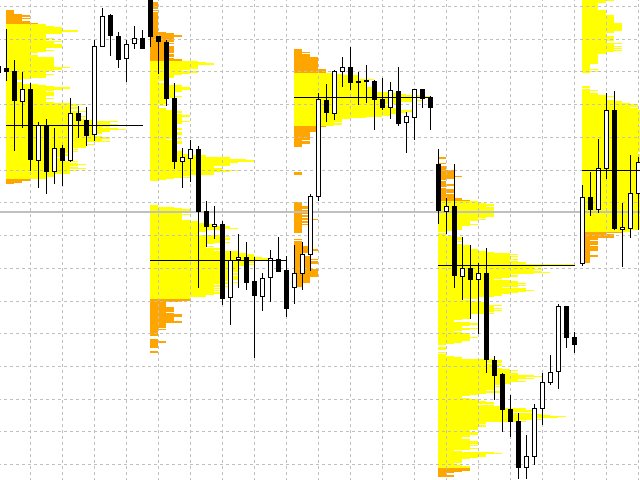
This indicator plots the volume profile by Price on the chart


There are 5 ways to view it:

  1. By Total Volume Traded;
  2. Volume Ticks(Forex)
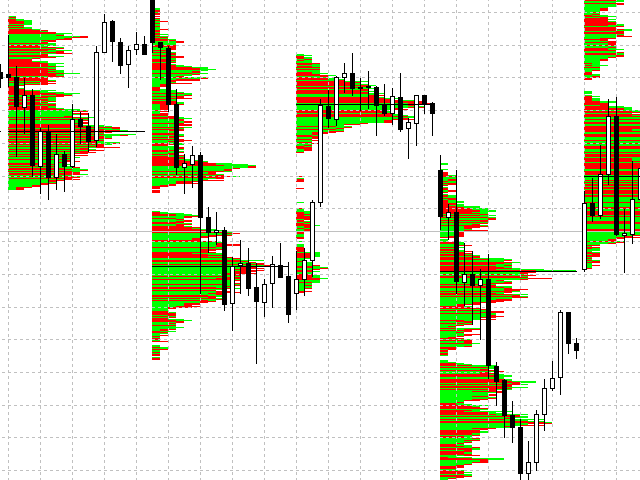
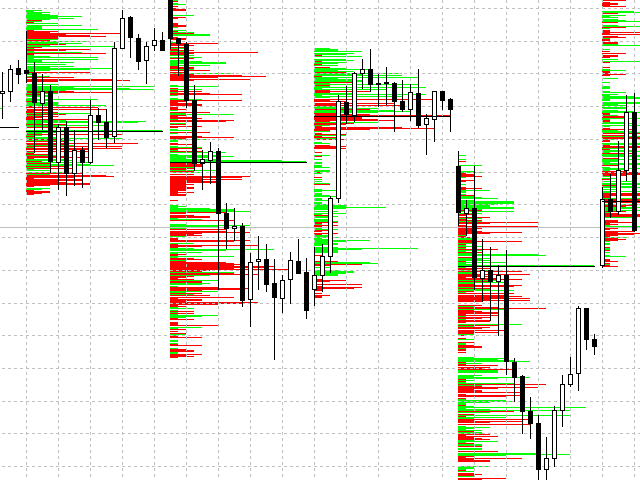
  3. Separated by Buyers and Sellers;
  4. Buyers Only;
  5. Sellers Only and;
  6. Business balance (Buyers - Sellers).

It is possible to select how many days the profiles will be calculated.


On the current day it recalculates the histogram data for each new candlestick.


Another feature is to select the highest trading range by entering the desired percentage.


The indicator also allows you to select the colors of the profiles.


Know our Products


Follow us on our website.


Edson Cavalca Junior
Systems Analyst


NOTICE:

You need trading information (Time and Sales).


Recensioni 6
August Tetteh
1208
August Tetteh 2024.04.25 12:35 
 

great

ArekJP
34
ArekJP 2024.01.11 20:51 
 

good job!

Andrew_ft
74
Andrew_ft 2023.06.06 11:29 
 

Very good!! Light,works very good not like others indicators tested. If there were the possibility to change the time calculate it will be greater! (for example 1week,4h,1h,30m,15m)

Prodotti consigliati
Market Profile 3 ForexArby com
Hussien Abdeltwab Hussien Ryad
4.17 (12)
Market Profile 3 MetaTrader 5 indicator  version 4.70— is a classic Market Profile implementation that can show the price density over time, outlining the most important price levels, value area, and control value of a given trading session. This indicator can be attached to timeframes between M1 and D1 and will show the Market Profile for daily, weekly, monthly, or even intraday sessions. Lower timeframes offer higher precision. Higher timeframes are recommended for better visibility. It is als
FREE
Value Chart Candlesticks
Flavio Javier Jarabeck
4.67 (9)
The idea of a Value Chart indicator was presented in the very good book I read back in 2020 , " Dynamic Trading Indicators: Winning with Value Charts and Price Action Profile ", from the authors Mark Helweg and David Stendahl. The idea is simple and the result is pure genius: Present candlestick Price analysis in a detrended way! HOW TO READ THIS INDICATOR Look for Overbought and Oversold levels. Of course, you will need to test the settings a lot to find the "correct" one for your approach.
FREE
This indicator will mirror the assets in use in another metatrader, being able to choose the timeframe and a template. This is the Metatrader 5 Client, it needs the Metatrader 4 or 5 Server versions: Metatrader 4 Mirror Chart Server:   https://www.mql5.com/en/market/product/88644 Metatrader 5 Mirror Chart Server: https://www.mql5.com/en/market/product/88652 Details of how it works in the video.
FREE
Show Pips for MT5
Roman Podpora
4.61 (18)
This information indicator will be useful for those who always want to be aware of the current situation on the account. - More useful indicators The indicator displays data such as profit in points, percentage and currency, as well as the spread for the current pair and the time until the bar closes on the current timeframe. There are several options for placing the information line on the chart: - To the right of the price (runs behind the price); - As a comment (in the upper left corner
FREE
High Low Open Close
Alexandre Borela
4.97 (36)
Se ti piace questo progetto, lascia una recensione a 5 stelle. Seguire su instagram: borelatech Questo indicatore disegna i prezzi aperti, alti, bassi e di chiusura per i specificati periodo e può essere regolato per un determinato fuso orario. Questi sono livelli importanti guardati da molti istituzionali e professionali commercianti e può essere utile per voi per conoscere i luoghi dove potrebbero essere più attivo. I periodi disponibili sono: Giorno precedente. Settimana precedente. Me
FREE
Aggression Volume
Flavio Javier Jarabeck
3.8 (20)
Aggression Volume Indicator is the kind of indicator that is rarely found in the MQL5 community because it is not based on the standard Volume data provided by the Metatrader 5 platform. It requires the scrutiny of all traffic Ticks requested on the platform... That said, Aggression Volume indicator requests all Tick Data from your Broker and processes it to build a very special version of a Volume Indicator, where Buyers and Sellers aggressions are plotted in a form of Histogram. Additionally,
FREE
VP hidden
Emr Aljnaby
5 (4)
The indicator works to convert normal volume into levels and determine financial liquidity control points. It is very similar in function to Fixed Volume Profile. But it is considered more accurate and easier to use than the one found on Trading View because it calculates the full trading volumes in each candle and in all the brokers present in MetaTrade, unlike what is found in Trading View, as it only measures the broker’s displayed prices. To follow us on social media platforms: tel
FREE
Indicator measures strength of each currency in your list. Main idea: It simply iterates through all combinations of pairs and adds difference between open and close in percent. Parameters: List of currencies - what currencies will be calculated (maximum is 8) Calculation type - from which data will be strength calculated Calculation data input - used as input related to calculation type Symbol suffix - used in case of suffix on symbols, e.g: when your symbols look like EURUSDm, EURUSDmicro et
FREE
Il Matrix Arrow Indicator Multi Timeframe Panel MT5 è un componente aggiuntivo gratuito e una grande risorsa per il tuo Matrix Arrow Indicator MT5 . Mostra l'attuale segnale Matrix Arrow Indicator MT5 per 5 timeframe personalizzati dall'utente e per 16 simboli/strumenti modificabili in totale. L'utente ha la possibilità di abilitare/disabilitare uno qualsiasi dei 10 indicatori standard di cui è composto il Matrix Arrow Indicator MT5 . Anche tutti i 10 attributi degli indicatori standard sono re
FREE
Cumulative Delta MT5
Evgeny Shevtsov
4.47 (57)
The indicator analyzes the volume scale and splits it into two components - seller volumes and buyer volumes, and also calculates the delta and cumulative delta. The indicator does not flicker or redraw, its calculation and plotting are performed fairly quickly, while using the data from the smaller (relative to the current) periods. The indicator operation modes can be switched using the Mode input variable: Buy - display only the buyer volumes. Sell - display only the seller volumes. BuySell -
FREE
Momentum Reversal
Grigorii Matsnev
4 (1)
Momentum Reversal è un potente strumento per rilevare possibili punti di inversione e iniziare la correzione, basato sull'analisi dell'intensità dei movimenti dei prezzi e delle formazioni di barre. _________________________________ Come utilizzare i segnali dell'indicatore: L'indicatore forma un segnale dopo la comparsa di una nuova barra dei Prezzi. Si consiglia di utilizzare il segnale generato dopo aver rotto il prezzo del punto critico nella direzione specificata. L'indicatore non ri
FREE
This indicator is especially for the binary trading. Time frame is 1 minutes and exp time 5 or 3 minutes only. You must be use martingale 3 step. So you must put lots size is 10 % at most. You should use Mt2 trading platform to connect with my indicator to get more signal without human working. This indicator wining rate is over 80% but you may get 100% of profit by using martingale 3 step. You should use MT2 Trading Platform to connect meta trader platform and binary platform . You can get mt2
FREE
Il Catturatore di Tendenza: La Strategia del Catturatore di Tendenza con Indicatore di Allarme è uno strumento versatile di analisi tecnica che aiuta i trader a identificare le tendenze di mercato e i potenziali punti di ingresso e uscita. Presenta una Strategia dinamica del Catturatore di Tendenza, adattandosi alle condizioni di mercato per una chiara rappresentazione visiva della direzione della tendenza. I trader possono personalizzare i parametri in base alle loro preferenze e tolleranza
FREE
Bollinger Bands Percentage
Emanuel Cavalcante Amorim Filho
Bollinger Bands %  or Bollinger Bands Percentage is one of the indicators used in the Sapphire Strat Maker - EA Builder . It is calculated using the following formula: Perc = (CLOSE_PRICE - LOWER_BOLLINGER) / (UPPER_BOLLINGER - LOWER_BOLLINGER) * 100 Thus, by taking the difference between closing price to the lower band and dividing it by the difference of the upper and the lower price levels of a Bollinger Bands indicator, we can calculate this indicator. It shows how far the price is f
FREE
Weis Waves
Flavio Javier Jarabeck
3.15 (26)
The original author is David Weis, an expert in the Wyckoff Method. The Weis Wave is a modern adaptation of the 1930's Wyckoff Method, another expert in Tape Reading techniques and Chart Analysis. Weis Waves takes market volume and stacks it into waves according to price conditions giving the trader valuable insights about the market conditions. If you want to learn more about this subject you can find tons of videos in YouTube. Just look for "The Wickoff Method", "Weis Wave" and "Volume Spread
FREE
TradeInfo MT5
Manuraj Dhanda
4 (3)
TradeInfo is a utility indicator which displays the most important information of the current account and position. Displayed information: Information about the current account (Balance, Equity, Free Margin). Current spread, current drawdown (DD), planned profit, expected losses, etc. Number of open position(s), volume (LOT), profit. Today’s and yesterday’s range. Remaining time to the next candle. Last day profit information. MagicNumber filter. Comment filter. Indicator parameters: Show
FREE
BoxInside MT5
Evgeny Shevtsov
5 (4)
This indicator calculates the volume profile and places labels that correspond to the VAH, VAL and POC levels, for each candle individually. Indicator operation features The indicator works on the timeframes from M3 to MN, but it uses the history data of smaller periods: M1 - for periods from M3 to H1, M5 - for periods from H2 to H12, M30 - for the D1 period, H4 - for the W1 period, D1 - for the MN period. The color and location of the VAL, VAH and POC labels on the current candle are consider
FREE
DALA Forecast
Grigorii Matsnev
About the indicator: DALA Forecast is a universal tool for predicting the dynamics of time series of any nature. For prediction, modified methods of nonlinear dynamics analysis are used, on the basis of which a predictive model is built using machine learning methods.  To get the trial version of the indicator, you can contact me in private messages. How to use the indicator: Apply the indicator to your chosen financial instrument or indicator with the settings you need. The prediction will b
FREE
LT Donchian Channel
Thiago Duarte
4.75 (4)
Donchian Channel is an indicator created by Richard Donchian. It is formed by taking the highest high and the lowest low of the last specified period in candles. The area between high and low is the channel for the chosen period. Its configuration is simple. It is possible to have the average between the upper and lower lines, plus you have alerts when price hits one side. If you have any questions or find any bugs, please contact me. Enjoy!
FREE
Double Correlation indicator (free) plots two windowed correlations in a separate window.  the size of window is taken as input before the two symbols to correlate to. Two symbols are taken as an input parameters as well as period length. and the two correlations are computed with the currently shown symbol ex: input GBPJPY and AUDNZD.  current symbol EURUSD then the following will be computed corr(EURUSD,GBPJPY) and corr(EURUSD,AUDNZD) The indicator can be useful to run a multi-symbol pair trad
FREE
Exact Neuron Genuine Algo Genius Engaged
Toha Arekaatera Akutina Gage
3.67 (3)
!! THE FIRST FREE NEURAL NETWORK EA WITH EXCELLENT AND REALISTIC RESULTS.!! Another beautiful work of art, guys you don't know the powerful creations that are created by my developer Nardus Van Staden. Check him out guys and gals, he is the real deal, an amazing person and a professional when it comes to coding and business, if you want work done!, hit him up! you can get in contact with him HERE . THE FOLLOWING PRODUCT IS A FREE VERSION OF A PAID VERSION THAT IS TO COME, PROFITS ARE GOING TO
FREE
TradeQL
Abdiel Aviles Jimenez
The TradeQL Indicator is a customizable tool that highlights specific trading patterns on candlestick charts. Users can define patterns through TradeQL queries, which the indicator then applies to the chart, visually representing matches and captured groups. Ideal for identifying complex trade setups in real-time. TradeQL queries are specified using the TradeQL Language. See https://github.com/abdielou/tradeql for more details. This language is expressed as a regular expression. The language a
FREE
AngryVolumes
Stanislav Korotky
This indicator emulates volume delta (buy trades vs sell trades) based on per candle volume and candle shape (direction, size of body and wicks). Artificially separated buy and sell volumes then accumulated for specified number of bars. The indicator shows a histogram of volume delta per bar, as well as a sum of the delta for the given period. What is more important, the indicator allows you to combine current symbol quotes/volumes with quotes/volumes of other related symbols (futures, indices,
FREE
Bar Countdown
Mario Antonio Oliveira
4.8 (5)
Bar Countdown is a simple indicator for MetaTrader 5 that shows the time remaining of the each candle. It can be placed in any corner of the chart or near of the price close and it'll help you to know if the current candle is ending. Choose the counter format between HR:MIN:SEC and MIN:SEC It is so easy to use, configure the color, size and counter position on the chart and that's it!!! The Countdown starts now! Updates: 2021/02/28; v1.0: Initial release 2021/03/16; v1.1: Minor code changes
FREE
The indicator plots a curve of the difference between the values ​​of two trading instruments (currency pairs). The purpose of the indicator is to observe the processes of divergence and convergence of the values ​​of two trading instruments. The results obtained can be used for trading strategies of statistical arbitrage, pair trading, correlation, and others. Trading strategy The indicator is attached to the chart of any trading instrument. In the input parameters, the names of trading i
FREE
Seconds Charts Demo
Aleksandr Goryachev
5 (1)
Micro  Demo  ******************* Секундные графики в Meta Trader 5 ********************** Более точного инструмента для входа в сделку вы не найдёте. Платная полная версия:  Micro "Second charts" В демоверсии секундные периоды сменяются случайным образом через случайные интервалы времени. Отсутствует автоматическая настройка периодов бесплатных индикаторов.   Входные параметры: Displayed bars - отображаемые бары Step of price levels, pp, 0-off - шаг отрисовки ценовых уровней, пункты Scale
FREE
RSI Currencies MT5
Fabio Cavalloni
5 (1)
RSI Currencies is an indicator that is based on the RSI concept but with a totally different approach. It calculates its values calculating all RSI values of all pairs related to the same currency and making an average between them: the goal is to obtain a more solid and trustable information about what each currency are doing lowering the impact of market noise and extreme euphory on a particular pair to analyze the whole basket. It works on 28 forex majors and minor pairs related to these curr
FREE
Harmonic Hybrid
Clemence Benjamin
Volume and RSI-based sniper entry signals for Boom and Crash synthetics feature robust entry alert systems. For more advanced filter signals, consider the Harmonic Hybrid Pro. When trading spikes, three orders are strategically placed to manage risk, with the third order positioned close to the highest probability of a spike. Signals are no longer valid fifteen minutes after the final order, and any losses should be closed promptly. For take profit (Tp), it is advisable to exit shortly after a s
FREE
MW Volume
Martin Bittencourt
4 (5)
The Martinware Volume indicator plots a colored moving average over volume bars. The coloring uses three colors and can be done in different ways choosable by the user and is applied both to the average as to the volume bars. Three types of coloring are possible: None: no coloring is done Increasing or decreasing: changes the color depending on the current value being bigger or lesser than the previous one Volume relative to average: colors vary if the current volume is bigger or lesser then
FREE
This indicator show Gann Swing Chart (One Bar) with multi layer wave. 1. Wave layer   F1: Gann waves are drawn based on candles. SGann wave(Swing of Gann) is drawn based on Gann wave of wave layer   F1. 2. Wave layer F2: Is a Gann wave drawn based on the SGann wave of wave layer F1. SGann waves are drawn based on Gann waves of wave layer   F2. 3. Wave layer F3: Is a Gann wave drawn based on the SGann wave of wave layer F2. SGann waves are drawn based on Gann waves of wave layer   F3. ---------Vi
FREE
Gli utenti di questo prodotto hanno anche acquistato
Innanzitutto è importante sottolineare che questo sistema di trading è un indicatore Non-Repainting, Non-Redrawing e Non-Lagging, il che lo rende ideale sia per il trading manuale che per quello automatico. Il "Sistema di Trading Smart Trend MT5" è una soluzione completa pensata sia per i trader principianti che per quelli esperti. Combina oltre 10 indicatori premium e offre più di 7 robuste strategie di trading, rendendolo una scelta versatile per diverse condizioni di mercato. Strategia di Tre
Atomic Analyst MT5
Issam Kassas
5 (11)
Innanzitutto, vale la pena sottolineare che questo indicatore di trading non è repaint, non è ridisegno e non presenta ritardi, il che lo rende ideale sia per il trading manuale che per quello automatico. L'Analista Atomico è un indicatore di azione del prezzo PA che utilizza la forza e il momentum del prezzo per trovare un miglior vantaggio sul mercato. Dotato di filtri avanzati che aiutano a rimuovere rumori e segnali falsi, e aumentare il potenziale di trading. Utilizzando più strati di in
Quantum Trend Sniper
Bogdan Ion Puscasu
5 (37)
Presentazione       Quantum Trend Sniper Indicator   , l'innovativo indicatore MQL5 che sta trasformando il modo in cui identifichi e scambi le inversioni di tendenza! Sviluppato da un team di trader esperti con un'esperienza di trading di oltre 13 anni,       Indicatore Quantum Trend Sniper       è progettato per spingere il tuo viaggio di trading verso nuove vette con il suo modo innovativo di identificare le inversioni di tendenza con una precisione estremamente elevata. *** Acquista Quant
FX Volume MT5
Daniel Stein
4.94 (17)
Ricevi il tuo aggiornamento quotidiano sul mercato con dettagli e schermate tramite il nostro Morning Briefing qui su mql5 e su Telegram ! FX Volume è il PRIMO e UNICO indicatore di volume che fornisce una visione REALE del sentiment del mercato dal punto di vista del broker. Fornisce informazioni straordinarie su come gli operatori di mercato istituzionali, come i broker, sono posizionati sul mercato Forex, molto più velocemente dei rapporti COT. Vedere queste informazioni direttamente sul vo
Gold Stuff mt5
Vasiliy Strukov
4.89 (166)
Gold Stuff mt5 è un indicatore di tendenza progettato specificamente per l'oro e può essere utilizzato anche su qualsiasi strumento finanziario. L'indicatore non ridisegna e non è in ritardo. Periodo consigliato H1. Contattami subito dopo l'acquisto per avere le impostazioni e un bonus personale!   IMPOSTAZIONI Disegna freccia - acceso spento. disegnando frecce sul grafico. Avvisi: avvisi acustici disattivati. Notifica e-mail - on off. notifiche di posta elettronica. Notifica Puch - on of
Trend Screener Pro MT5
STE S.S.COMPANY
4.89 (61)
Indicatore di tendenza, soluzione unica rivoluzionaria per il trading di tendenze e il filtraggio con tutte le importanti funzionalità di tendenza integrate in un unico strumento! È un indicatore multi-timeframe e multi-valuta al 100% non ridipingibile che può essere utilizzato su tutti i simboli/strumenti: forex, materie prime, criptovalute, indici e azioni. Trend Screener è un indicatore di tendenza che segue un indicatore efficiente che fornisce segnali di tendenza a freccia con punti nel gra
FX Power MT5 NG
Daniel Stein
5 (4)
Ricevi il tuo aggiornamento quotidiano sul mercato con dettagli e schermate tramite il nostro Morning Briefing qui su mql5 e su Telegram ! FX Power MT5 NG è la nuova generazione del nostro popolare misuratore di forza delle valute, FX Power. Cosa offre questo misuratore di forza di nuova generazione? Tutto ciò che avete amato dell'FX Power originale IN PIÙ Analisi della forza di ORO/XAU Risultati di calcolo ancora più precisi Periodi di analisi configurabili individualmente Limite di calcolo pe
Top indicator for MT5   providing accurate signals to enter a trade without repainting! It can be applied to any financial assets:   forex, cryptocurrencies, metals, stocks, indices .  Watch  the video  (6:22) with an example of processing only one signal that paid off the indicator! MT4 version is here It will provide pretty accurate trading signals and tell you when it's best to open a trade and close it. Most traders improve their trading results during the first trading week with the help of
Innanzitutto, vale la pena sottolineare che questo Strumento di Trading è un Indicatore Non-Ridipingente, Non-Ridisegnante e Non-Laggante, il che lo rende ideale per il trading professionale. L'Indicatore Smart Price Action Concepts è uno strumento molto potente sia per i nuovi che per i trader esperti. Racchiude più di 20 utili indicatori in uno solo, combinando idee di trading avanzate come l'Analisi del Trader del Circolo Interno e le Strategie di Trading dei Concetti del Denaro Intelligen
RelicusRoad Pro MT5
Relicus LLC
4.82 (22)
Ora $ 147 (aumentando a $ 499 dopo alcuni aggiornamenti) - account illimitati (PC o MAC) Manuale utente di RelicusRoad + Video di formazione + Accesso al gruppo Discord privato + Stato VIP UN NUOVO MODO DI GUARDARE IL MERCATO RelicusRoad è l'indicatore di trading più potente al mondo per forex, futures, criptovalute, azioni e indici, fornendo ai trader tutte le informazioni e gli strumenti di cui hanno bisogno per rimanere redditizi. Forniamo analisi tecniche e piani di trading per aiutar
Auto Order Block with break of structure based on ICT and Smart Money Concepts Futures Break of Structure ( BoS )             Order block ( OB )            Higher time frame Order block / Point of Interest ( POI )    shown on current chart           Fair value Gap ( FVG ) / Imbalance   ,  MTF      ( Multi Time Frame )    Volume Imbalance     ,  MTF          vIMB Gap’s Equal High / Low’s     ,  MTF             EQH / EQL Liquidity               Current Day High / Low           HOD /
AW Trend Predictor MT5
AW Trading Software Limited
4.76 (55)
La combinazione di trend e livelli di rottura in un unico sistema. Un algoritmo di indicatore avanzato filtra il rumore del mercato, determina la tendenza, i punti di ingresso e i possibili livelli di uscita. I segnali indicatori sono registrati in un modulo statistico, che permette di selezionare gli strumenti più adatti, mostrando l'efficacia dello storico dei segnali. L'indicatore calcola i segni Take Profit e Stop Loss. Manuale e istruzioni ->   QUI   / versione MT4 ->   QUI Come fare tradi
Blahtech Supply Demand MT5
Blahtech Limited
4.57 (14)
Was: $299  Now: $99   Supply Demand uses previous price action to identify potential imbalances between buyers and sellers. The key is to identify the better odds zones, not just the untouched ones. Blahtech Supply Demand indicator delivers functionality previously unavailable on any trading platform. This 4-in-1 indicator not only highlights the higher probability zones using a multi-criteria strength engine, but also combines it with multi-timeframe trend analysis, previously confirmed swings
ICT, SMC, SMART MONEY CONCEPTS, SMART MONEY, Smart Money Concept, Support and Resistance, Trend Analysis, Price Action, Market Structure, Order Blocks, BOS/CHoCH,   Breaker Blocks ,  Momentum Shift,   Supply&Demand Zone/Order Blocks , Strong Imbalance,   HH/LL/HL/LH,    Fair Value Gap, FVG,  Premium  &   Discount   Zones, Fibonacci Retracement, OTE, Buy Side Liquidity, Sell Side Liquidity, BSL/SSL Taken, Equal Highs & Lows, MTF Dashboard, Multiple Time Frame, BigBar, HTF OB, HTF Market Structure
L'indicatore Quadrato di Gann è uno strumento potente di analisi di mercato basato sull'articolo "Formula Matematica per le Previsioni di Mercato" scritto da W.D. Gann. Questo strumento utilizza concetti matematici e teorie di Gann per effettuare un'analisi precisa del mercato. Utilizza i quadrati di 144, 90, 52 e anche il quadrato di 9. Inoltre, integra il metodo del  per il quadrato di 9 e la sua relazione con canali e modelli stellari di quel quadrato. Manuale Utente e Applicazione: Prima di
TPSproTREND PrO MT5
Roman Podpora
5 (5)
TPSpro TRENDPRO  - is a trend indicator that automatically analyzes the market and provides information about the trend and each of its changes, as well as giving signals for entering trades without redrawing! The indicator uses each candle, analyzing them separately. referring to different impulses - up or down impulse. Exact entry points into transactions for currencies, crypto, metals, stocks, indices!  -  Version MT4                  DETAILED DESCRIPTION        /       TRADING SETUPS       
Advanced Supply Demand MT5
Bernhard Schweigert
4.53 (15)
La migliore soluzione per qualsiasi principiante o trader esperto! Questo indicatore è uno strumento di trading unico, di alta qualità e conveniente perché abbiamo incorporato una serie di funzionalità proprietarie e una nuova formula. Con questo aggiornamento, sarai in grado di mostrare fusi orari doppi. Non solo potrai mostrare una TF più alta, ma anche entrambe, la TF del grafico, PIÙ la TF più alta: SHOWING NESTED ZONES. Tutti i trader di domanda di offerta lo adoreranno. :) Informazioni imp
Disegna automaticamente i livelli di supporto e resistenza PIÙ i gap delle candele di propulsione sul vostro grafico, in modo da poter vedere dove il prezzo potrebbe dirigersi successivamente e/o potenzialmente invertire. Questo indicatore è stato progettato per essere utilizzato come parte della metodologia di trading di posizione insegnata sul mio sito web (The Market Structure Trader) e visualizza informazioni chiave per il targeting e le potenziali entrate. MT4 Version:  https://www.mql5.
A key element in trading is zones or levels from which decisions to buy or sell a trading instrument are made. Despite attempts by major players to conceal their presence in the market, they inevitably leave traces. Our task was to learn how to identify these traces and interpret them correctly. Reversal First Impulse levels (RFI)   -  Version MT4                  INSTRUCTIONS                 RUS                 ENG                         R ecommended to use with an indicator   -  TREND PRO  
Il profitto dalla struttura del mercato cambia quando il prezzo si inverte e si ritira. L'indicatore di avviso di inversione della struttura del mercato identifica quando una tendenza o un movimento di prezzo si sta avvicinando all'esaurimento e pronto a invertire. Ti avvisa dei cambiamenti nella struttura del mercato che in genere si verificano quando stanno per verificarsi un'inversione o un forte pullback. L'indicatore identifica inizialmente i breakout e lo slancio del prezzo, ogni volta
Presentazione       Quantum Breakout PRO   , l'innovativo indicatore MQL5 che sta trasformando il modo in cui scambi le zone di breakout! Sviluppato da un team di trader esperti con un'esperienza di trading di oltre 13 anni,       Quantum Breakout PRO       è progettato per spingere il tuo viaggio di trading a nuovi livelli con la sua strategia innovativa e dinamica della zona di breakout. Quantum Breakout Indicator ti fornirà frecce di segnalazione sulle zone di breakout con 5 zone target
TrendLine PRO MT5
Evgenii Aksenov
4.78 (49)
The Trend Line PRO indicator is an independent trading strategy. It shows the trend change, the entry point to the transaction, as well as automatically calculates three levels of Take Profit and Stop Loss protection Trend Line PRO is perfect for all Meta Trader symbols: currencies, metals, cryptocurrencies, stocks and indices Advantages of Trend Line PRO Never redraws its signals The possibility of using it as an independent strategy It has three automatic levels Take Profit and Stop Loss lev
XQ Indicator MetaTrader 5
Marzena Maria Szmit
5 (1)
Step into the realm of Forex trading with confidence and precision using XQ, a cutting-edge Forex indicator designed to elevate your trading game to unprecedented heights. Whether you're a seasoned trader or just stepping into the world of currency exchange, XQ Forex Indicator empowers you with the insights and signals needed to make informed trading decisions. The signal conditions are a combination of three indicators, and XQ Forex Indicator only display  medium and long-term trends . The ind
Trend Line Map Pro MT5
STE S.S.COMPANY
4.67 (9)
Trend Line Map indicator is an addons for   Trend Screener Indicator . It's working as a scanner for all signals generated by Trend screener ( Trend Line Signals ) . It's a Trend Line Scanner based on Trend Screener Indicator.  If you don't have Trend Screener Pro Indicator,   the Trend Line Map Pro will not work.     LIMITED TIME OFFER : Trend Line Map Indicator is available for only 50 $ and lifetime. ( Original price 125$ ) By accessing to our MQL5 Blog,  you can find all our premium indica
TrendDecoder Premium MT5
Christophe, Pa Trouillas
5 (1)
Identificare i range e le prossime mosse probabili     |    Ottenere i primi segnali e la forza delle tendenze     |    Ottenere uscite chiare prima dell'inversione     |    Individuare i livelli di Fibo che il prezzo testerà   |  Indicatore non tracciante e non ritardato - ideale per il trading manuale e automatizzato - adatto a tutti gli asset e a tutte le unità temporali 50% di sconto   - per il lancio poi torna a   >>   149 $ Dopo l'acquisto,   contattatemi su questo canale  per le impostazi
MetaBands M5
Vahidreza Heidar Gholami
4.67 (3)
MetaBands uses powerful and unique algorithms to draw channels and detect trends so that it can provide traders with potential points for entering and exiting trades. It’s a channel indicator plus a powerful trend indicator. It includes different types of channels which can be merged to create new channels simply by using the input parameters. MetaBands uses all types of alerts to notify users about market events. Features Supports most of the channel algorithms Powerful trend detection algorith
Was: $249  Now: $99   Market Profile defines a number of day types that can help the trader to determine market behaviour. A key feature is the Value Area, representing the range of price action where 70% of trading took place. Understanding the Value Area can give traders valuable insight into market direction and establish the higher odds trade. It is an excellent addition to any system you may be using. Inspired by Jim Dalton’s book “Mind Over Markets”, this indicator is designed to suit the
Malaysian SNR Levels
Matthias Horst Pieroth
This indicator can be used to display Support and Resistance levels according to  the  Malaysian SNR concept , in which Support and Resistance are exact levels of a line chart. Malaysian SNR There are 3 different horizontal levels in Malaysian SNR: A-Level : This level is located at the peak of this line chart. (shape looks like the letter A) V-Level : Level at the valley of a line chart, (shape looks like the letter V) Gap-Leve l: This level is located at the Close/Open gap between two cand
Volume by Price MT5
Brian Collard
5 (3)
The Volume by Price Indicator for MetaTrader 5 features Volume Profile and Market Profile TPO (Time Price Opportunity). Get valuable insights out of currencies, equities and commodities data. Gain an edge trading financial markets. Volume and TPO histogram bar and line charts. Volume Footprint charts. TPO letter and block marker charts including split structures. Versatile segmentation and compositing methods. Static, dynamic and flexible ranges with relative and/or absolute visualizations. Lay
ICT Silver Bullet MT5
Haidar, Lionel Haj Ali
5 (19)
ICT Silver Bullet If you are searching for a reliable indicator to trade the ICT Silver Bullet concept, or ICT concepts, Smart Money Concepts, or SMC, this indicator will respond to your need!  Before version 2.2, this indicator was focused only on ICT Silver Bullet, but moving forward, we will include the different elements for smart money concept trading. This indicator will help you identify the following: FVG - fair value gaps Market structure: BOS and CHOCH. It is based on ZIGZAG as it is
Altri dall’autore
Forca Relativa
Edson Cavalca Junior
5 (6)
The robot issues buy/sell signals based on the setting of the RELATIVE STRENGTH INDICATOR Know our products    Review and get a month's rental on any of our paid robots.  This Expert Advisor (EA) works on HEDGE (Forex, etc.) and NETTING (Bovespa, etc.) accounts, but manages only one position at a time. The  filters  are used to increase the accuracy  and if activated and not met your criteria, the order is not sent. 5 FILTERS available: ADX indicator; ADX + (DM +) and - (DM-) direction
FREE
This indicator plots in the candles the divergence found in the selected indicator and can also send a notification by email and / or to the cell phone. Works on all TIMEFRAMES. Meet Our Products   He identifies the divergences in the indicators: Relative Strength Index (RSI); Moving Average Convergence and Divergence (MACD); Volume Balance (OBV) and;. iStochastic Stochastic Oscillator  (STOCHASTIC). It is possible to choose the amplitude for checking the divergence and the indicator has
FREE
The Market Thermometer can be used to help traders identify sleepy or turbulent periods.  It helps beginners to check when is the ideal time to enter operations, that is, when the value of the thermometer is below its average for several periods, identifying a peaceful market.   When the market is heated, that is, the thermometer is above three times its average, it is time to make profits.  The Thermometer measures the extent to which the end of a period, maximum or minimum price, projects out
FREE
Market Thermometer Jr
Edson Cavalca Junior
5 (1)
The Market Thermometer can be used to help traders identify sleepy or turbulent periods. It helps beginners to check when is the ideal time to enter operations, that is, when the value of the thermometer is below its average for several periods, identifying a peaceful market. When the market is heated, that is, the thermometer is above three times its average, it is time to make profits. The Thermometer measures the extent to which the end of a period, maximum or minimum price, projects outsi
FREE
The indicator plots the buying and selling volume on the chart. Two lines are generated corresponding to the average purchase and sale volumes. The crossing of averages, the increase in their distance are good indicators of market movement. Know our products    NOTES : It is recommended to use the default configuration and VPS values.  You need trading information (Time and Sales).   Parameters : Aggression Numbers of days prior to the current one for calculation; Volume Divider e
Three Candles Pattern
Edson Cavalca Junior
5 (1)
The patterns of 3 (three) Candles: Three White Soldiers; Three Black Crows; These are reversal patterns widely used by traders, as they have a high probability of showing the inversion of the current market movement. For example, if in a bullish trend there are three black crows, there is a high probability of reversing the current bullish movement. The Three White Soldiers have the following characteristics: There are 3 consecutive candles with a good body, that is, the difference between
This indicator is based on the system of three moving averages where: First is the fast average (MA1); Second is the intermediate average (MA2) and; T hird is the slow average (MA3). The theory covered in the technical analysis books informs us that when the first average exceeds the second average it is an alert for the trader, however the movement occurs when the second average exceeds the third. The indicator will insert the check s Parameters : Averages : Period Fast Moving Average(FMA); Smo
The indicator measures the accumulated balance of aggression. The formula is as follows:  Accumulated   = Previous Candle Accumulated + Purchase Volume - Sales Volume. Know our products    *** Did you like the product? Then, help us doing review in the " Reviews " tab. The indicator sends information to your email or cell phone when the accumulated balance changes direction. Example : Accumulated seller becomes a buyer. Note : It is recommended to use the default configuration and VPS
Balance Aggression
Edson Cavalca Junior
The indicator measures the balance of aggression. The formula is as follows:   Aggression  = Purchase Volume - Sales Volume. Note : It is rec ommended to use the default configuration and VPS values. It does not work in Forex. Meet Our Products     Parameters : Numbers of days prior to the current one for calculation; Volume Divider e; Enables calculation of the current candle; Histogram Line style and; Size; Line Line style and; Size;  Follow us on our website to check the next new
This indicator plots in the candles the divergence found in the selected indicator and can also send a notification by email and / or to the cell phone. Works on all TIMEFRAMES. Meet Our Products   He identifies the divergences in the indicators: Relative Strength Index (RSI); Moving Average Convergence and Divergence (MACD); Volume Balance (OBV) and;. iStochastic Stochastic Oscillator  (STOCHASTIC). It is possible to choose the amplitude for checking the divergence and the indicator has
ACDO Brasil
Edson Cavalca Junior
The robo t opens a buy or sell position using the signs. Know our products   Position openings are based on the parameters identified as signals, if you activate all the robot will issue a trading order only if the number of signals is greater than the minimum stipulated by the user. The  filters  are used to increase the accuracy of the signals and if activated and not met your criteria, the order is not sent. EA also offers MOBILE STOP with the Parabolic SAR indicator and also by dis
Busque Trade
Edson Cavalca Junior
This indicator looks for SIGNS of Buy and Sell 14 SIGNS: Crossover of 2 moving averages; Crossover of 3 moving averages; RSI Indicator; Stochastic Indicator; Crossing line 0 MACD; Divergence of the RSI indicator; Divergence of the MACD indicator; Divergence of the OBV indicator; Divergence of the STOCHASTIC indicator; Three white soldiers candle pattern; Three black crows candle pattern; Hanging man    candle pattern; Hammer    candle pattern; Rupture Bands Bollinger. The indicator plot
Topos Fundos
Edson Cavalca Junior
The robot opens positions from Tops and Bottoms Perform trend reversal operations. It has 3 levels of top and bottom measurement. Trader can open and close position on 3 strength signals. The expert also allows you to configure the maximum loss to move along with the price (moving stop). Know our products    Edson Cavalca Junior Systems Analyst WARNINGS The buyer declares himself capable of: We do not provide any trading or risk management advice, ideal configurat
Inversao Infinita
Edson Cavalca Junior
This robot operates through triggers above and below the previous candlestick with STOP orders. When reaching the trigger (Stop Order) it opens the order and we have three situations: If it reaches TAKE PROFIT (Maximum Profit) and the Breakeven Point is activated, it moves the STOP LOSS and the reverse STOP ORDER to Breakeven and cancels the reverse STOP order when reaching the TP. If you go to STOP LOSS after reaching breakeven, the trigger of the reverse order will be reached be
Robo Nuvem
Edson Cavalca Junior
The robot uses one of the most used indicators in Asia: * ICHIMOKU CLOUD * There are two trading strategies: Crossing of Tenkan and Kijun lines and; Kumo lines crossing. Know our products    Position openings are based on the parameters identified as signals, if you activate all the robot will issue a trading order only if the number of signals is greater than the minimum stipulated by the user. This Expert Advisor (EA) works on HEDGE (Forex, etc.) and NETTING (Bovespa, etc.) accou
Robo Bandas
Edson Cavalca Junior
The robot uses one of the most known and used indicators in the world BOLLINGER BANDS There are two trading strategies: Upper or Lower Band Break and; Bollinger Band Entry. Know our products    Position openings are based on the parameters identified as signals. This Expert Advisor (EA) works on HEDGE (Forex, etc.) and NETTING (Bovespa, etc.) accounts, but manages only one position at a time. The  filters  are used to increase the accuracy of the signals and if activated and not met
Zona de Trade
Edson Cavalca Junior
The robot operates within pre-configured channels at the beginning of the operation. Use a Demo account or the Strategy Tester to find the best setup for the asset you want to trade. If you have any doubts about handling the robot, send a comment in the "Comments" tab and we will respond and insert you in our private group. Follow the steps below to configure it. After dragging the robot onto the chart, go to "input parameters and configure the following data: Enter th
Robo Sinal Telegram
Edson Cavalca Junior
Send your trades on the Metatrader 5 platform to your Telegram Group! Simple to use, just follow the steps below: Create a group in Telegram and enter the name in the robot parameters; Create a Bot in Telegram with the user BotFather: Send the following message-> /newbot; BotFather will ask for a name for your Bot; Send a message with the desired name; BotFather will ask for a username for your Bot; Send a message with the desired username; BotFather will send the Token; Insert the
Arbitragem B3
Edson Cavalca Junior
1 (1)
Arbitrage Robot IND/WIN or DOL/WDO This arbitrage robot works with WIN and WDO assets from the Brazilian Stock Exchange. The EA compares the best bid and ask (BID and ASK) of the "full" Index (IND) and compares it with the mini-index (WIN) and, if there is a gap between them, the difference in Ticks stipulated in the robot parameters, it opens a trade. It does the same analysis with DOL and WDO. It is necessary to insert the robot in the WIN or WDO chart and it will automa
Arbitragem B3 Acoes
Edson Cavalca Junior
Stock Arbitrage Robot This arbitration robot trades fractional lots of B3 shares. The EA compares the best bid and ask (BID and ASK) of the Share with a standard lot and compares it with that of the share with a fractional lot and if there is a gap between them, in the difference in Ticks stipulated in the robot's parameters, the even open a trade. Example: Insert robot into Petr3F for Gap based trading with Petr3. It is necessary to insert the robot in the Ticker chart wi
Tunel Vegas Sinal
Edson Cavalca Junior
Trader! Don't you want to spend all day on your computer screen looking at quotes? And do you want to receive stock buying/selling tips based on one of the most used indicators in FOREX on your cell phone? Then discover the Vegas Tunnel Support and product questions at the link below: Support This indicator searches for Buy and Sell SIGNALS in Stock Exchange Assets. It works on any asset on the market. Select in the parameters which Fibonacci line the signal will be sent a
Robo Vegas
Edson Cavalca Junior
Robo Vegas The robot's trading signal is given by touching the channels created by a moving average and distanced lines based on the Fibonacci Theory. See the Vegas Tunnel Signal indicator. Parameter configuration can be obtained from Support. Support and product questions at the link below: Support Select in the parameters which Fibonacci line will be used to open positions. You will receive all updates and insertions of new trading signals. Discover our o
Filtro:
August Tetteh
1208
August Tetteh 2024.04.25 12:35 
 

great

Edson Cavalca Junior
18502
Risposta dello sviluppatore Edson Cavalca Junior 2024.04.27 00:36
Thanks!
ArekJP
34
ArekJP 2024.01.11 20:51 
 

good job!

Edson Cavalca Junior
18502
Risposta dello sviluppatore Edson Cavalca Junior 2024.01.11 22:10
Thanks!
sharpie0319
21
sharpie0319 2023.12.19 07:16 
 

For those wanting to try in GOLD, it doesn't work.

Edson Cavalca Junior
18502
Risposta dello sviluppatore Edson Cavalca Junior 2023.12.19 22:54
Hello! It works in gold just choose the Volume Tick option
Andrew_ft
74
Andrew_ft 2023.06.06 11:29 
 

Very good!! Light,works very good not like others indicators tested. If there were the possibility to change the time calculate it will be greater! (for example 1week,4h,1h,30m,15m)

Edson Cavalca Junior
18502
Risposta dello sviluppatore Edson Cavalca Junior 2023.06.08 02:58
Hello! Thanks, i will analyse your suggestion.
wnunes_grafic
14
wnunes_grafic 2022.11.18 04:04 
 

no meu MT5 não funcionou...

Edson Cavalca Junior
18502
Risposta dello sviluppatore Edson Cavalca Junior 2022.12.08 19:07
Olá wnunes_grafic! Esse indicador necessita de Time And Sales, ou seja, funciona apenas em ações e futuros pois esses possuem dados de negociações, em Forex ele não funciona, pois não há disponibilização dos registros de negociações.
ssarabeso
35
ssarabeso 2022.05.17 00:03 
 

works fine.. thank you very much

Edson Cavalca Junior
18502
Risposta dello sviluppatore Edson Cavalca Junior 2022.05.17 00:17
Hello Ssarabeso! Thanks!
Rispondi alla recensione
Versione 2.10 2023.01.31
bugfix
Versione 2.0 2023.01.25
New Exchange Forex included
Versione 1.90 2023.01.24
bugfix
Versione 1.80 2023.01.23
Volume Calculation from Ticks for Forex
Versione 1.70 2021.08.19
bugfix
Versione 1.60 2021.08.19
bugfix
Versione 1.50 2021.08.18
Inserting the balance type information in the balance histogram tooltip
Versione 1.40 2021.08.10
improvement in obtaining data in real time
Versione 1.30 2021.08.04
insert calculation of the volume of the day
Versione 1.20 2021.08.03
bugfix
Versione 1.10 2021.07.30
change precision volume