Drawing Parabolic Channels for MT4
- Indicatori
- BeeXXI Corporation
- Versione: 1.9
- Aggiornato: 21 ottobre 2022
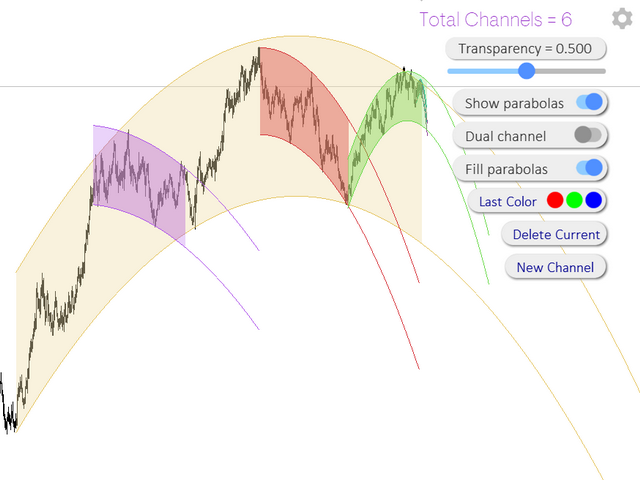
Convenient drawing of parabolic channels by four points (two lower and two upper extremums).
Additional control keys:
- N (New) - Start drawing a new channel.
- C (Clear) - Deletes the current channel.
By default, the current channel is the last channel. But you can click on the line of any channel to make it current.
Click on the gear in the upper right corner to set some parameters for all channels or the current channel.
All work is visible from the animated Gif.
Do not forget to express your wishes and evaluate this product so that this one has a future.
Do not forget to express your wishes and evaluate this product so that this one has a future.


Отличная работа автора! Индикатор прост в работе и построении, легок в понимания. Начинающим и заинтересованным в данной работе, для автоматического построения параболических каналов рекомендую начать с ZigZagus Parabolicus. Николай, большая вам благодарность за новые возможности и взгляды. Успехов и удачи в новых открытиях!!!