Oscillation boundary
- Indicatori
- Mark Nosov
- Versione: 1.0
- Attivazioni: 20
The third indicator from the set for market analysis.
The first one is here: https://www.mql5.com/ru/market/product/65258
The second one is here: https://www.mql5.com/ru/market/product/65347
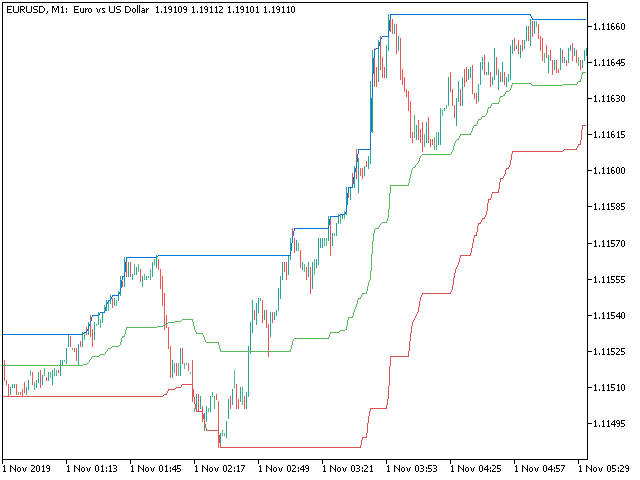
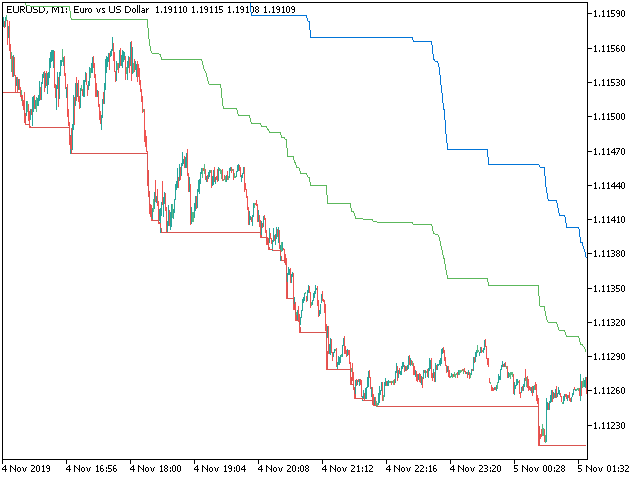
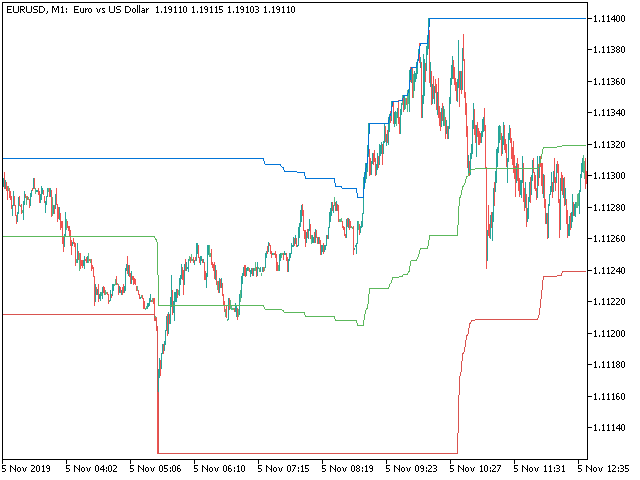
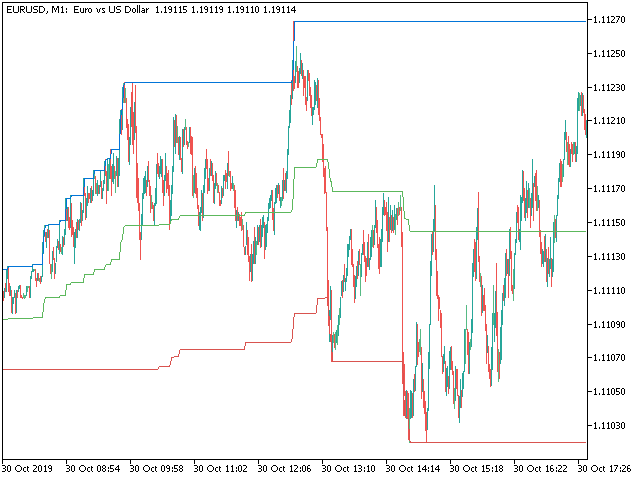
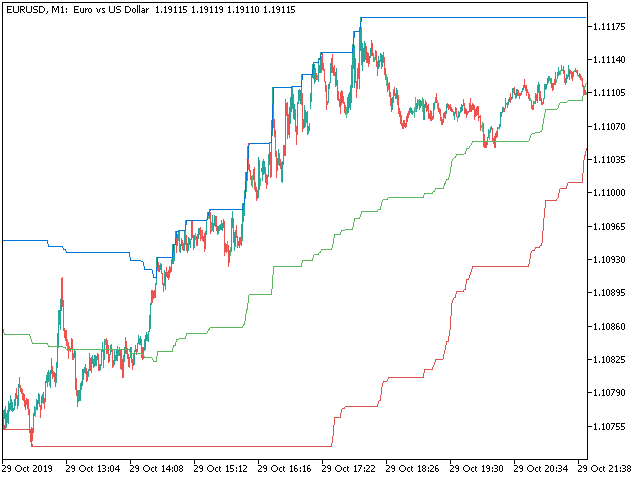
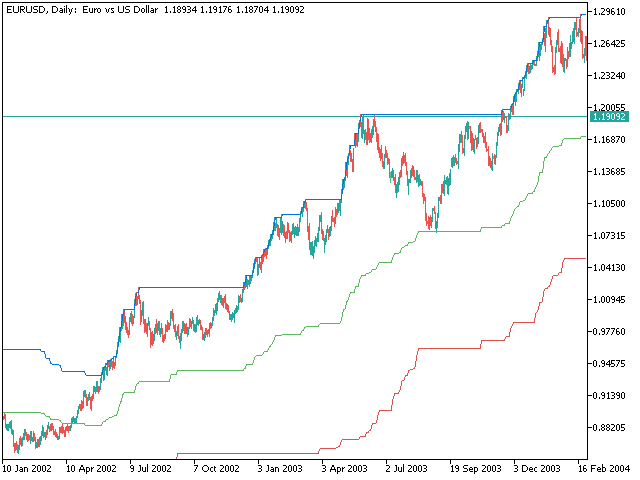
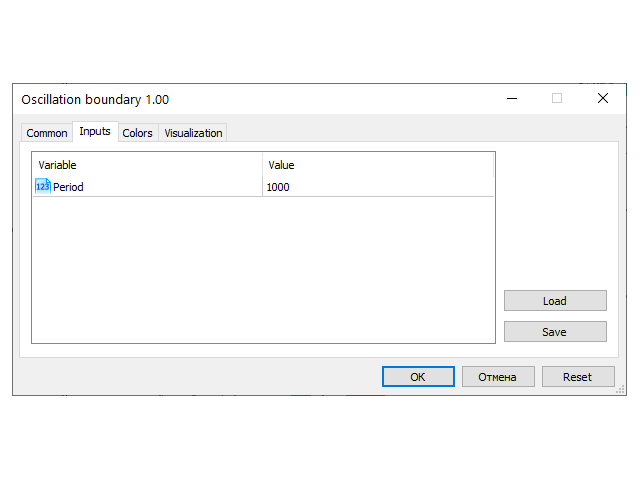
The indicator builds a channel of maximum price fluctuations for a specified period.
Additionally, the middle of the channel is drawn.
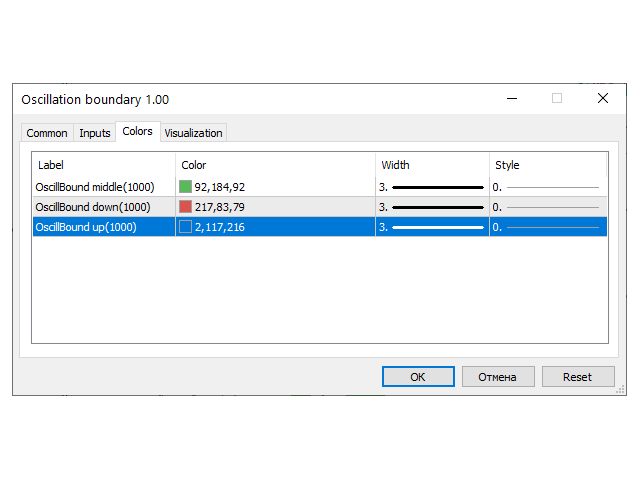
All color settings, line types are customizable.
The indicator allows you to see the picture of price movement from a slightly different angle.
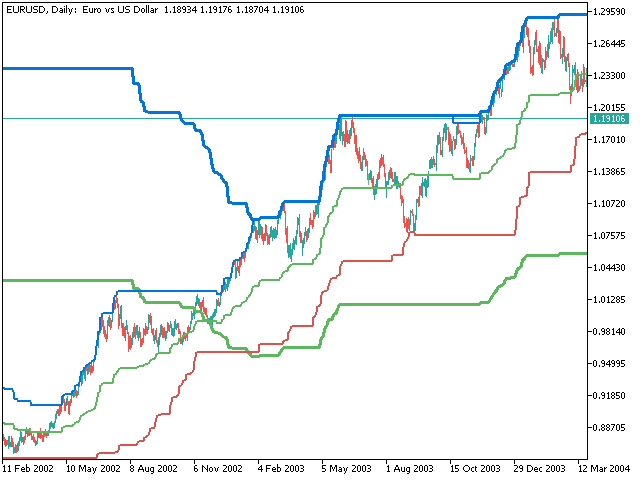
You can use several indicators at the same time with different periods.