• Panoramica
  • Recensioni
  • Commenti (1)
  • Novità

Three Moving Trender

This indicator gives you a modified version of three Moving Averages.

Great for scalping.

Does not feature any alerts, and is best used manually after confirming multi line displays.

Settings:

  • Period1 
  • Period2
  • Period3
  • Period4

How to use:

  • Simply attach to any chart with default settings.
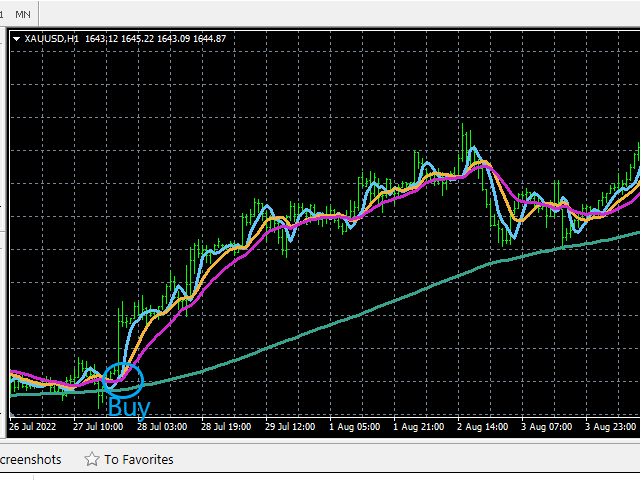
  • Buy when the 4 lines converge below the price.
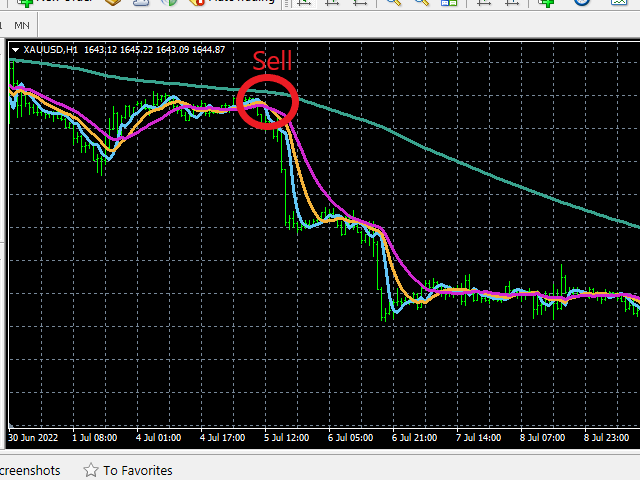
  • Sell when the 4 lines converge above the price.
  • Take note of the slope of Period4.
  • See example pictures below.
  • Best results when looking at three or more time frames, and the three lines have just converged below or above the price.
  • Use as you see fit for your strategy.
  • Best results on Major pairs, but can also be used on other pairs.


Important to note:

  • Please combine this indicator with your other tools for best results.
  • Always test your strategy on a demo account before using a new indicator on a live account.
  • You use this indicator at your own risk.
  • Do not risk money you cannot afford to lose.


Prodotti consigliati
Stepping Trend
Mpendulo Chiliza
The Stepping Trend Indicator     The Steppi ng Trend indicator uses the  average true range  (ATR indicator) in its calculation. This gives you control to set your own average true range period, I set the Default as 10.   Indicator Details. Green Arrow Up: This means you are at the starting point of a new bullish trend, it’s time to buy.   Red  Arrow  Down : This means you are at the starting point of a new  bearish  trend, it’ s time to sell .   What if you miss the Arrow Signal?   No
Sto Signal AM
Andriy Matviyevs'kyy
This indicator displays Stochastic osc signals on the price chart and allows the user to receive notifications of such signals. The Stochastic indicator is a classic and proven indicator of the technical analysis of the markets. Despite its age, it is still relevant today. Depending on the settings, the indicator allows you to work effectively on various TFs and any markets. Signals are given on fully formed bars and are not redrawn. Custom Parameters: Stochastic_Price (0-1) - The applied pric
FREE
Signal trend indicator. Detects the direction of the trend and is coloured accordingly.  Has built in audible and visual alerts when trends change. Can send notifications to your phone or email. Allows Trend and Counter-Trend trading. Works on all timeframes, all currency pairs, metals, indices and cryptocurrencies. Can be used with binary options. Distinctive features No re-drawing; Simple and clear settings; Four types of alerts; Works on all timeframes and all trading tools; Su
[ZhiBiCCI] indicators are suitable for all cycle use, and are also suitable for all market varieties. [ZhiBiCCI] Green solid line is a reversal of bullish divergence. The green dotted line is a classic bullish divergence. [ZhiBiCCI] The solid line to the red is a reverse bearish divergence. The red dotted line is a classical bearish divergence. [ZhiBiCCI] can be set in the parameters (Alert, Send mail, Send notification), set to (true) to send instant signals to the alarm window, email, in
Infinity Trend Pro
Yaroslav Varankin
1 (1)
This is a trend indicator without redrawing Developed instead of the binary options strategy (by the color of the Martingale candlestick) Also works well in forex trading When to open trades (binary options) A signal will appear in the place with a candle signaling the current candle It is recommended to open a deal for one candle of the current timeframe M1 and M5 When a blue dot appears, open a deal up When a red dot appears, open a trade down. How to open trades on Forex. When a signal is rec
Forex Gump
Andrey Kozak
2.4 (5)
Forex Gump is a fully finished semi-automatic trading system. In the form of arrows, signals are displayed on the screen for opening and closing deals. All you need is to follow the instructions of the indicator. When the indicator shows a blue arrow, you need to open a buy order. When the indicator shows a red arrow, you need to open a sell order. Close orders when the indicator draws a yellow cross. In order to get the most effective result, we recommend using the timeframes H1, H4, D1. There
Owl smart levels
Sergey Ermolov
4.34 (35)
Versione MT5  |  FAQ L' indicatore Owl Smart Levels   è un sistema di trading completo all'interno dell'unico indicatore che include strumenti di analisi di mercato popolari come i   frattali avanzati di Bill Williams , Valable ZigZag che costruisce   la corretta struttura a onde   del mercato, e i   livelli di Fibonacci che segnano i livelli esatti di entrata nel mercato e luoghi per prendere profitti. Descrizione dettagliata della strategia Istruzioni per lavorare con l'indicatore Consulente-
Chart Patterns Detect 15 patterns (Ascending Triangle, Descending Triangle, Rising Wedge, Falling Wedge, Bullish Flag, Bearish Flag, Bullish Rectangle, Bearish Rectangle Symmetrical triangle, Head and Shoulders, Inverted Head and Shoulders, Triple top, Triple Bottom, Double Top, Double Bottom) Use historical data to calculate the probability of each pattern to succeed (possibility to filter notification according to the chance of success) gives graphic indication about the invalidation level and
PipFinite Trend PRO
Karlo Wilson Vendiola
4.89 (2359)
Breakthrough Solution For Trend Trading And Filtering With All Important Features Built Inside One Tool! Trend PRO's smart algorithm detects the trend, filters out market noise and gives entry signals with exit levels. The new features with enhanced rules for statistical calculation improved the overall performance of this indicator. Important Information Revealed Maximize the potential of Trend Pro, please visit www.mql5.com/en/blogs/post/713938 The Powerful Expert Advisor Version Automa
VR Cub
Vladimir Pastushak
VR Cub è un indicatore per ottenere punti di ingresso di alta qualità. L'indicatore è stato sviluppato per facilitare i calcoli matematici e semplificare la ricerca dei punti di ingresso in una posizione. La strategia di trading per la quale è stato scritto l'indicatore ha dimostrato la sua efficacia per molti anni. La semplicità della strategia di trading è il suo grande vantaggio, che consente anche ai trader alle prime armi di commerciare con successo con essa. VR Cub calcola i punti di apert
Super Reversal Pattern
Parfait Mujinga Ndalika
Super Reversal Pattern Indicator Unlock the power of advanced pattern recognition with our Super Reversal Pattern Indicator. Designed for traders seeking precision and reliability, this indicator identifies one of the most effective reversal patterns in technical analysis, offering a significant edge in your trading strategy. Key Features: Non-Repainting Accuracy: Enjoy the confidence of non-repainting technology. Once a Super Reversal Pattern is detected, it remains static, providing consis
SRP Pro
Farhad Kia
5 (1)
Strong Retracement Points Pro edition! SRP (Strong Retracement/Reversal Points) is a powerful and unique support and resistance indicator. It displays the closest important levels which we expect the price retracement/reversal! If all level are broken from one side, it recalculates and draws new support and resistance levels, so the levels might be valid for several days depending on the market! If you are still hesitating to start using this wonderful tool, you can check this link to see how ef
Master Scalping M1 è un indicatore innovativo che utilizza un algoritmo per determinare il trend in modo rapido e preciso. L'indicatore calcola il tempo di apertura e chiusura delle posizioni, gli algoritmi dell'indicatore consentono di trovare i momenti ideali per entrare in un trade (acquistare o vendere un asset), il che aumenta il successo delle transazioni per la maggior parte dei trader. Vantaggi dell'indicatore: Facile da usare, non sovraccarica il grafico con informazioni inutili. Può es
PABT Pattern Indicator - it's classical system one of the signal patterns. Indicator logic - the Hi & Lo of the bar is fully within the range of the preceding bar, look to trade them as pullback in trend. In the way if indicator found PABT pattern it's drawing two lines and arrow what showing trend way.  - First line - it's entry point and drawing at: 1. On the high of signal bar or on middle of the signal bar (depending from indicator mode) for buy; 2. On the low of signal bar or on middle of t
DYJ Alligator SignalSource   is based on Alligator   indicator. It can be used for any currency pair and timeframe. The blue line (Alligator's Jaw) is the Balance Line for the timeframe that was used to build the chart (13-period Smoothed Moving Average, moved into the future by 8 bars); Red Line (Alligator's Teeth) is the Balance Line for the value timeframe of one level lower (8-period Smoothed Moving Average, moved by 5 bars into the future); Green Line (Alligator's Lips) is the Balance Line
HMA Trend Professional MT4
Pavel Zamoshnikov
4.57 (7)
Improved version of the free HMA Trend indicator (for MetaTrader 4) with statistical analysis. HMA Trend is a trend indicator based on the Hull Moving Average (HMA) with two periods. HMA with a slow period identifies the trend, while HMA with a fast period determines the short-term movements and signals in the trend direction. The main differences from the free version: Ability to predict the probability of a trend reversal using analysis of history data. Plotting statistical charts for analyz
Trend Monitor
Pavel Zamoshnikov
4 (4)
The indicator generates early signals basing on ADX reading data combined with elements of price patterns. Works on all symbols and timeframes. The indicator does not redraw its signals. You see the same things on history and in real time. For better visual perception signals are displayed as arrows (in order not to overload the chart). Features Easy to use. Filter configuration only requires selection of sensitivity in the " Sensitivity of the indicator " input. Signals can be filtered usin
Cet indicateur innovant de mesure de la force des devises de INFINITY est une aide indispensable pour les scalpers et les commerçants qui négocient à long terme. Le système d'analyse De la force/faiblesse des devises est connu depuis longtemps et utilisé sur le marché par les principaux traders du monde. Tout commerce d'arbitrage n'est pas complet sans cette analyse. Notre indicateur détermine facilement la force des devises sous-jacentes les unes par rapport aux autres. Il affiche des graphiqu
Advanced Trend Regime
Shellard Securities (Pty) Ltd
The indicator has been designed to function on any time-frame and any pair.   This regime filter will help the trader better evaluate whether the current market is trending, and in which direction. It quickly reacts to changes in market dynamics using a series of advanced calculations. The user is able to select whether the calculation remains standard, or if a further filter constraint is added to the calculation.   A Yellow moving average of the signal has been included for the trader to smoot
FXArk Kcci
Nithaam Davis
The KCCi uses a Grid method with a breakeven feature, its based around the CCI and Kijun-Sen of the Ichimoku indicator. Its recommended to be used with a cent account as it requires a high volume of capital along with a broker that allows numerous open positions, along with this low spreads are desired. All major pairs can be traded with this EA, including commodities and on all TFs though before any usage please optimize . IMPORTANT: These parameters will need to be increased to the max o
The Binary Tend Follower indicator has been designed especially for Binary options trading. The best time frame to use the indicator on is a 1M chart with 1Min expiry's as soon as the signal candle closes. There is no need to over complicate your trading as all the thinking has been done for you. The indicator was designed as simple as possible to take out all the subjectivity of trying to follow a complicated strategy, and allowing the trader to focus on extremely simple entry's.  Buy: When th
Forex Indicator "RSI with Dynamic OverSold/OverBought zones" for MT4. RSI is one of the most popular oscillators for trading - very good for Scalping. It is great to take   Sell   entries from   dynamic OverBought zone and   Buy   entries from dynamic OverSold zone RSI oscillator  also  is very useful for divergence detection  This indicator is excellent to combine with Price Action entries from OverSold/Bought areas as well D ynamic   OverBought zone - above yellow line D ynamic   OverSold zo
The Th3Eng PipFinite indicator is based on a very excellent analysis of the right trend direction with perfect custom algorithms. It show the true direction and the best point to start trading. With StopLoss point and Three Take Profit points. Also it show the right pivot of the price and small points to order to replace the dynamic support and resistance channel, Which surrounds the price. And Finally it draws a very helpful Box on the left side on the chart includes (take profits and Stop loss
Indicador Taurus All4
Fabio Oliveira Magalhaes
Taurus All4 Taurus All4 is a high-performance indicator, it will tell you the strength of the trend, and you will be able to observe the strength of the candle. Our indicator has more than 4 trend confirmations. It is very simple and easy to use. Confirmation Modes Candle Trend Confirmations: When the candle switches to light green the trend is high. When the candle switches to light red the trend is reverting down. When the candle changes to dark red the trend is low. Trendline Trend Conf
Distinctive
Tatiana Savkevych
Distinctive is a forex trending arrow indicator for identifying potential entry points. I like it, first of all, because it has a simple mechanism of work, adaptation to all time periods and trading tactics. Created on the basis of a regression channel with filters. Plotting the Lawrence indicator signals on a price function chart using a mathematical approach. How it works - when the price breaks out in the overbought / oversold zone (channel levels), a buy or sell signal is generated. Every
Renko, Heiken Ashi, Ticks Bar, Range Bar.    Easy switching, easy setup, all in one window.        Place the Custom Chart indicator and view Renko, Heiken Ashi, Tick bar, Range bar charts in real time at real chart.    Position the offline chart window so that the indicator control panel is visible.    Switch the chart mode by click of a button.    Connect to the output chart any indicator, expert advisor without any restrictions.    No, it doesn't work in the tester.    Yes, you can use an
For sure, this indicator has become very popular amongst traders. Through coding this indicator will give you the most accurate levels possible for your trading analysis. We have also added in the ability for you to receive alerts when the price breaks above or below a Support or Resistance lines! HOW TO USE The red rectangles represent your resistance/supply zone. The green rectangles represent your support/demand zone.  BONUS FEATURES We coded this indicator with the ability to switch between
The indicator displays the data of the Stochastic oscillator from a higher timeframe on the chart. The main and signal lines are displayed in a separate window. The stepped response is not smoothed. The indicator is useful for practicing "manual" forex trading strategies, which use the data from several screens with different timeframes of a single symbol. The indicator uses the settings that are identical to the standard ones, and a drop-down list for selecting the timeframe. Indicator Parame
Riko Trend
Nadiya Mirosh
The Riko Trend indicator is a revolutionary trend trading and filtering solution with all the important features of a trend tool built into one tool! The Riko Trend indicator is good for any trader, suitable for any trader for both forex and binary options. You don’t need to configure anything, everything is perfected by time and experience, it works great during a flat and in a trend. The Riko Trend indicator is a technical analysis tool for financial markets that reflects the current price
This indicator takes input from the RSI from multiple time frames (M/W/D/H4/H1/M30), and presents the output as lines above or below the price, on the main chart. Great for scalping. Features alerts for the current time frame's RSI (the Arrows). Settings: RSI period settings for M/W/D/H4/H1/M30/Current. (Set to your preference) PSar settings for trend determination; for current chart's time frame. How to use: Simply attach to M5 (Scalping - zoom chart out completely on M5) or use on higher time
Gli utenti di questo prodotto hanno anche acquistato
Gann Made Easy
Oleg Rodin
4.85 (82)
Gann Made Easy è un sistema di trading Forex professionale e facile da usare che si basa sui migliori principi del trading utilizzando la teoria di mr. WD Gann. L'indicatore fornisce segnali ACQUISTA e VENDI accurati, inclusi i livelli di Stop Loss e Take Profit. Puoi fare trading anche in movimento utilizzando le notifiche PUSH. Vi prego di contattarmi dopo l'acquisto! Condividerò i miei consigli di trading con te e fantastici indicatori bonus gratuitamente! Probabilmente hai già sentito parlar
TPSpro RFI Levels
Roman Podpora
4.82 (22)
ISTRUZIONI       RUS   -   INGLESE       Si   consiglia di utilizzare con un indicatore       -       TPSpro   TENDENZA PRO -   Versione MT4         Un elemento chiave nel trading sono le zone o i livelli da cui vengono prese le decisioni di acquisto o vendita di uno strumento di trading. Nonostante i tentativi dei principali attori di nascondere la loro presenza sul mercato, lasciano inevitabilmente delle tracce. Il nostro compito era imparare a identificare queste tracce e interpretarle corre
Trend Punch
Mohamed Hassan
4.95 (19)
This indicator is unstoppable when combined with our other indicator called  Support & Resistance . After purchase, send us a message and you will get it   for  FREE as a BONUS! Introducing Trend Punch , the revolutionary forex trend indicator that will transform the way you trade! Trend Punch is uniquely designed to provide precise buy and sell arrows during strong market trends, making your trading decisions clearer and more confident. Whether you're trading major currency pairs or exotic sym
Gold Stuff
Vasiliy Strukov
4.89 (239)
Gold Stuff è un indicatore di tendenza progettato specificamente per l'oro e può essere utilizzato anche su qualsiasi strumento finanziario. L'indicatore non ridisegna e non è in ritardo. Periodo consigliato H1. Su di esso l'indicatore funziona in modo completamente automatico Expert Advisor EA Gold Stuff. Lo trovi nel mio profilo. I risultati in tempo reale possono essere visualizzati qui.  Puoi ottenere una copia gratuita del nostro indicatore Strong Support e Trend Scanner, per favore scri
TPSproTREND PrO
Roman Podpora
4.79 (19)
TPSpro TREND PRO   è un indicatore di tendenza che analizza automaticamente il mercato, fornisce informazioni sulla tendenza e sui rispettivi cambiamenti e fornisce segnali per entrare nelle operazioni senza ridisegnare. L'indicatore utilizza ciascuna candela e la analizza separatamente. Si riferisce a vari shock al rialzo o al ribasso. Punto di ingresso preciso per il trading di valute, criptovalute, metalli, azioni e indici! Versione MT5                   Descrizione completa dell'indicatore
Atomic Analyst
Issam Kassas
5 (2)
Innanzitutto, vale la pena sottolineare che questo indicatore di trading non è repaint, non è ridisegno e non presenta ritardi, il che lo rende ideale sia per il trading manuale che per quello automatico. Manuale utente: impostazioni, input e strategia. L'Analista Atomico è un indicatore di azione del prezzo PA che utilizza la forza e il momentum del prezzo per trovare un miglior vantaggio sul mercato. Dotato di filtri avanzati che aiutano a rimuovere rumori e segnali falsi, e aumentare il pote
- Real price is 80$ - 40% Discount ( It is 49$ now ) Contact me for instruction, add group and any questions! Related Product:  Bitcoin Expert Introduction The breakout and retest strategy is traded support and resistance levels. it involves price breaking through a previous level.  The break and retest strategy is designed to help traders do two main things, the first is to avoid false breakouts. Many false breakouts start with a candlestick that breaks out of a level but ends with an immediat
MetaBands M4
Vahidreza Heidar Gholami
5 (2)
MetaBands uses powerful and unique algorithms to draw channels and detect trends so that it can provide traders with potential points for entering and exiting trades. It’s a channel indicator plus a powerful trend indicator. It includes different types of channels which can be merged to create new channels simply by using the input parameters. MetaBands uses all types of alerts to notify users about market events. Features Supports most of the channel algorithms Powerful trend detection algorith
Dynamic Forex28 Navigator - Lo strumento di trading Forex di nuova generazione. ATTUALMENTE SCONTATO DEL 49%. Dynamic Forex28 Navigator è l'evoluzione dei nostri indicatori popolari di lunga data, che combinano la potenza di tre in uno: Advanced Currency Strength28 Indicator (695 recensioni) + Advanced Currency IMPULSE con ALERT (520 recensioni) + CS28 Combo Signals (Bonus). Dettagli sull'indicatore https://www.mql5.com/en/blogs/post/758844 Cosa offre l'indicatore di forza di nuova generazion
Scalper Inside PRO
Alexey Minkov
4.73 (56)
An exclusive indicator that utilizes an innovative algorithm to swiftly and accurately determine the market trend. The indicator automatically calculates opening, closing, and profit levels, providing detailed trading statistics. With these features, you can choose the most appropriate trading instrument for the current market conditions. Additionally, you can easily integrate your own arrow indicators into Scalper Inside Pro to quickly evaluate their statistics and profitability. Scalper Inside
Enigmera
Ivan Stefanov
5 (3)
ENIGMERA: Il cuore del mercato https://www.enigmera.com Introduzione Questo indicatore e sistema di trading rappresenta un approccio straordinario ai mercati finanziari. ENIGMERA utilizza i cicli frattali per calcolare con precisione i livelli di supporto e resistenza. Mostra l'autentica fase di accumulazione e fornisce direzione e obiettivi.  Un sistema che funziona sia in un trend che in una correzione.  Come funziona? ENIGMERA è composto da tre linee: la linea di supporto/resistenza, la
Trend Screener
STE S.S.COMPANY
4.8 (87)
Indicatore di tendenza, soluzione unica rivoluzionaria per il trading di tendenze e il filtraggio con tutte le importanti funzionalità di tendenza integrate in un unico strumento! È un indicatore multi-timeframe e multi-valuta al 100% non ridipingibile che può essere utilizzato su tutti i simboli/strumenti: forex, materie prime, criptovalute, indici e azioni. OFFERTA A TEMPO LIMITATO: l'indicatore di screening di supporto e resistenza è disponibile a soli 50$ e a vita. (Prezzo originale 250$) (o
TrendMaestro
Stefano Frisetti
5 (3)
nota: questo indicatore e' per METATRADER4, se vuoi la versione per  METATRADER5 questo e' il link:  https://www.mql5.com/it/market/product/108123 TRENDMAESTRO ver 2.4 TRENDMAESTRO riconosce un nuovo TREND sul nascere, non sbaglia mai. La sicurezza di identificare un nuovo TREND non ha prezzo. DESCRIZIONE TRENDMAESTRO identifica un nuovo TREND sul nascere, questo indicatore prende in esame la volatilita' i volumi ed il momentum per identificare il momento in cui c'e' un'esplosione di uno 
FX Power MT4 NG
Daniel Stein
5 (12)
Ricevi il tuo aggiornamento quotidiano sul mercato con dettagli e schermate tramite il nostro Morning Briefing qui su mql5 e su Telegram ! FX Power MT4 NG è la nuova generazione del nostro popolare misuratore di forza delle valute, FX Power. Cosa offre questo misuratore di forza di nuova generazione? Tutto ciò che avete amato dell'FX Power originale IN PIÙ Analisi della forza di ORO/XAU Risultati di calcolo ancora più precisi Periodi di analisi configurabili individualmente Limite di calcolo pe
Attualmente 20% di sconto! La soluzione migliore per ogni principiante o trader esperto! Questo software per cruscotti funziona su 28 coppie di valute. Si basa su 2 dei nostri indicatori principali (Advanced Currency Strength 28 e Advanced Currency Impulse). Offre un'ottima panoramica dell'intero mercato Forex. Mostra i valori di forza delle valute avanzate, la velocità di movimento delle valute e i segnali per 28 coppie Forex in tutti i (9) timeframe. Immaginate come migliorerà il vostro t
FX Volume
Daniel Stein
4.58 (33)
Ricevi il tuo aggiornamento quotidiano sul mercato con dettagli e schermate tramite il nostro Morning Briefing qui su mql5 e su Telegram ! FX Volume è il PRIMO e UNICO indicatore di volume che fornisce una visione REALE del sentiment del mercato dal punto di vista del broker. Fornisce informazioni straordinarie su come gli operatori di mercato istituzionali, come i broker, sono posizionati sul mercato Forex, molto più velocemente dei rapporti COT. Vedere queste informazioni direttamente sul vo
Bomb Bank Signal
Igor Pereira Calil
5 (1)
Segnale bancario bomba: il tuo indicatore di fiducia in MetaTrader 4 Bomb Bank Signal è un potente indicatore per MetaTrader 4, progettato per identificare le tendenze più rilevanti nel mercato finanziario. Se cerchi uno strumento che anticipi con precisione i movimenti, la Bomb Bank è l'alleato di cui hai bisogno. Come funziona: Questo indicatore combina tre metodi distinti – analisi del volume, chiusura delle candele e trend simmetrico – per rilevare e segnalare opportunità di acquisto
Stratos Pali Indicator   is a revolutionary tool designed to enhance your trading strategy by accurately identifying market trends. This sophisticated indicator uses a unique algorithm to generate a complete histogram, which records when the trend is Long or Short. When a trend reversal occurs, an arrow appears, indicating the new direction of the trend. Important Information Revealed Leave a review and contact me via mql5 message to receive My Top 5 set files for Stratos Pali at no cost! D
L'indicatore Chart Patterns All-in-One aiuta i trader a visualizzare vari modelli di grafici comunemente utilizzati nell'analisi tecnica. Questo indicatore supporta l'identificazione dei possibili comportamenti del mercato, ma non garantisce la redditività. Si consiglia di testare l'indicatore in modalità demo prima dell'acquisto. Offerta attuale : 50% di sconto sull'indicatore "Chart Patterns All in One". Modelli inclusi : Modello 1-2-3 : Rileva inversioni di mercato utilizzando tre punti chiav
TakePropips Donchian Trend Pro
Eric John Pajarillaga Aldana
4.44 (16)
TakePropips Donchian Trend Pro   (MT4) è uno strumento potente ed efficace che rileva automaticamente la direzione del trend utilizzando il canale Donchian e ti fornisce segnali di trading di entrata e uscita! Questo indicatore multifunzione include uno scanner di tendenza, segnali di trading, pannello statistico, screener, sessioni di trading e dashboard della cronologia degli avvisi. È progettato per fornirti segnali di trading e farti risparmiare ore analizzando i grafici! È possibile scarica
Supply and Demand Dashboard PRO
Bernhard Schweigert
4.8 (20)
Attualmente 20% di sconto! Questo cruscotto è un software molto potente che lavora su più simboli e fino a 9 timeframe. Si basa sul nostro indicatore principale (migliori recensioni: Advanced Supply Demand ).   Il cruscotto offre un'ottima panoramica. Mostra:    Valori filtrati di domanda e offerta, compresa la valutazione della forza delle zone, distanze dei pip da/all'interno delle zone, Evidenzia le zone annidate, Fornisce 4 tipi di allarmi per i simboli scelti in tutti i (9) time-frames
ATTUALMENTE SCONTATO DEL 26% La soluzione migliore per ogni principiante o trader esperto! Questo indicatore è uno strumento di trading unico, di alta qualità e conveniente perché abbiamo incorporato una serie di caratteristiche proprietarie e una nuova formula. Con un solo grafico è possibile leggere la forza delle valute per 28 coppie Forex! Immaginate come migliorerà il vostro trading perché sarete in grado di individuare l'esatto punto di innesco di una nuova tendenza o di un'opportunit
Innanzitutto, vale la pena sottolineare che questo Strumento di Trading è un Indicatore Non-Ridipingente, Non-Ridisegnante e Non-Laggante, il che lo rende ideale per il trading professionale. Corso online, manuale utente e demo. L'Indicatore Smart Price Action Concepts è uno strumento molto potente sia per i nuovi che per i trader esperti. Racchiude più di 20 utili indicatori in uno solo, combinando idee di trading avanzate come l'Analisi del Trader del Circolo Interno e le Strategie di Trading
Currency Strength Wizard è un indicatore molto potente che ti fornisce una soluzione all-in-one per un trading di successo. L'indicatore calcola la potenza di questa o quella coppia forex utilizzando i dati di tutte le valute su più intervalli di tempo. Questi dati sono rappresentati in una forma di indice di valuta facile da usare e linee elettriche di valuta che puoi utilizzare per vedere il potere di questa o quella valuta. Tutto ciò di cui hai bisogno è collegare l'indicatore al grafico che
Market Reversal Alerts
LEE SAMSON
4.19 (113)
Il profitto dalla struttura del mercato cambia quando il prezzo si inverte e si ritira. L'indicatore di avviso di inversione della struttura del mercato identifica quando una tendenza o un movimento di prezzo si sta avvicinando all'esaurimento e pronto a invertire. Ti avvisa dei cambiamenti nella struttura del mercato che in genere si verificano quando stanno per verificarsi un'inversione o un forte pullback. L'indicatore identifica inizialmente i breakout e lo slancio del prezzo, ogni volta
IX Power MT4
Daniel Stein
5 (5)
IX Power porta finalmente l'imbattibile precisione di FX Power ai simboli non-Forex. Determina con precisione l'intensità delle tendenze a breve, medio e lungo termine dei vostri indici preferiti, azioni, materie prime, ETF e persino criptovalute. Potete analizzare tutto ciò che il vostro terminale ha da offrire. Provatelo e sperimentate come il vostro tempismo migliori significativamente durante il trading. Caratteristiche principali di IX Power Risultati di calcolo precisi al 100% e n
ATTUALMENTE SCONTATO DEL 31%! La soluzione migliore per ogni principiante o trader esperto! Questo indicatore è uno strumento di trading unico, di alta qualità e conveniente perché abbiamo incorporato una serie di caratteristiche proprietarie e una formula segreta. Con un solo grafico fornisce avvisi per tutte le 28 coppie di valute. Immaginate come migliorerà il vostro trading perché sarete in grado di individuare l'esatto punto di innesco di una nuova tendenza o opportunità di scalping!
Trend Cutter
Oleg Rodin
5 (2)
Trend Cutter è un indicatore di tendenza che può essere utilizzato con qualsiasi intervallo di tempo, inclusi gli intervalli di tempo inferiori come M1 e M5. L'indicatore è ideale per i trader che preferiscono il trading intraday e sarà utile anche per coloro che preferiscono il trading a lungo termine. Puoi utilizzare questo indicatore come base per il tuo sistema di trading o come soluzione di trading autonoma. L'indicatore fornisce tutti i tipi di avvisi, comprese le notifiche PUSH. L'indicat
Questa dashboard è uno strumento di avviso da utilizzare con l'indicatore di inversione della struttura del mercato. Il suo scopo principale è avvisarti di opportunità di inversione su intervalli di tempo specifici e anche di ripetere i test degli avvisi (conferma) come fa l'indicatore. Il dashboard è progettato per essere posizionato su un grafico da solo e funzionare in background per inviarti avvisi sulle coppie e sui tempi scelti. È stato sviluppato dopo che molte persone hanno richiesto un
Trend Pulse
Mohamed Hassan
5 (4)
Please contact me after purchase to immediately get your PDF strategy + documentation for Trend Pulse !  Introducing Trend Pulse , a unique and robust indicator capable of detecting bullish, bearish, and even ranging trends! Trend Pulse uses a special algorithm to filter out market noise with real precision. If the current symbol is moving sideways, Trend Pulse will send you a ranging signal, letting you know that it's not a good time to enter a trade. This excellent system makes Trend Pulse
Altri dall’autore
Trend Radar Chart Tracker
Natasha Diedericks
4 (1)
Easily track and trade with the trend using this indicator. Uses a circle and line to indicate the trend direction. Excellent for channels. Features alert function. Parameter TrendPeriod can be changed to your preference. How to use: Simply attach to any chart. Blue circle plus blue line cross below price = Buy. Red circle plus red line  cross above price = Sell. Best results when taking higher time frames into consideration before entering a trade. (Hint: Wait for the radar/circle to appear on
FREE
This indicator takes input from the ADX from multiple time frames (M/W/D/H4/H1), and presents the output on the main chart. Great for scalping. Features alert for current chart's ADX. TrendLine period setting. How to use: Simply attach to any chart. User can set the period for ADX(Monthly, Weekly, Daily, H4, H1,Current chart) Zoom chart out completely. Hover over the lines to see the time frame applicable. Buy when Multi ADX below price; also blue dots and white line below price. Sell when Mul
This indicator uses a special algorithm to plot the 4 lines for trading. Great for scalping. Does not feature any alerts and is best used manually after confirming the line displays. No need to set up the indicator. How to use: Attach to any chart. Can be used on any time frame. If used on lower time frames, check higher time frames for confirmation. Buy : - Wait for green and white lines to be above the level 50 dotted line, then open buys. - Buy when the green line crosses below the white line
Price Trender mt4
Natasha Diedericks
This indicator uses a special algorithm to plot the 4 lines for trading. Great for scalping. Features alerts. Settings for trend filters. How to use: Simply attach to any chart with default settings. Buy when the three pink lines converge below the green line. Sell when the three pink lines converge above the green line. Best results when looking at three or more time frames, and the three blue lines have just converged below or above the green line. Use as you see fit for your strategy. Best r
ZigZag Bullets
Natasha Diedericks
5 (1)
This indicator takes input from the ZigZag and ADX indicators, combined with a special trend algorithm. You also get a Moving Average on the chart to determine trend direction. Great for scalping. Perfect for channels. Features alert functions. BulletPeriod. Parameter TrendLinePeriod for the MA line. Change to your preference. Try 200. How to use: Simply attach to any chart. Sell on red bullets, with red MA line above price. Enter on bullets closest to this line. Buy on blue bullets, with blue
Trend Alligator
Natasha Diedericks
5 (1)
This indicator takes input from the Alligator indicator. Great for scalping. Great for identifying new trends. This indicator can be used on all time frames and pairs. Features alert functions. Parameters: Alerts JawsPeriod JawsShift TeethPeriod TeethShift LipsPeriod LipsShift How to use: Simply attach to any chart with default settings. Sell when all 3 red lines cross above white line. Buy when all 3 blue lines cross below white line. Best results when checking the higher time frames (3 or
Trend SR
Natasha Diedericks
This indicator takes input from Support and Resistance levels, combined with a special trend filter. Easily spot tops and bottoms, and trade with more confidence. Great for scalping or long-term trading. This indicator can be used on all time frames and pairs. Features alert function. No need to set up the indicator. How to use: Simply attach to any chart. Red histogram line color = Selling opportunities. Blue histogram line color = Buying opportunities. See pictures below. To spot highs/tops
SR Arrows
Natasha Diedericks
This indicator gives you arrows, two SR lines and a white trend line. Uses a special trend algorithm to plot the arrows, combined with support and resistance inputs. Perfect for channel trading. Features alert functions. Parameter TrendArrowPeriod. Parameter TrendLinePeriod. (Change to your preference) How to use: Simply attach to any chart with default settings. Zoom in the chart, to see the two blue SR lines and arrows more clearly. It is very important to wait for a new blue SR line to appea
MTF Moving Trender
Natasha Diedericks
This indicator displays a modified version of Moving Averages for multiple time frames: Current (TF indicator is attached to), M5, M15, M30, H1, H4, Daily, Weekly and Monthly. NB: Make sure to download currency history before testing and use. No need to set up the indicator. Features an audible alert function for the current chart's line. How to use: Simply attach to M5 chart. Hover over the lines to see the line's time frame. Buy when more than two MTF lines cross closely together below the pri
ZigZag Sniper
Natasha Diedericks
This indicator gives you a modified ZigZag, combined with a special algorithm. Great for scalping. Perfect for channel trading. Parameter TrendPeriod. Features alert functions.  How to use: Simply attach to any chart with default settings. Buy when the line crosses below the price, and blue arrow. Sell when the line crosses above the price, and red arrow. It helps to keep the audible alert set to true. Best results when checking two or more timeframes before entering trades. (See comment #1 for
This indicator gives you PSar crossings in the form of blue and yellow dots on the chart, as well as a Moving Average. Parameters: MAPeriod (Change to your preference) Alerts PSarStep PSarShift PSarMaximum How to use: Simply attach to any chart with default settings. Sell on yellow dots, with white MA line above price.  Buy on blue dots, with white MA line below price. Best results when checking the higher time frames before entering trades. Best results on Major Pairs, but can also be used on o
MTF PSar Trender
Natasha Diedericks
This indicator gives you the PSars for multiple time frames: M1, M5, M15, M30, H1, H4, Daily, Weekly, Monthly. Features Alert function for current Psar. Good results on M5. How to use: Download M1 history for testing. Hover over the different colors to see different timeframes. Simply attach to any chart. Take note of higher time frames before entering trades on lower time frames. (Zoom the H1/H4/Daily chart out completely) Sell when Multiple PSars cross above the price. Example: M1-M5-M15-M30-H
Mountains
Natasha Diedericks
Visual helper for spotting peaks and troughs. Alerts. PSar settings for trend direction determination. Great for scalping. How to use: Simply attach to any chart. To spot peaks and troughs, zoom chart out completely. Sell on red dots. Best results when red dot appears on 3 or more time frames. Buy on blue dots. Best results when blue dot appears on 3 or more time frames. If used on lower timeframes (M1, M5, M15, M30), please make sure to check higher timeframes. Or backtest and use as you see fi
M1 Scalper Mt4
Natasha Diedericks
This indicator is excellent for scalping on the M1 or M5 chart. Uses a special algorithm for the lines. No need to set up the indicator. Does not feature any alerts and is best used manually after visually confirming the line displays. NB: Make sure to download M1 history before testing and use. How to use: Simply attach to M1 or M5 chart. Zoom chart out completely. Sell when all lines above the white line (PriceLine). Sniper line crosses above white line. Buy when all lines below the white li
Easily track how the price moves in a separate indicator window with this trend indicator. Great for scalping or long-term trading. Helps you find best entry points for your trades after reaching a certain level, and easily identify where you can exit your trades. This indicator can be used on all time frames and pairs. Features alert function. No need to set up the indicator. How to use: Simply attach to any chart. NB : Look to the extreme zones (oversold/overbought) when looking for new tra
Multi RSI Pro mt4
Natasha Diedericks
5 (1)
This indicator takes input from the RSI from multiple time frames (M/W/D/H4/H1), and presents the output on the main chart. Great for scalping. Features alerts for the current chart's TrendLine above or below price. TrendLine period setting. Multi RSI period settings. How to use: Simply attach to M5 (Scalping - zoom chart out completely on M5) or use on higher time frames' charts. Zoom chart out completely to get a better view of the chart. Hover over the lines to see the time frame applicable.
This indicator takes input from the RSI, combined with a trend filter. Great for scalping. Does not feature any alerts and is best used manually. Settings: TrendFilterPeriod RSIPeriod Set these parameters to your preference. How to use: Attach to any chart with default settings. Can be used on any time frame. If used on lower time frames, check higher time frames too. Buy : - Wait for blue histo color to cross above level 50, then open buys. **Best results when checking the higher time frames to
Trend Histo mt4
Natasha Diedericks
This indicator uses 2 trend filters. Great for scalping. Features alerts Settings: TrendFilterPeriod1 TrendFilterPeriod2 How to use: Attach to any chart with default settings, or set to your preference. Can be used on any time frame. If used on lower time frames, check higher time frames too. Buy : - Blue histo color. Sell : - Red histo color. Or backtest and use as you see fit for your strategy. Best results on Major Pairs, but can also be used on other pairs (Metals, Minors). Important to no
Trend Chart mt4
Natasha Diedericks
Displays multiple trend indicators on the main chart. Great for scalping. Settings: LWMA SMA SSMA EMA ADX (red and blue dots), and PSar Alerts for ADX crosses. How to use: Can be used on any time frame.  Buy : - Blue dot first. - Then PSar and 3 MAs cross below price. **Best results when confirming the higher time frames too. Sell : - Red dot first. - Then PSar and 3 MAs cross above price. **Best results when confirming the higher time frames too. Or backtest and use as you see fit for your str
This indicator takes input from the RSI from multiple time frames (M/W/D/H4/H1/M30), and presents the output as lines above or below the price, on the main chart. Great for scalping. Features alerts for the current time frame's RSI (the Arrows). Settings: RSI period settings for M/W/D/H4/H1/M30/Current. (Set to your preference) PSar settings for trend determination; for current chart's time frame. How to use: Simply attach to M5 (Scalping - zoom chart out completely on M5) or use on higher time
Uses a trend filter to plot the lines and arrows. Great for scalping. Settings: TrendPeriod: change to your preference. Alerts. How to use: Can be used on any time frame. Attached to chart, and wait for arrow to appear on multiple timeframes. Buy : -  Blue arrow and blue line cross below price on multiple time frames; e.g., on D,W,M or H1,H4,Daily or M30,H1,H4 Sell : -  Yellow arrow and red line cross above price on multiple time frames; e.g., on D,W,M   or H1, H4, Daily or  M30,H1,H4 **Best r
Pro Trader mt4
Natasha Diedericks
This indicator takes input from the RSI and a trend filter, and presents the output in a separate indicator window as a histogram. Great for scalping. Settings: No need to set up the indicator. Features Alerts. How to use: Simply attach to any chart Zoom chart in to get a better view of the histo color. Buy:  Blue histo color on multiple timeframes. (e.g,. M30-H1-H4) Sell: Red histo color  across on multiple timeframes. Or backtest and use as you see fit for your strategy. Best results on Majo
PTT mt4
Natasha Diedericks
This indicator takes input from the RSI and a trend filter, and presents the output in a separate indicator window as a histogram. Great for scalping. Settings: TrendPeriod RSIPeriod Features Alerts. How to use: Simply attach to any chart Zoom chart in to get a better view of the histo color. Buy:  Blue histo color on multiple timeframes. (e.g,. M30-H1-H4) Sell: Red histo color  across on multiple timeframes. Or backtest and use as you see fit for your strategy. Best results on Major Pairs, bu
SLT mt4
Natasha Diedericks
This indicator takes input from a trend filter and 2 oscillators, and presents the output in a separate indicator window as 2 lines and arrows. Great for scalping. Settings: No need to set up the indicator. Features Alerts. How to use: Simply attach to any chart Zoom chart in to get a better view of the lines. Buy:  Blue arrow. Best results when entering buys above the 0.00 level, and confirming on higher timeframes too. Sell: Red arrow. Best results when entering sells below the 0.00 level,   a
ADT mt4
Natasha Diedericks
This indicator takes input from Accumulation/Distribution and a trend filter, and presents the output in a separate indicator window as a histogram. Great for scalping. Settings: TrendPeriod Features Alerts. How to use: Simply attach to any chart with default setting, or set the TrendPeriod to your preference. Zoom chart in to get a better view of the histo color. Buy:  Blue histo color on multiple timeframes. (e.g., M30-H1-H4-D) Sell: Red histo color  on multiple timeframes. Or backtest and u
ADX Trend mt4
Natasha Diedericks
This indicator takes input from the ADX, and presents the output in a separate indicator window as a histogram. Great for scalping. Settings: ADXPeriod Features Alerts. How to use: Simply attach to any chart with default setting, or set the ADXPeriod to your preference. Zoom chart in to get a better view of the histo color. Buy:  Blue histo color on multiple timeframes. (e.g., M30-H1-H4-D) Sell: Red histo color  on multiple timeframes. Or backtest and use as you see fit for your strategy. Best
OBV Trend mt4
Natasha Diedericks
This indicator takes input from the OBV and a trend filter, and presents the output in a separate indicator window as a histogram. Great for scalping. Settings: TrendPeriod Features Alerts. How to use: Simply attach to any chart with default setting, or set the TrendPeriod to your preference. Zoom chart in to get a better view of the histo color. Buy:  Blue histo color on multiple timeframes. (e.g., M15-M30-H1-H4) Sell: Red histo color  on multiple timeframes. Or backtest and use as you see fi
Use this indicator to help determine when to open buys or sells based on the slope and direction of the channel. Excellent for scalping. Settings: TrendPeriod. Deviation. ChannelPeriod. Features Alerts. How to use: Simply attach to any chart. To use on lower timeframes (M1,M5,M30), you'll need to start setting the Deviation from 0.01 and increase it if needed. If used on lower timeframes  ( M1,M5,M30,H1), confirm on higher timeframes (H4,D,W) before entering trades. H1: Set Deviation to 0.5. H4:
Only Line mt4
Natasha Diedericks
Use this indicator to help determine when to open buys or sells based on the color of the line. Excellent for scalping. Settings: Deviation. TrendPeriod. Features Alerts. How to use: Simply attach to any chart with default settings. When used on lower timeframes (M1,M5,M30,H1), confirm on higher timeframes.  Buy:  Blue line below price. Best results when line is blue on multiple timeframes. Sell: Red line above price. Best results when line is red on multiple timeframes. Or change settin
Trend Sniper mt4
Natasha Diedericks
This indicator takes input from a trend filter to determine best entries for trades, on the crossings of the two lines. Excellent for scalping. A simple indicator that doesn't need setting up. Does not feature any alerts. How to use: Simply attach to any chart. When used on lower timeframes, also confirm on higher timeframes.  Buy:  Blue line moves to Level-0 yellow dotted line. Best results when confirming this on multiple timeframes, e.g., Daily-Weekly-Monthly. Sell: Red line moves to Level-0
Filtro:
Nessuna recensione
Rispondi alla recensione
Versione 1.5 2022.09.25
Buffer update.
Higher Period4 added.
Default settings update.
Input signal update.
Versione 1.4 2022.09.23
Buffer update.
Input signal update.
Versione 1.3 2022.09.22
Alerts removed.
Buffer update
Versione 1.2 2022.06.18
Input signal update.
Buffer update.
Alert added for each line period.
Issue with journal entry fixed.
Versione 1.1 2021.01.13
Buffer update.