Heatmap 105
- Indicatori
- Alain Verleyen
- Versione: 1.21
- Aggiornato: 22 novembre 2021
- Attivazioni: 5
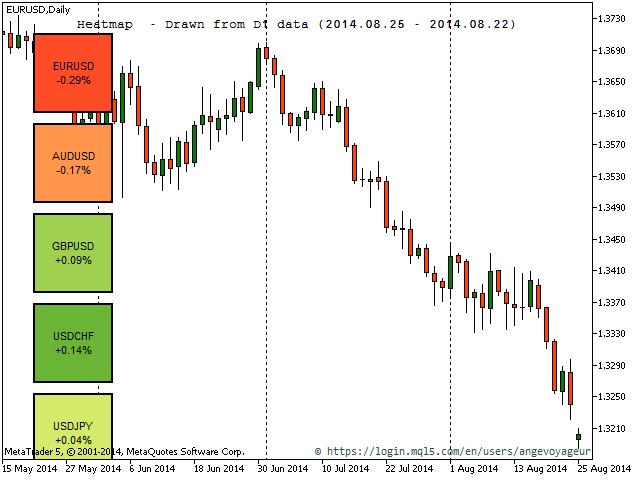
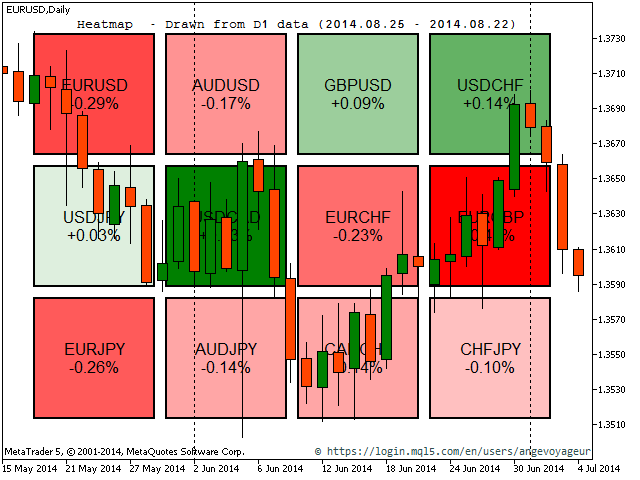
L'indicatore Heatmap
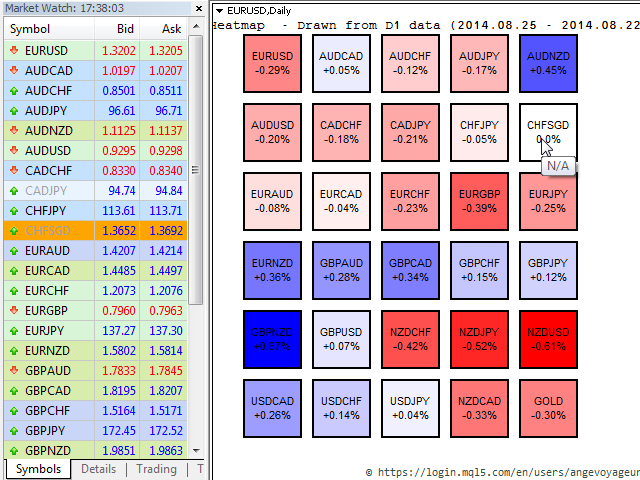
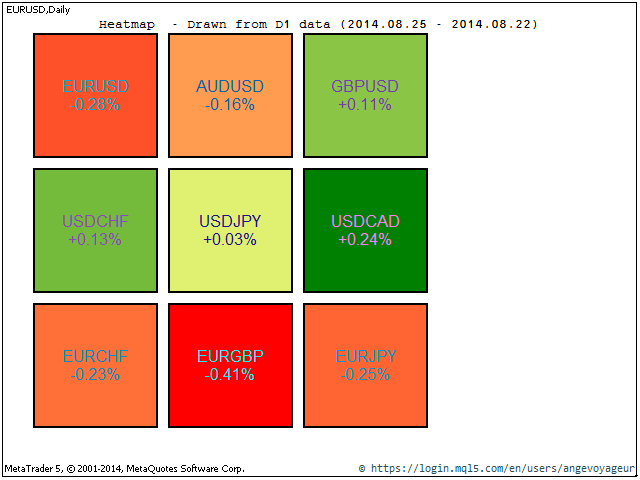
L'indicatore Heatmap consente di visualizzare una "mappa di calore" di tutti i simboli selezionati nel Market Watch. In questa versione mostra la variazione percentuale del prezzo rispetto all'ultima chiusura giornaliera, in modo da fornire una rapida panoramica del mercato.
Si tratta di uno strumento che aiuta i trader a identificare la forza di una valuta rispetto a tutte le altre coppie. Si tratta di uno strumento visivo e non può essere utilizzato all'interno degli Expert Advisor. In questo senso, è più uno strumento per trader discrezionali che per trader automatici. Quindi, per coloro che sono interessati a utilizzare questo strumento per il trading automatico, purtroppo non è possibile.
È particolarmente utile per i mercati azionari o futures, come ad esempio il Bovespa, la borsa brasiliana.
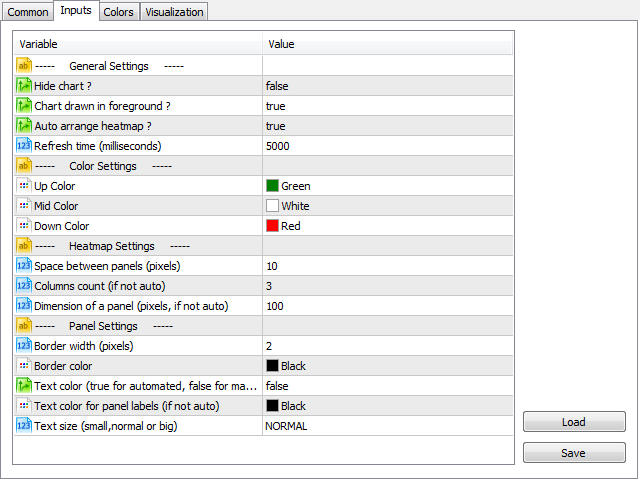
Impostazioni
Ci sono diverse impostazioni da personalizzare nell'indicatore heatmap:
| Impostazione | Valori possibili | Descrizione |
|---|---|---|
| Nascondi grafico? | Vero/Falso | È possibile nascondere completamente il grafico o mantenerlo così com'è. Il grafico verrà ripristinato quando l'indicatore verrà rimosso dal grafico. |
| Grafico disegnato in primo piano? | Vero/Falso | Se l'impostazione precedente è True, è possibile scegliere se visualizzare il grafico in primo piano (true) o sullo sfondo (false). |
| Disposizione automatica della mappa di calore? | Vero/Falso | Se true, tutti i dimensionamenti e le disposizioni vengono eseguiti automaticamente. In caso contrario, è necessario selezionare altre impostazioni. |
| Tempo di aggiornamento (millisecondi) | >=1000 | Per impostazione predefinita, i dati vengono aggiornati ogni 5 secondi. Il valore minimo è 1.000 (1 secondo). |
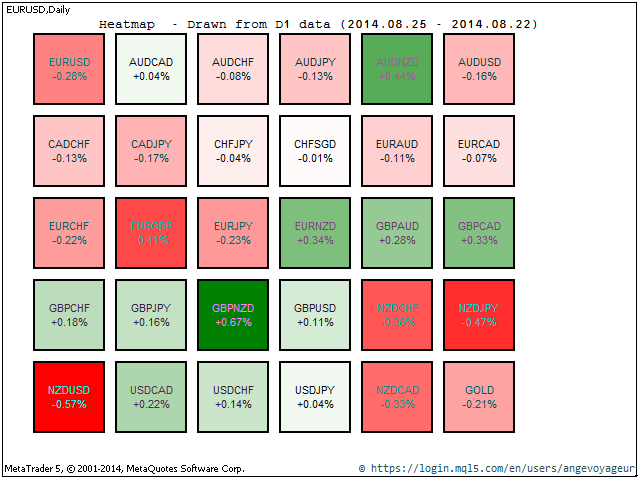
| Colore su | qualsiasi colore | Blu per impostazione predefinita. Questo colore viene utilizzato per indicare i simboli con variazione percentuale positiva. |
| Colore medio | qualsiasi colore | Bianco per impostazione predefinita. È il colore neutro, utilizzato per i simboli senza aumento o diminuzione (0%). |
| Colore Giù | qualsiasi colore | Rosso per impostazione predefinita. Questo colore viene utilizzato per indicare una variazione percentuale negativa del prezzo. |
| Spazio tra i pannelli (pixel) | >=0 | Spazio tra 2 pannelli (simboli) della mappa di calore. |
| Numero di colonne (se non è automatico) | >=1 | Utilizzato solo se "Disporre automaticamente la mappa di calore?" è false. Indica il numero di colonne da utilizzare per visualizzare la mappa di calore. |
| Dimensione di un pannello (pixel, se non è automatico) | >=50 | Utilizzato solo se "Disposizione automatica della heatmap?" è false. Indica la dimensione del pannello di un simbolo sulla heatmap. |
| Larghezza del bordo (pixel) | >=0 | Dimensione del bordo del pannello di un simbolo. |
| Colore del bordo | qualsiasi colore | Colore del bordo del pannello di un simbolo. |
| Colore del testo (true per l'automatico, false per il manuale) | Vero/Falso | Colore utilizzato per le etichette di testo (nome del simbolo e percentuale). Vero=automatico, false=manuale (vedere il parametro successivo). |
| Colore del testo per le etichette del pannello (se non è automatico) | qualsiasi colore | Se l'impostazione precedente è false, questo colore verrà utilizzato per le etichette di testo del pannello. |
| Dimensione del testo (piccola, normale o grande) | enum | Dimensione delle etichette del pannello (nome e percentuale). |
Il numero massimo di simboli consentito è 200. Se il Market Watch contiene più di 200 simboli, verranno visualizzati solo i primi 200. Si prega di notare che è necessario disporre di risorse sufficienti (CPU, memoria) sul computer se si desidera visualizzare molti simboli contemporaneamente.
Per qualsiasi domanda, osservazione o suggerimento, contattatemi. Buon trading.


Very nice! I would pay some extra bucks for a variable to add specific symbols (not all marketwatch) and the ability to put the symbols in an order.