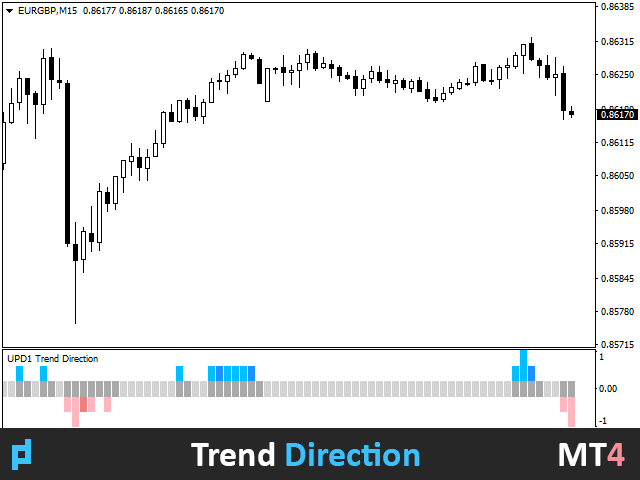
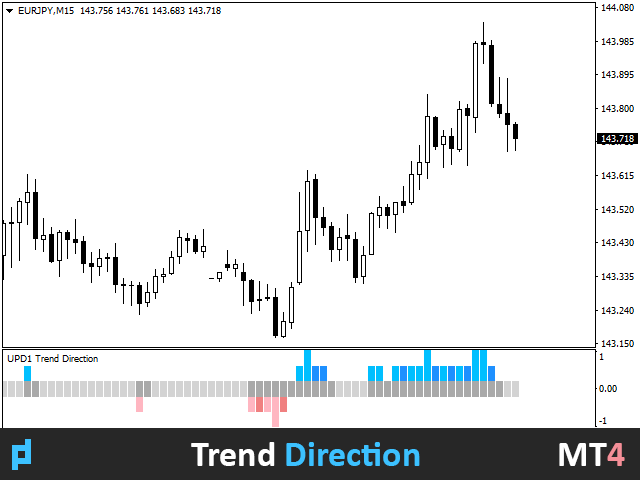
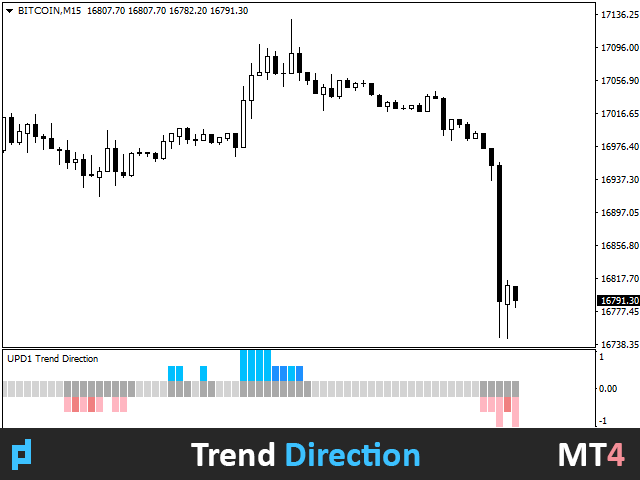
UPD1 Trend Direction
- Indicatori
- Vitaliy Kuznetsov
- Versione: 2.50
- Aggiornato: 24 dicembre 2023
Questo indicatore viene utilizzato per visualizzare le posizioni piatte e di tendenza. Il design si basa su un oscillatore. Viene utilizzato come filtro aggiuntivo, sia per il trading su un grafico normale che per le opzioni binarie.
Le posizioni piatte vengono utilizzate nell'indicatore UPD1 volume Cluster per il trading secondo il concetto di Smart Money.
Un avviso incorporato segnala i luoghi più ipercomprati / ipervenduti.
Parametri di input.
Impostazioni di base.
Bars Count - specificare il numero di barre su cui verrà visualizzato l'indicatore.
Period - seleziona il periodo dell'oscillatore.
Start Flat After Bar - quante barre ignorare dopo la fine della tendenza per iniziare a disegnare flat.
Impostazioni visive.
Color - automaticamente o manualmente.
Floor Color - se il colore è impostato "manualmente", è possibile impostare i propri colori.
Histo Width (0 - Auto) - seleziona lo spessore dell'istogramma o imposta la modalità automatica.
Impostazioni di avviso.
Alert - abilitare / disabilitare le impostazioni di notifica.
Alert Work Time - specificare il periodo di tempo in cui l'avviso sarà attivo.
Alert Pop Up - abilita/disabilita popup di avviso.
Alert Push - abilitare / disabilitare la notifica sul telefono.
Alert E-mail - abilitare / disabilitare la notifica e-mail.
Alert Sound - abilita/disabilita la notifica sonora.
Alert Sound Name - seleziona il file di avviso sonoro.
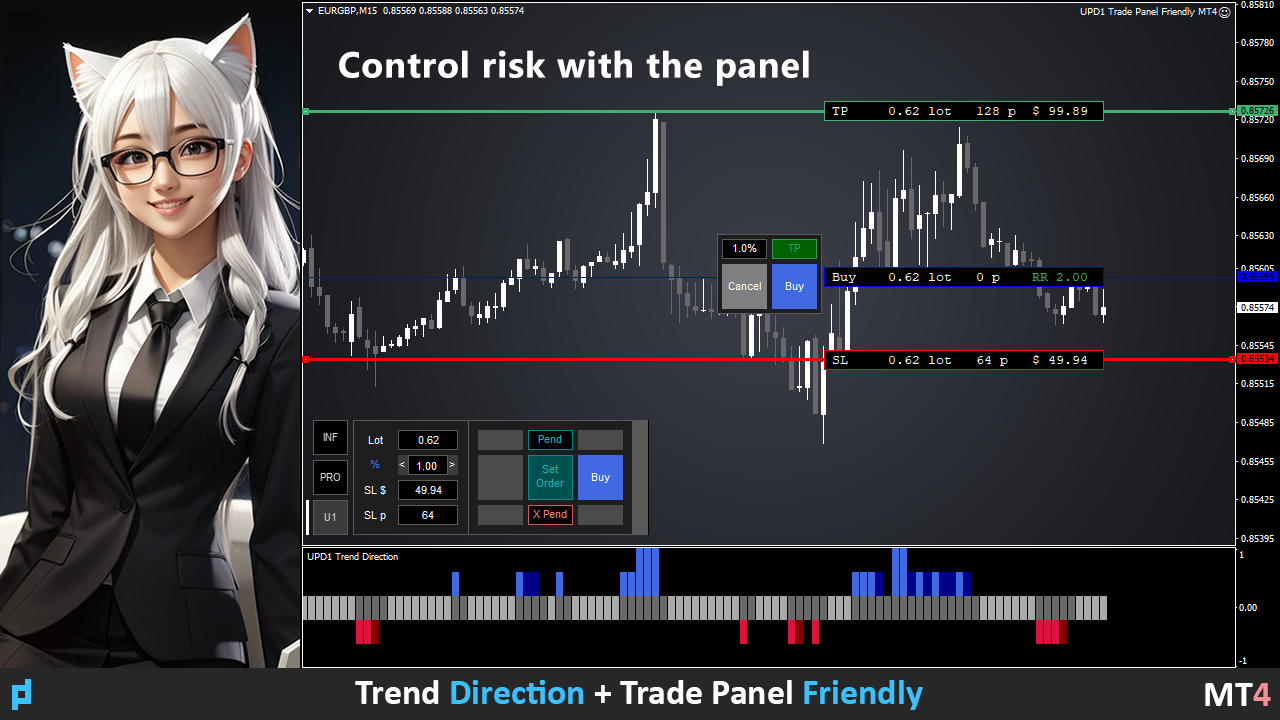


So useful