• Panoramica
  • Recensioni
  • Commenti (9)
  • Novità

Master candle strategy MT5

Questo indicatore riconosce un tipo speciale di formazione Inside Bar che è formata da una grande candela Master seguita da 4 candele più piccole (vedi la spiegazione della strategia di seguito).

Caratteristiche

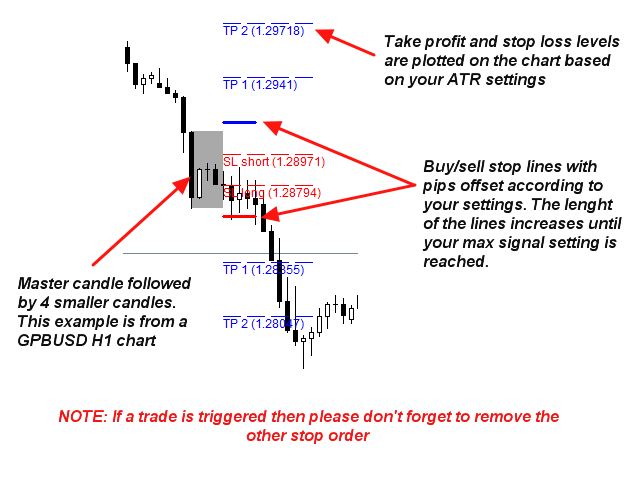
  • Traccia le linee di stop di acquisto/vendita sul grafico, nonché i livelli di take profit e stop loss. I livelli TP/SL si basano sull'indicatore ATR (Average True Range).
  • I colori degli oggetti sono modificabili.
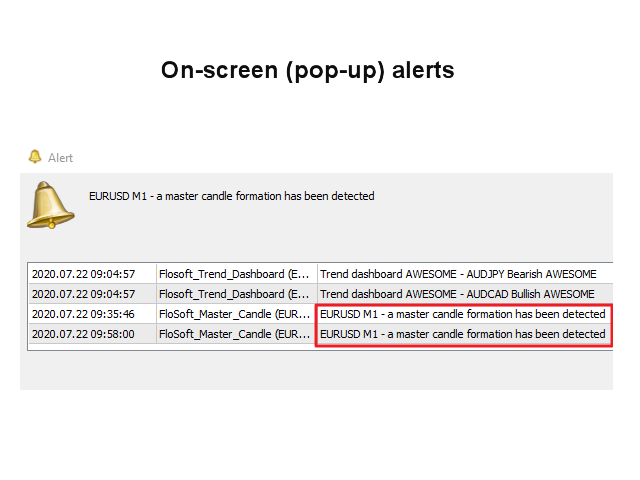
  • Ti invia un avviso in tempo reale quando viene identificata una formazione di candele Master: suono/popup/e-mail/notifica push.

Una volta che viene dato un suggerimento, puoi confermarlo con la tua analisi del grafico. Generalmente le migliori configurazioni da negoziare sono quelle che si verificano attorno a importanti supporti/resistenze, numeri tondi, zone di domanda e offerta, ecc.

Parametri di input

  • Numero di candele interne : per la migliore qualità del segnale si consiglia di impostarlo su 4. Si prega di consultare la spiegazione della strategia di seguito.
  • Il segnale delle candele massime è valido per : questa impostazione controlla la durata dell'espansione delle linee del livello di ingresso suggerito.
  • Distanza in pips per stop di acquisto/vendita : l'offset/buffer per le righe di immissione. Consigliato ad almeno 5 pips di distanza per Master candle high/low.
  • Dimensione minima della candela principale in pips : vedere la spiegazione della strategia di seguito.
  • Dimensione massima della candela principale in pips : vedere la spiegazione della strategia di seguito.
  • Attendi la chiusura della candela : vero/falso. L'impostazione predefinita è Vero. Se impostato su False, l'avviso arriverà già quando il 4    ns   la candela si apre.
  • Ignora gli stoppini sulle barre interne : vero/falso. L'impostazione predefinita è Falso. Se impostato su True, gli stoppini sono consentiti sopra/sotto la candela Master alta/bassa.
  • Ignora gli stoppini sulla barra principale : vero/falso.
  • ATR Period : Periodo per l'indicatore Average True Range. Il valore predefinito è 14.
  • Moltiplicatore TP 1 ATR : utilizzato per il primo livello di take profit.
  • Moltiplicatore TP 2 ATR : utilizzato per il secondo livello di take profit.
  • Moltiplicatore SL ATR : utilizzato per il livello di stop loss.
  • Oggetti : In questa sezione è possibile modificare i colori del rettangolo di formazione Master e le linee di stop di acquisto/vendita. Puoi anche impostare la larghezza delle linee di stop di acquisto/vendita.
    • Mostra il testo sotto le righe :   vero falso. Se impostato su False, TP/SL + prezzo non verrà scritto sotto le righe.
  • Candele storiche massime : Per quante candele indietro nel tempo verrà disegnata la formazione sul grafico.
  • Avvisi : imposta su true per ogni tipo di avviso che desideri ricevere.   Sono supportati tutti i tipi di avviso.


Strategia

Master Candle (MC) è una strategia di trading basata su una formazione di candele in cui la prima candela (master) è seguita da 4 candele più piccole che si trovano all'interno della prima candela. L'intera formazione è costituita da 5 candele, indipendentemente se ribassista o rialzista.

Tempi : grafici H1 e H4. Anche se la strategia MC funziona meglio su H1, può essere scambiata su tutti i timeframe e le coppie di valute. Principalmente sui grafici H4, H1 e M30.

Coppie di valute : negozia meglio su coppie volatili come GBPUSD e GBPJPY.

Dopo aver rotto MC alto/basso, verrà presa una posizione nella direzione dell'interruzione. Si raccomanda che il MC abbia una dimensione da 40 a 100 pips (ma dipende dalla volatilità della coppia di valute in questione). Si consiglia inoltre di inserire ordini stop, ad esempio, 5 pips sopra e sotto il massimo/minimo MC.

Alcuni trader usano anche la regola che dovrebbe verificarsi un'interruzione in qualsiasi direzione durante le prossime 3 candele dopo la creazione dell'MC (5    ns   candela). In ogni caso, si consiglia vivamente di annullare qualsiasi ordine di stop se non ci sono interruzioni dopo 24 ore.

Infine, per ottenere risultati migliori, si consiglia di negoziare nella direzione del trend e di evitare di negoziare a livelli di prezzo forti e importanti - resistenze e supporti. Si consiglia inoltre di non scambiare MC che appare all'interno di un altro MC.

Prodotti consigliati
Volality Index Scalper
Lesedi Oliver Seilane
Volality Index scalper indicator  Meant for Volality pairs such as Volality 10, 25, 50, 75 and 100 The indicator works on all timeframes from the 1 minute to the monthly timeframe the indicator is non repaint the indicator has 3 entry settings 1 color change on zero cross 2 color change on slope change 3 color change on signal line cross Orange line is your sell signal Blue line is your buy signal.
This indicator allows you to enjoy the two most popular products for analyzing request volumes and market deals at a favorable price: Actual Depth of Market Chart Actual Tick Footprint Volume Chart This product combines the power of both indicators and is provided as a single file. The functionality of Actual COMBO Depth of Market AND Tick Volume Chart is fully identical to the original indicators. You will enjoy the power of these two products combined into the single super-indicator! Below is
This indicator is the same as the popular Heiken Ashi Smoothed. The Heikin Ashi indicator for MetaTrader 5 already exists, but it has two disadvantages: It paints the candles not accurate. It's not possible to change the candle width. See also Heikin Ashi in MQL5 Code Base . In this version there are no such disadvantages.
US30NinjaMT5
Satyaseelan Shankarananda Moodley
US30 Ninja is a 5 minute scalping indicator that will let know you when there is a trade set up (buy or sell). Once the indicator gives the trade direction, you can open a trade and use a 30 pip stop loss and a 30 pip to 50 pip take profit. Please trade at own own risk. This indicator has been created solely for the US30 market and may not yield positive results on any other pair. 
Welcome to the Ultimate Harmonic Patterns recognition indicator that is focused to detect advanced patterns. The Gartley pattern, Bat pattern, and Cypher pattern  are popular technical analysis tools used by traders to identify potential reversal points in the market. Our Ultimate Harmonic Patterns recognition Indicator is a powerful tool that uses advanced algorithms to scan the markets and identify these patterns in real-time. With our Ultimate Harmonic Patterns recognition Indicator, you
The Gann Box (or Gann Square) is a market analysis method based on the "Mathematical formula for market predictions" article by W.D. Gann. This indicator can plot three models of Squares: 90, 52(104), 144. There are six variants of grids and two variants of arcs. You can plot multiple squares on one chart simultaneously. Parameters Square — selection of a square model: 90 — square of 90 (or square of nine); 52 (104) — square of 52 (or 104); 144 — universal square of 144; 144 (full) — "full"
Trend Master Chart MT5
Frederic Jacques Collomb
5 (2)
Trend Master Chart è l'indicatore di tendenza di cui hai bisogno. Si sovrappone al grafico e utilizza la codifica a colori per definire le diverse tendenze/mosse del mercato. Utilizza un algoritmo che combina due medie mobili e diversi oscillatori. I periodi di questi tre elementi sono modificabili. Funziona su qualsiasi intervallo di tempo e su qualsiasi coppia. A colpo d'occhio sarai in grado di identificare una tendenza al rialzo o al ribasso e i diversi punti di ingresso in questa tendenz
FREE
Cumulative delta indicator As most traders believe, the price moves under the pressure of market buying or selling. When someone redeems an offer standing in the cup, the deal is a "buy". If someone pours into the bid standing in the cup - the deal goes with the direction of "sale". The delta is the difference between purchases and sales. A cumulative delta - the difference between the cumulative sum of purchases and sales for a certain period of time. It allows you to see who is currently contr
Snipeer2
Ignacio Agustin Mene Franco
Sniper2 , It has points of lines, with colors that are showing you an entrance, that work as support and resistance! green dotted lines green shows entry for sale, the red dotted lines show a buy entry, pay attention to the supports that work as a break to catch long candles in a longer period of time. works for forex all pairs works for synthetic indices all pairs ! indicator on sale!
You can change the time period of the chart at the touch of a button. You can also change multiple charts at the touch of a button. You can also change multiple charts at the touch of a button,   saving you the trouble of changing time periods. We are live-streaming the actual operation of the system. Please check for yourself if it is usable. Please check it out for yourself. https://www.youtube.com/@ganesha_forex We do not guarantee your investment results. Investments should be made at y
Owl Smart Levels MT5
Sergey Ermolov
4.47 (36)
Versione MT4  |  FAQ L' indicatore Owl Smart Levels è un sistema di trading completo all'interno dell'unico indicatore che include strumenti di analisi di mercato popolari come i frattali avanzati di Bill Williams , Valable ZigZag che costruisce la corretta struttura a onde del mercato, e i livelli di Fibonacci che segnano i livelli esatti di entrata nel mercato e luoghi per prendere profitti. Descrizione dettagliata della strategia Istruzioni per lavorare con l'indicatore Consulente-assistente
Magic Channel Scalper è un indicatore di canale per il terminale MetaTrader 5. Questo indicatore consente di individuare i punti di inversione di tendenza più probabili. A differenza della maggior parte degli indicatori di canale, Magic Channel Scalper non viene ridisegnato. Il sistema di allerta (avvisi, e-mail e notifiche push) ti aiuterà a monitorare contemporaneamente più strumenti di trading. Collega l'indicatore a un grafico e l'avviso si attiverà quando emerge un segnale. Con il
Volume by Price MT5
Brian Collard
5 (3)
The Volume by Price Indicator for MetaTrader 5 features Volume Profile and Market Profile TPO (Time Price Opportunity). Get valuable insights out of currencies, equities and commodities data. Gain an edge trading financial markets. Volume and TPO histogram bar and line charts. Volume Footprint charts. TPO letter and block marker charts including split structures. Versatile segmentation and compositing methods. Static, dynamic and flexible ranges with relative and/or absolute visualizations. Lay
Rainbow EA MT5
Jamal El Alama
Description : Rainbow EA MT5 is a simple Expert advisor based on   Rainbow MT5 indicator witch is based on Moving average with period 34. The indicator is incorporated in the EA, therefore, it is not required for the EA to operate, but if you wish, you can download it from   my product page . The Expert Advisor settings are as follows : Suitable for Timeframes up to H1 The parameters below can be set according to your trading rules. StopLoss ( Stop Loss in pips) TakeProfit ( Take Profit in pi
PipFinite Trend PRO MT5
Karlo Wilson Vendiola
4.87 (664)
Breakthrough Solution For Trend Trading And Filtering With All Important Features Built Inside One Tool! Trend PRO's smart algorithm detects the trend, filters out market noise and gives entry signals with exit levels. The new features with enhanced rules for statistical calculation improved the overall performance of this indicator. Important Information Revealed Maximize the potential of Trend Pro, please visit www.mql5.com/en/blogs/post/713938 The Powerful Expert Advisor Version Automa
Laguerre SuperTrend Clouds   adds an Adaptive Laguerre averaging algorithm and alerts to the widely popular SuperTrend indicator. As the name suggests,   Laguerre SuperTrend Clouds (LSC)   is a trending indicator which works best in trendy (not choppy) markets. The SuperTrend is an extremely popular indicator for intraday and daily trading, and can be used on any timeframe. Incorporating Laguerre's equation to this can facilitate more robust trend detection and smoother filters. The LSC uses the
Your Trend Friend
Luigi Nunes Labigalini
The trend is your friend! Look at the color of the indicator and trade on that direction. It does not  repaint. After each candle is closed, that's the color of the trend. You can focus on shorter faster trends or major trends, just test what's most suitable for the symbol and timeframe you trade. Simply change the "Length" parameter and the indicator will automatically adapt. You can also change the color, thickness and style of the lines. Download and give it a try! There are big movements
Noize Absorption Index - is the manual trading system that measures the difference of pressure between bears forces and bulls forces. Green line - is a noize free index that showing curent situation. Zero value of index shows totally choppy/flat market.Values above zero level shows how powerfull bullish wave is and values below zero measures bearish forces.Up arrow appears on bearish market when it's ready to reverse, dn arrow appears on weak bullish market, as a result of reverse expectation.
Mine Farm
Maryna Kauzova
5 (1)
Mine Farm is one of the most classic and time-tested scalping strategies based on the breakdown of strong price levels. Mine Farm is the author's modification of the system for determining entry and exit points into the market... Mine Farm - is the combination of great potential with reliability and safety. Why Mine Farm?! - each order has a short dynamic Stop Loss - the advisor does not use any risky methods (averaging, martingale, grid, locking, etc.) - the advisor tries to get
PZ Trend Trading MT5
PZ TRADING SLU
3.67 (3)
Trend Trading is an indicator designed to profit as much as possible from trends taking place in the market, by timing pullbacks and breakouts. It finds trading opportunities by analyzing what the price is doing during established trends. [ Installation Guide | Update Guide | Troubleshooting | FAQ | All Products ] Trade financial markets with confidence and efficiency Profit from established trends without getting whipsawed Recognize profitable pullbacks, breakouts and early reversals The ind
Was: $249  Now: $99   Market Profile defines a number of day types that can help the trader to determine market behaviour. A key feature is the Value Area, representing the range of price action where 70% of trading took place. Understanding the Value Area can give traders valuable insight into market direction and establish the higher odds trade. It is an excellent addition to any system you may be using. Inspired by Jim Dalton’s book “Mind Over Markets”, this indicator is designed to suit the
L'indicatore calcola e traccia automaticamente i livelli di supporto e resistenza di Fibonacci, uno degli strumenti più efficaci per l'analisi di mercato. Il calcolo utilizza i dati del prezzo medio per il periodo e l'intervallo di tempo selezionati. Il minimo e il massimo per questo periodo sono presi come inizio e fine del movimento. I livelli di Fibonacci ti consentono di vedere potenziali punti di riferimento, attorno ai quali il movimento dei prezzi può rallentare o invertire, ovvero vengon
An indicator of pattern #31 ("Long Island") from Encyclopedia of Chart Patterns by Thomas N. Bulkowski. The second gap is in the opposite direction. Parameters: Alerts - show alert when an arrow appears   Push - send a push notification when an arrow appears (requires configuration in the terminal) GapSize - minimum gap size in points ArrowType - a symbol from 1 to 17 ArrowVShift - vertical shift of arrows in points   ShowLevels - show levels ColUp - color of an upward line ColDn - color of a
Inguz
Maxim Kuznetsov
Ing (inguz,ingwar) - the 23rd rune of the elder Futhark ᛝ, Unicode+16DD. Add some runic magic to your trading strategies. The correct marking of the daily chart will indicate to you the successful moments for counter-trend trading. Simple to use, has high efficiency in volatile areas. Be careful in lateral movements. Signals ᛝ are generated when the main lines of construction intersect. Red arrow down - recommended sales Blue up arrow - recommended purchases rare purple arrows indicate
An indicator of patterns #24, #25, #26 and #27 ("Head and Shoulders", "Complex Head and Shoulders") from Encyclopedia of Chart Patterns by Thomas N. Bulkowski. Parameters: Alerts - show alert when an arrow appears   Push - send a push notification when an arrow appears (requires configuration in the terminal) PeriodBars - indicator period K - an additional parameter that influences the accuracy of pattern shape recognition. The smaller the value is, the smoother the row of peaks/valleys shoul
MetaTrend M5
Vahidreza Heidar Gholami
5 (2)
Meta Trend Indicator is an efficient way to forecast and detect the trend in any market. It reveals the trend, support and resistance levels, volatility and the maximum potential target, all in one indicator. To adapt to the price and to decrease consecutive trend failures, the internal trend detector algorithm studies the market and dynamically chooses the right values for the internal parameters. This indicator is a perfect trend filter for any strategy or expert advisor. Features Super Adapti
This indicator is used to compare the relative strength of the trade on the chart against the other several selected symbols. By comparing the price movement of each traded variety based on the same base day, several trend lines of different directions can be seen, reflecting the strong and weak relationship between the several different traded varieties, so that we can have a clearer understanding of the market trend. For example, you can apply this indicator on a EurUSD chart and compare it
Awesome Oscillator by Bill Williams with the ability to fine-tune and replace the averaging algorithms of the indicator, which significantly expands the possibilities of using this oscillator in algorithmic trading and brings it closer in its properties to such an indicator as the MACD. To reduce price noise, the final indicator is processed with an additional Smooth averaging. The indicator has the ability to give alerts, send mail messages and push signals when the direction of movement of th
The Jackson Auto Candlestick Pattern . It a powerful price action tool which auto detect and alert a hided powerful candlestick patterns . It came with few different chart skins. You can use this indicator alone to make profit, but it powerful when you combine it with trendlines, You can download The Jackson Auto Trendlines for free Link : UCRW695l9Wgg2ucnnf5DL5Vw  List of Candlestick Pattern it detect   1. Bullish & Bearish Engulfing's 2. Top and Bottom Tweezer 3. Bullish and Bearish Harams 4.
Il livello Premium è un indicatore unico con una precisione superiore all'80% delle previsioni corrette! Questo indicatore è stato testato dai migliori Specialisti di Trading per più di due mesi! L'indicatore dell'autore che non troverai da nessun'altra parte! Dagli screenshot puoi vedere di persona la precisione di questo strumento! 1 è ottimo per il trading di opzioni binarie con un tempo di scadenza di 1 candela. 2 funziona su tutte le coppie di valute, azioni, materie prime, cript
Gli utenti di questo prodotto hanno anche acquistato
Innanzitutto è importante sottolineare che questo sistema di trading è un indicatore Non-Repainting, Non-Redrawing e Non-Lagging, il che lo rende ideale sia per il trading manuale che per quello automatico. Il "Sistema di Trading Smart Trend MT5" è una soluzione completa pensata sia per i trader principianti che per quelli esperti. Combina oltre 10 indicatori premium e offre più di 7 robuste strategie di trading, rendendolo una scelta versatile per diverse condizioni di mercato. Strategia di Tre
Atomic Analyst MT5
Issam Kassas
4.27 (11)
Innanzitutto, vale la pena sottolineare che questo indicatore di trading non è repaint, non è ridisegno e non presenta ritardi, il che lo rende ideale sia per il trading manuale che per quello automatico. L'Analista Atomico è un indicatore di azione del prezzo PA che utilizza la forza e il momentum del prezzo per trovare un miglior vantaggio sul mercato. Dotato di filtri avanzati che aiutano a rimuovere rumori e segnali falsi, e aumentare il potenziale di trading. Utilizzando più strati di in
FX Volume MT5
Daniel Stein
4.94 (17)
Ricevi il tuo aggiornamento quotidiano sul mercato con dettagli e schermate tramite il nostro Morning Briefing qui su mql5 e su Telegram ! FX Volume è il PRIMO e UNICO indicatore di volume che fornisce una visione REALE del sentiment del mercato dal punto di vista del broker. Fornisce informazioni straordinarie su come gli operatori di mercato istituzionali, come i broker, sono posizionati sul mercato Forex, molto più velocemente dei rapporti COT. Vedere queste informazioni direttamente sul vo
Quantum Trend Sniper
Bogdan Ion Puscasu
5 (37)
Presentazione       Quantum Trend Sniper Indicator   , l'innovativo indicatore MQL5 che sta trasformando il modo in cui identifichi e scambi le inversioni di tendenza! Sviluppato da un team di trader esperti con un'esperienza di trading di oltre 13 anni,       Indicatore Quantum Trend Sniper       è progettato per spingere il tuo viaggio di trading verso nuove vette con il suo modo innovativo di identificare le inversioni di tendenza con una precisione estremamente elevata. *** Acquista Quant
Gold Stuff mt5
Vasiliy Strukov
4.89 (166)
Gold Stuff mt5 è un indicatore di tendenza progettato specificamente per l'oro e può essere utilizzato anche su qualsiasi strumento finanziario. L'indicatore non ridisegna e non è in ritardo. Periodo consigliato H1. Contattami subito dopo l'acquisto per avere le impostazioni e un bonus personale!   IMPOSTAZIONI Disegna freccia - acceso spento. disegnando frecce sul grafico. Avvisi: avvisi acustici disattivati. Notifica e-mail - on off. notifiche di posta elettronica. Notifica Puch - on of
Trend Screener Pro MT5
STE S.S.COMPANY
4.89 (61)
Indicatore di tendenza, soluzione unica rivoluzionaria per il trading di tendenze e il filtraggio con tutte le importanti funzionalità di tendenza integrate in un unico strumento! È un indicatore multi-timeframe e multi-valuta al 100% non ridipingibile che può essere utilizzato su tutti i simboli/strumenti: forex, materie prime, criptovalute, indici e azioni. Trend Screener è un indicatore di tendenza che segue un indicatore efficiente che fornisce segnali di tendenza a freccia con punti nel gra
RelicusRoad Pro MT5
Relicus LLC
4.82 (22)
Ora $ 147 (aumentando a $ 499 dopo alcuni aggiornamenti) - account illimitati (PC o MAC) Manuale utente di RelicusRoad + Video di formazione + Accesso al gruppo Discord privato + Stato VIP UN NUOVO MODO DI GUARDARE IL MERCATO RelicusRoad è l'indicatore di trading più potente al mondo per forex, futures, criptovalute, azioni e indici, fornendo ai trader tutte le informazioni e gli strumenti di cui hanno bisogno per rimanere redditizi. Forniamo analisi tecniche e piani di trading per aiutar
Innanzitutto, vale la pena sottolineare che questo Strumento di Trading è un Indicatore Non-Ridipingente, Non-Ridisegnante e Non-Laggante, il che lo rende ideale per il trading professionale. L'Indicatore Smart Price Action Concepts è uno strumento molto potente sia per i nuovi che per i trader esperti. Racchiude più di 20 utili indicatori in uno solo, combinando idee di trading avanzate come l'Analisi del Trader del Circolo Interno e le Strategie di Trading dei Concetti del Denaro Intelligen
Top indicator for MT5   providing accurate signals to enter a trade without repainting! It can be applied to any financial assets:   forex, cryptocurrencies, metals, stocks, indices .  Watch  the video  (6:22) with an example of processing only one signal that paid off the indicator! MT4 version is here It will provide pretty accurate trading signals and tell you when it's best to open a trade and close it. Most traders improve their trading results during the first trading week with the help of
FX Power MT5 NG
Daniel Stein
5 (4)
Ricevi il tuo aggiornamento quotidiano sul mercato con dettagli e schermate tramite il nostro Morning Briefing qui su mql5 e su Telegram ! FX Power MT5 NG è la nuova generazione del nostro popolare misuratore di forza delle valute, FX Power. Cosa offre questo misuratore di forza di nuova generazione? Tutto ciò che avete amato dell'FX Power originale IN PIÙ Analisi della forza di ORO/XAU Risultati di calcolo ancora più precisi Periodi di analisi configurabili individualmente Limite di calcolo pe
Advanced Supply Demand MT5
Bernhard Schweigert
4.53 (15)
La migliore soluzione per qualsiasi principiante o trader esperto! Questo indicatore è uno strumento di trading unico, di alta qualità e conveniente perché abbiamo incorporato una serie di funzionalità proprietarie e una nuova formula. Con questo aggiornamento, sarai in grado di mostrare fusi orari doppi. Non solo potrai mostrare una TF più alta, ma anche entrambe, la TF del grafico, PIÙ la TF più alta: SHOWING NESTED ZONES. Tutti i trader di domanda di offerta lo adoreranno. :) Informazioni imp
Auto Order Block with break of structure based on ICT and Smart Money Concepts Futures Break of Structure ( BoS )             Order block ( OB )            Higher time frame Order block / Point of Interest ( POI )    shown on current chart           Fair value Gap ( FVG ) / Imbalance   ,  MTF      ( Multi Time Frame )    Volume Imbalance     ,  MTF          vIMB Gap’s Equal High / Low’s     ,  MTF             EQH / EQL Liquidity               Current Day High / Low           HOD /
XQ Indicator MetaTrader 5
Marzena Maria Szmit
5 (1)
Step into the realm of Forex trading with confidence and precision using XQ, a cutting-edge Forex indicator designed to elevate your trading game to unprecedented heights. Whether you're a seasoned trader or just stepping into the world of currency exchange, XQ Forex Indicator empowers you with the insights and signals needed to make informed trading decisions. The signal conditions are a combination of three indicators, and XQ Forex Indicator only display  medium and long-term trends . The ind
ICT, SMC, SMART MONEY CONCEPTS, SMART MONEY, Smart Money Concept, Support and Resistance, Trend Analysis, Price Action, Market Structure, Order Blocks, BOS/CHoCH,   Breaker Blocks ,  Momentum Shift,   Supply&Demand Zone/Order Blocks , Strong Imbalance,   HH/LL/HL/LH,    Fair Value Gap, FVG,  Premium  &   Discount   Zones, Fibonacci Retracement, OTE, Buy Side Liquidity, Sell Side Liquidity, BSL/SSL Taken, Equal Highs & Lows, MTF Dashboard, Multiple Time Frame, BigBar, HTF OB, HTF Market Structure
Blahtech Supply Demand MT5
Blahtech Limited
4.57 (14)
Was: $299  Now: $99   Supply Demand uses previous price action to identify potential imbalances between buyers and sellers. The key is to identify the better odds zones, not just the untouched ones. Blahtech Supply Demand indicator delivers functionality previously unavailable on any trading platform. This 4-in-1 indicator not only highlights the higher probability zones using a multi-criteria strength engine, but also combines it with multi-timeframe trend analysis, previously confirmed swings
Il profitto dalla struttura del mercato cambia quando il prezzo si inverte e si ritira. L'indicatore di avviso di inversione della struttura del mercato identifica quando una tendenza o un movimento di prezzo si sta avvicinando all'esaurimento e pronto a invertire. Ti avvisa dei cambiamenti nella struttura del mercato che in genere si verificano quando stanno per verificarsi un'inversione o un forte pullback. L'indicatore identifica inizialmente i breakout e lo slancio del prezzo, ogni volta
L'indicatore Quadrato di Gann è uno strumento potente di analisi di mercato basato sull'articolo "Formula Matematica per le Previsioni di Mercato" scritto da W.D. Gann. Questo strumento utilizza concetti matematici e teorie di Gann per effettuare un'analisi precisa del mercato. Utilizza i quadrati di 144, 90, 52 e anche il quadrato di 9. Inoltre, integra il metodo del  per il quadrato di 9 e la sua relazione con canali e modelli stellari di quel quadrato. Manuale Utente e Applicazione: Prima di
AW Trend Predictor MT5
AW Trading Software Limited
4.76 (54)
La combinazione di trend e livelli di rottura in un unico sistema. Un algoritmo di indicatore avanzato filtra il rumore del mercato, determina la tendenza, i punti di ingresso e i possibili livelli di uscita. I segnali indicatori sono registrati in un modulo statistico, che permette di selezionare gli strumenti più adatti, mostrando l'efficacia dello storico dei segnali. L'indicatore calcola i segni Take Profit e Stop Loss. Manuale e istruzioni ->   QUI   / versione MT4 ->   QUI Come fare tradi
TrendLine PRO MT5
Evgenii Aksenov
4.78 (49)
The Trend Line PRO indicator is an independent trading strategy. It shows the trend change, the entry point to the transaction, as well as automatically calculates three levels of Take Profit and Stop Loss protection Trend Line PRO is perfect for all Meta Trader symbols: currencies, metals, cryptocurrencies, stocks and indices Advantages of Trend Line PRO Never redraws its signals The possibility of using it as an independent strategy It has three automatic levels Take Profit and Stop Loss lev
MetaBands M5
Vahidreza Heidar Gholami
4.67 (3)
MetaBands uses powerful and unique algorithms to draw channels and detect trends so that it can provide traders with potential points for entering and exiting trades. It’s a channel indicator plus a powerful trend indicator. It includes different types of channels which can be merged to create new channels simply by using the input parameters. MetaBands uses all types of alerts to notify users about market events. Features Supports most of the channel algorithms Powerful trend detection algorith
Presentazione       Quantum Breakout PRO   , l'innovativo indicatore MQL5 che sta trasformando il modo in cui scambi le zone di breakout! Sviluppato da un team di trader esperti con un'esperienza di trading di oltre 13 anni,       Quantum Breakout PRO       è progettato per spingere il tuo viaggio di trading a nuovi livelli con la sua strategia innovativa e dinamica della zona di breakout. Quantum Breakout Indicator ti fornirà frecce di segnalazione sulle zone di breakout con 5 zone target
Gartley Hunter Multi
Siarhei Vashchylka
5 (5)
Gartley Hunter Multi - An indicator for searching for harmonic patterns simultaneously on dozens of trading instruments and on all classic timeframes: (m1, m5, m15, m30, H1, H4, D1, Wk, Mn). Manual (Be sure to read before purchasing) | Version for MT4 Advantages 1. Patterns: Gartley, Butterfly, Shark, Crab. Bat, Alternate Bat, Deep Crab, Cypher 2. Simultaneous search for patterns on dozens of trading instruments and on all classic timeframes 3. Search for patterns of all possible sizes. Fr
Trend Line Map Pro MT5
STE S.S.COMPANY
4.67 (9)
Trend Line Map indicator is an addons for   Trend Screener Indicator . It's working as a scanner for all signals generated by Trend screener ( Trend Line Signals ) . It's a Trend Line Scanner based on Trend Screener Indicator.  If you don't have Trend Screener Pro Indicator,   the Trend Line Map Pro will not work.     LIMITED TIME OFFER : Trend Line Map Indicator is available for only 50 $ and lifetime. ( Original price 125$ ) By accessing to our MQL5 Blog,  you can find all our premium indica
TrendDecoder Premium MT5
Christophe, Pa Trouillas
5 (1)
Identificare i range e le prossime mosse probabili     |    Ottenere i primi segnali e la forza delle tendenze     |    Ottenere uscite chiare prima dell'inversione     |    Individuare i livelli di Fibo che il prezzo testerà   |  Indicatore non tracciante e non ritardato - ideale per il trading manuale e automatizzato - adatto a tutti gli asset e a tutte le unità temporali 50% di sconto   - per il lancio poi torna a   >>   149 $ Dopo l'acquisto,   contattatemi su questo canale  per le impostazi
TPSproTREND PrO MT5
Roman Podpora
5 (5)
TPSpro TRENDPRO  - is a trend indicator that automatically analyzes the market and provides information about the trend and each of its changes, as well as giving signals for entering trades without redrawing! The indicator uses each candle, analyzing them separately. referring to different impulses - up or down impulse. Exact entry points into transactions for currencies, crypto, metals, stocks, indices!  -  Version MT4                  DETAILED DESCRIPTION        /       TRADING SETUPS       
Black Dragon indicator mt5
Ramil Minniakhmetov
4.82 (56)
L'indicatore di rilevamento delle tendenze integrerà qualsiasi strategia e può anche essere utilizzato come strumento indipendente. IMPORTANTE! Contattami subito dopo l'acquisto per ricevere istruzioni e un bonus!  Vantaggi Facile da usare, non sovraccarica il grafico con informazioni non necessarie; Possibilità di utilizzo come filtro per qualsiasi strategia; Ha livelli integrati di supporto e resistenza dinamici, che possono essere utilizzati sia per la presa di profitto che per imposta
Golden Spikes Detector
Batsirayi L Marango
5 (1)
Golden Spikes Detector This indicator is based on an advanced strategy primarily for trading spikes on Boom and Crash Indices. Complex algorithms were implemented to detect high probability entries only. It alerts on potential Buy and Sell entries. To trade spikes on the Deriv or Binary broker, only take Buy Boom and Sell Cash alerts. It was optimised to be loaded on 5-minute timeframe although multiple timeframe analysis is done in the background. Features ·             Desktop pop up and sound
Matrix Arrow Indicator MT5
Juvenille Emperor Limited
5 (14)
Matrix Arrow Indicator MT5   è un trend unico 10 in 1 che segue un indicatore multi-timeframe al   100% non ridipinto   che può essere utilizzato su tutti i simboli/strumenti:   forex ,   materie prime ,   criptovalute ,   indici ,   azioni .  Matrix Arrow Indicator MT5  determinerà la tendenza attuale nelle sue fasi iniziali, raccogliendo informazioni e dati da un massimo di 10 indicatori standard, che sono: Indice di movimento direzionale medio (ADX) Indice del canale delle materie prime (CCI
IX Power MT5
Daniel Stein
5 (2)
IX Power   porta finalmente l'imbattibile precisione di FX Power ai simboli non-Forex. Determina con precisione l'intensità delle tendenze a breve, medio e lungo termine dei vostri indici preferiti, azioni, materie prime, ETF e persino criptovalute. Potete   analizzare tutto ciò che   il vostro terminale ha da offrire. Provatelo e sperimentate come   il vostro tempismo migliori significativamente   durante il trading. Caratteristiche principali di IX Power Risultati di calcolo precisi al
** All Symbols x All Timeframes scan just by pressing scanner button ** ***Contact me after purchase to send you instructions and add you in "123 scanner group" for sharing or seeing experiences with other users. After 15 years of experience in the markets and 3 years of programming, Winner indicator is ready. I would like to share with you! Introduction The 123 Pattern Scanner indicator with a special enhanced algorithm is a very repetitive common pattern finder with a high success rate . Inte
Altri dall’autore
Ti consiglio di leggere il       blog del prodotto   (manuale) dall'inizio alla fine in modo che       è chiaro fin dall'inizio cosa offre l'EA. La strategia principale di questo Expert Advisor (EA) è piazzare operazioni quando 3 medie mobili (MA) sono in allineamento consecutivo e ad una certa distanza l'una dall'altra (può essere utilizzata ad esempio per una strategia poco conosciuta utilizzata da alcuni trader istituzionali , che coinvolge le MA 10, 20 e 30 sulla fascia oraria D1). L'EA fun
I recommend you to read the   product's blog  (manual) from start to end so that it is clear from the beginning what the indicactor offers. This multi time frame and multi symbol indicator can identify the following 5 crosses: when a fast moving average crosses a slow moving average line. when price has reached a single moving average (closed above/below or just bounced). when a triple moving average formation has appeared (all 3 MA:s in consecutive alignment) when the MACD main line crosses th
Questo indicatore multi time frame e multi simbolo identifica formazioni alto/basso doppie o triple o un successivo breakout della scollatura (confermato alto/basso). Offre filtri RSI, pin bar, engulfing, tweezer, stelle del mattino/sera, nonché MACD, Awesome (AO) o filtri divergenza RSI che consentono di filtrare solo le configurazioni più forti.       L'indicatore può essere utilizzato anche in modalità grafico singolo. Si prega di leggere di più su questa opzione nel prodotto   blog .   Combi
I recommend you to read the   product's blog  (manual) from start to end so that it is clear from the beginning what the indicactor offers. This multi time frame and multi symbol divergence dashboard indicator sends an alert when one or two different divergences have been identified. It can be used with all time frames from M1 to MN. It is possible to enable moving average or RSI trend filter to filter out only the strongest setups. Combined with your own rules and techniques, this indicator wi
The indicator identifies when a divergence occurs between price and an indicator or oscillator. It identifies both regular and hidden divergences. Combined with your own rules and techniques, this indicator will allow you to create (or enhance) your own powerful system. Features Can detect divergences for the following oscillators/indicators:   MACD, OsMA, Stochastics, RSI, CCI, RVI, Awesome, ADX, ATR, OBV, Composite index, MFI and Momentum. Only one oscillator/indicator can be selected. Draws
FREE
Questo indicatore del dashboard di divergenza multi time frame e multi simbolo invia un avviso quando una o due divergenze diverse sono state identificate su più time frame e non su singole divergenze. Può essere utilizzato con tutte le fasce orarie da M1 a MN. È possibile visualizzare contemporaneamente nella dashboard un massimo di 9 intervalli di tempo. È possibile abilitare il filtro di tendenza della media mobile, dell'RSI o delle bande di Bollinger per filtrare solo le configurazioni più f
Questo indicatore della zona di domanda e offerta disegna le zone sul grafico e invia avvisi quando il prezzo ha raggiunto o rotto una zona. È anche possibile utilizzarlo per essere avvisati di doppi cime/basse regolari invece che di zone. È possibile utilizzare filtri RSI, volume e divergenza per filtrare solo le configurazioni più potenti. Combinato con le tue regole e tecniche, questo indicatore ti consentirà di creare (o migliorare) il tuo potente sistema. Questo indicatore è per il trader p
Questo indicatore di tendenza multi time frame e multi simbolo invia un avviso quando è stata identificata una forte tendenza o inversione di tendenza. Può farlo selezionando di costruire il cruscotto usando Media mobile (singola o doppia (crossover MA)), RSI, bande di Bollinger, ADX, indice composito (Constance M. Brown), Awesome (Bill Williams), MACD (linea di segnale ), Heiken Ashi livellato, media mobile di Hull, crossover stocastici, attivatore di Gann HiLo e indice dinamico dei trader. Può
This multi time frame and multi symbol indicator scans for pin bars. Combined with your own rules and techniques, this indicator will allow you to create (or enhance) your own powerful system. Features Can monitor all symbols visible in your Market Watch window at the same time. Apply the indicator to just one chart and instantly monitor the entire market. Can monitors every time frame, from M1 to MN, and sends you a real-time alert when a pin bar is identified. All Metatrader native alert types
I  recommend you to read the   product's blog  (manual) from start to end so that it is clear from the beginning what the indicator offers. This multi time frame and multi symbol indicator identifies double top/bottom, head & shoulders, pennant/triangle and flag patterns. It is also possible to setup alerts only when a neckline/triangle/flagpole breakout has occured (neckline breakout = confirmed signal for top/bottoms and head & shoulders).  The indicator can also be used in single chart mode.
Please if possible consider the  paid version  which I will continue to develop (there will be no future updates for this free version). This Expert Advisor identifies when a divergence occurs between price and an oscillator/indicator. It identifies both regular/classical (trend reversal) and hidden (trend continuation) divergences. It has RSI, bollinger, stochastics, moving average and ADX filter options which makes it possible to filter out only the strongest setups. The default settings ar
FREE
I  recommend you to read the   product's blog  (manual) from start to end so that it is clear from the beginning what the indicator offers. In addition to finding bullish and bearish Three line strike formations this multi symbol and mutli time frame indicator can also scan for the following candlestick patterns (please see screenshots for explanation of the patterns): Three white soldiers (reversal>continuation pattern) Three black crows (reversal>continuation pattern) The formations do not ap
Questo indicatore può inviare avvisi quando si verifica un cambiamento di colore Heiken Ashi Smoothed. Combinato con le tue regole e tecniche, questo indicatore ti permetterà di creare (o migliorare) il tuo potente sistema. Caratteristiche Può inviare tutti i tipi di avvisi. Possibilità di ritardare l'avviso di una o più barre per confermare il cambio colore (tendenza). Parametri di input Spostamento candela per avviso: l'impostazione predefinita è 1. Impostandolo su 0 ti avviserà del cambiament
FREE
Averaging down EA
Jan Flodin
5 (1)
This cost averaging Expert advisor (EA) places additional trades in the same direction as the original (manually opened) order when the price goes against you. It can be used as a grid system or as pure martingale system (exponential increasing of lot size) or smoothed martingale (for instance linear increasing of the lot size). Due to the risk involved, this EA is more suitable for intermediate to advanced traders who are well aware of how to handle risk management and trading an already profit
The indicator identifies when a divergence occurs between price and an indicator or oscillator. It identifies bullish and bearish hidden or regular (classical) divergences. Combined with your own rules and techniques, this indicator will allow you to create (or enhance) your own powerful system. Features Can detect divergences for the following indicators/oscillators: MACD, OsMA (Moving average of Oscillator), Stochastics, RSI, CCI, RVI, Awesome (AO), ADX, ATR, OBV, MFI, Momentum and   Composi
FREE
Ti consiglio di leggere il   blog (manuale) del prodotto   dall'inizio alla fine in modo che sia chiaro fin dall'inizio cosa offre EA. Questo Expert Advisor identifica quando si verifica una divergenza tra il prezzo e un oscillatore/indicatore. Identifica sia le divergenze regolari/classiche (inversione del trend) che quelle nascoste (continuazione del trend). Dispone di zona di domanda/offerta, RSI, bollinger, stocastico, media mobile (MA regolare e MA di Hull), ADX e opzioni di filtro del vol
Questo indicatore può inviare avvisi quando si verifica un cambiamento di colore Heiken Ashi Smoothed. Combinato con le tue regole e tecniche, questo indicatore ti permetterà di creare (o migliorare) il tuo potente sistema. Caratteristiche Può inviare tutti i tipi di avvisi. Possibilità di ritardare di una barra l'avviso per confermare il cambio colore (tendenza). Parametri di input Attendi la chiusura della candela:       'vero o falso'. Impostandolo su 'true' ritarderà l'avviso all'apertura de
FREE
Questo indicatore multi-time frame e multi-simbolo identifica i modelli doppio alto/basso, testa e spalla, gagliardetto/triangolo e bandiera. È anche possibile impostare avvisi solo quando si è verificato un breakout della scollatura/triangolo/asta della bandiera (breakout della scollatura = segnale confermato per la parte superiore/inferiore e testa e spalle).       L'indicatore può essere utilizzato anche in modalità grafico singolo. Si prega di leggere di più su questa opzione nel prodotto  
Questo indicatore multi time frame e multi simbolo identifica formazioni alto/basso doppie o triple o un successivo breakout della scollatura (confermato alto/basso). Offre RSI, pin bar, engulfing, tweezer, filtri a stella del mattino/sera e opzioni di filtro di divergenza che consentono di filtrare solo le configurazioni più forti.       L'indicatore può essere utilizzato anche in modalità grafico singolo. Si prega di leggere di più su questa opzione nel prodotto   blog .   Combinato con le tue
I recommend you to read the   product's blog  (manual) from start to end so that it is clear from the beginning what the indicactor offers. This multi time frame and multi symbol supply and demand zone dashboard indicator sends alerts when the price has reached a supply/demand zone. It is also possible to use it to be alerted about regular double tops/bottoms instead of zones. It can be used with all time frames from M1 to MN. It is possible to use RSI, divergence (MACD, OsMA, RSI or Awesome) a
I recommend you to read the  product's blog  (manual) from start to end so that it is clear from the beginning what the indicator offers. This multi time frame and multi symbol supply and demand zone dashboard indicator sends alerts when the price has reached a supply/demand zone. It is also possible to use it to be alerted about regular double tops/bottoms instead of zones. It can be used with all time frames from M1 to MN. Maximum 9 time frames can be shown in the dashboard at the same time. 
L'indicatore identifica quando si verifica una divergenza tra il prezzo e un oscillatore/indicatore. Identifica divergenze regolari e nascoste. Ha un'opzione di filtro RSI che consente di filtrare solo le configurazioni più potenti. L'indicatore offre anche opzioni per attendere una formazione Engulfing, un breakout del canale Donchian o che il prezzo superi una media mobile   (vedi screenshot n. 3)       per confermare la divergenza prima di segnalare l'opportunità commerciale. Combinato con le
Questo indicatore multi time frame e multi simbolo può identificare le seguenti 5 croci: quando una media mobile veloce attraversa una linea di media mobile lenta. quando il prezzo ha raggiunto una singola media mobile (chiusa sopra/sotto o rimbalzata). quando è apparsa una formazione a media mobile tripla (tutti e 3 i MA:s in allineamento consecutivo). quando la linea principale MACD attraversa la linea di segnale. quando la linea del segnale attraversa la linea MACD zero (0). Combinato con le
Per favore, se possibile, considera l'acquisto del       Versione MT5   che continuerò a sviluppare (non ci saranno aggiornamenti futuri per questa versione MT4). Ti consiglio anche di leggere il       blog del prodotto   (manuale) dall'inizio alla fine in modo che sia chiaro fin dall'inizio cosa offre EA. La strategia principale di questo Expert Advisor (EA) è quella di piazzare operazioni quando 3 medie mobili (MA) sono in allineamento consecutivo e ad una certa distanza l'una dall'altra (può
L'indicatore identifica quando si verifica una divergenza tra il prezzo e un oscillatore/indicatore. Identifica divergenze sia rialziste che ribassiste. Ha un'opzione di filtro RSI che consente di filtrare solo le configurazioni più forti. L'indicatore offre anche opzioni per attendere un breakout del canale Donchian o che il prezzo attraversi una media mobile (vedi screenshot n. 3) per confermare la divergenza prima di segnalare l'opportunità commerciale. Combinato con le tue regole e tecniche,
Questo indicatore multi time frame e multi simbolo esegue la scansione di barre pin, stelle del mattino/sera, engulfing, pinzette, colpi a tre linee, barre interne e gagliardetti e triangoli.   L'indicatore può essere utilizzato anche in modalità grafico singolo. Si prega di leggere di più su questa opzione nel prodotto   blog .   Combinato con le tue regole e tecniche, questo indicatore ti consentirà di creare (o migliorare) il tuo potente sistema. Caratteristiche Può monitorare contemporaneam
This multi time frame and multi symbol indicator scans for Pin bars, Morning/Evening stars, Engulfings, Tweezers, Three line strikes, Inside bars and Pennants and Triangles. The indicator can also be used in single chart mode. Please read more about this option in the product's blog . Combined with your own rules and techniques, this indicator will allow you to create (or enhance) your own powerful system. Features Can monitor all symbols visible in your Market Watch window at the same time. Ap
Questo indicatore multi time frame e multi simbolo identifica quando la linea del segnale stocastico attraversa la linea principale stocastica. Come bonus può anche eseguire la scansione delle bande di Bollinger e dei cross RSI ipercomprato/ipervenduto. Combinato con le tue regole e tecniche, questo indicatore ti permetterà di creare (o migliorare) il tuo potente sistema. Caratteristiche Può monitorare contemporaneamente tutti i simboli visibili nella finestra Market Watch. Applica l'indicatore
This multi indicator/oscillator (hereafter indicator), multi time frame and multi symbol indicator identifies when a divergence occurs between price and one, two or three indicators. It identifies both regular/classical (trend reversal) and hidden (trend continuation) divergences. It has RSI and MA trend filter options which makes it possible to filter out only the strongest setups. Combined with your own rules and techniques, this indicator will allow you to create (or enhance) your own powerfu
This multi time frame and multi symbol indicator identifies fractals patterns. As a bonus it can also scan for Parabolic SAR (pSAR) trend changes. Combined with your own rules and techniques, this indicator will allow you to create (or enhance) your own powerful system. Features Can monitor all symbols visible in your Market Watch window at the same time. Apply the indicator to just one chart and instantly monitor the entire market. Can monitor every time frame, from M1 to MN, and sends you a
Filtro:
Nessuna recensione
Rispondi alla recensione
Versione 1.1 2020.07.26
- added an option to disable showing of the text under the lines