• Panoramica
  • Recensioni
  • Commenti

MTF Candlestick for MT5

MTF-Candlestick (Traders Club)


特徴:
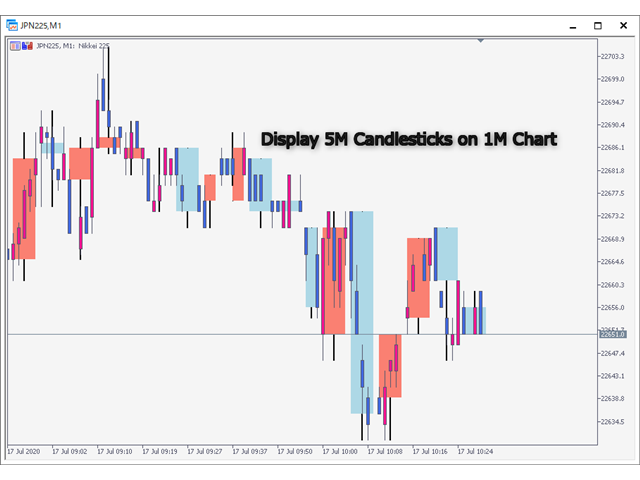
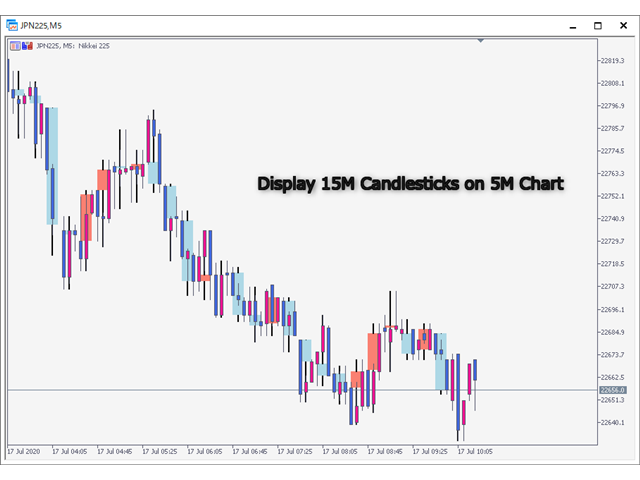
このインジケータは上位足のローソク足を表示します。
この上位足のローソク足を表示のインジケータは特に1分足や
5分足トレーダ用に開発されたものになります。

現在のローソク足で上位足のローソク足を作成する部分
と過去の上位足のローソク足を作成する部分を
分けています。また、更新はティックごとではなく
指定した時間ごとになるので急な価格変動があった場合でも
チャートがフリーズした状態には非常になりにくいということになります。

陽線や陰線の色を変更出来たり髭の太さを変更できるので非常に
見やすと思います。


各パラメータの説明:
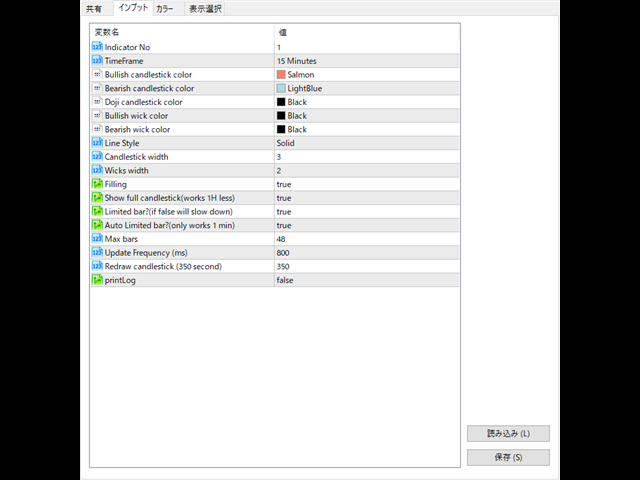
■Indicator No:インジケータNoを設定します。もし同じチャートに複数適用したい場合には個々の数字を変更してください。
■TimeFrame:表示する時間足を設定します。
■Bullish candlestick color:陽線のローソク足の色の指定します。
■Bearish candlestick color:陰線のローソク足の色の指定します。
■Doji candlestick color:十字線のローソク足の色の指定します。
■Bullish wick color:上髭の色の指定します。
■Bearish wick color:下髭の色の指定します。
■Line Style:ローソク足で使用されてるラインの種類を設定します。
■Candlestick width:ローソク足で使用されてるラインの太さを設定します。
■Wicks width:髭の幅を設定します。
■Filling:ローソク足内を指定した色で書き込むか設定します。
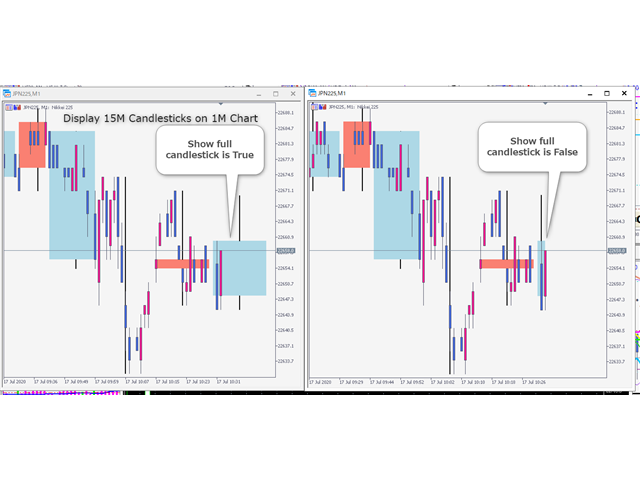
■Show full candlestick(works 1H less):上位足のローソク足を事前に表示するのかを設定します。
これによりあとどのくらいの時間で上位足が作成できるのか確認できます。
■Limited bar?(if false will slow down):表示に使用するバーを制限するかどうかを設定します。
※ここをFalseにするとすべての上位足のローソク足を作成するのでチャートが重く
なるかもしれません。
■Auto Limited bar?(only works 1 min):画面表示に必要な本数を計算し上位足のローソク足を作成
します。こちらは1分足のみで対応しています。
■Max bars:表示するバーの本数を設定します。
■Update Frequency (ms):上位足作成の頻度をマイクロセカンドで設定します。
■Redraw candlestick (350 second):過去のローソク足の再書き込みの処理頻度を設定します。
■printLog:ログの出力を設定します。
Prodotti consigliati
PipFinite Binary Options PRO MT5
Karlo Wilson Vendiola
4.65 (17)
This LEGIT Indicator Can Accurately Predict the Outcome of One Bar. Imagine adding more filters to further increase your probability! Unlike other products, Binary Options PRO can analyze past signals giving you the statistical edge. How Increase Your Probability Information revealed here www.mql5.com/en/blogs/post/727038 NOTE: The selection of a Good Broker is important for the overall success in trading Binary Options. Benefits You Get Unique algorithm that anticipates price weaknes
This indicator allows you to enjoy the two most popular products for analyzing request volumes and market deals at a favorable price: Actual Depth of Market Chart Actual Tick Footprint Volume Chart This product combines the power of both indicators and is provided as a single file. The functionality of Actual COMBO Depth of Market AND Tick Volume Chart is fully identical to the original indicators. You will enjoy the power of these two products combined into the single super-indicator! Below is
This is a multi-symbol and multi-timeframe table-based indicator designed for a candlestick patterns detection with 46 patterns for META TRADER 5. Each formation has own image for easier recognition. Here you find most popular formations such as "Engulfing", "Hammer", "Three Line Strike", "Piercing" or Doji - like candles. Check my full list of patterns on my screenshots below. Also you can not only switch all bearish or bullish patterns from input, but also select formation for a specified symb
US30NinjaMT5
Satyaseelan Shankarananda Moodley
US30 Ninja is a 5 minute scalping indicator that will let know you when there is a trade set up (buy or sell). Once the indicator gives the trade direction, you can open a trade and use a 30 pip stop loss and a 30 pip to 50 pip take profit. Please trade at own own risk. This indicator has been created solely for the US30 market and may not yield positive results on any other pair. 
Supply Demand Ranger
Krzysztof Janusz Stankiewic
5 (2)
The indicator draws supply and demand zones. The zone timeframe can be set independently of the chart timeframe. For instance, it is possible to set M5 zones on an H4 chart. The importance of zones can be adjusted using the zone strength parameter. Demand zones are displayed if at least one candle in the range of the zone is entirely above the zone. Similarly, supply zones are displayed if at least one candle within the zone is entirely below the zone.
This plots  Fibonacci deviation levels above and below a moving average of the price. Companion indicator to the " Golden Bull Wave Trader "  expert advisor which uses volume\price trend to determine price reversals. https://www.mql5.com/en/market/product/56291 The expert advisor and this indicator were created in order to: Identify ideal and repeatable trade entries with high level of certainty Create a day trading strategy which doesn’t require a hard SL and TP Use alternate risk management me
Rainbow EA MT5
Jamal El Alama
Description : Rainbow EA MT5 is a simple Expert advisor based on   Rainbow MT5 indicator witch is based on Moving average with period 34. The indicator is incorporated in the EA, therefore, it is not required for the EA to operate, but if you wish, you can download it from   my product page . The Expert Advisor settings are as follows : Suitable for Timeframes up to H1 The parameters below can be set according to your trading rules. StopLoss ( Stop Loss in pips) TakeProfit ( Take Profit in pi
Magic Channel Scalper è un indicatore di canale per il terminale MetaTrader 5. Questo indicatore consente di individuare i punti di inversione di tendenza più probabili. A differenza della maggior parte degli indicatori di canale, Magic Channel Scalper non viene ridisegnato. Il sistema di allerta (avvisi, e-mail e notifiche push) ti aiuterà a monitorare contemporaneamente più strumenti di trading. Collega l'indicatore a un grafico e l'avviso si attiverà quando emerge un segnale. Con il
The Gann Box (or Gann Square) is a market analysis method based on the "Mathematical formula for market predictions" article by W.D. Gann. This indicator can plot three models of Squares: 90, 52(104), 144. There are six variants of grids and two variants of arcs. You can plot multiple squares on one chart simultaneously. Parameters Square — selection of a square model: 90 — square of 90 (or square of nine); 52 (104) — square of 52 (or 104); 144 — universal square of 144; 144 (full) — "full"
Volume by Price MT5
Brian Collard
5 (3)
The Volume by Price Indicator for MetaTrader 5 features Volume Profile and Market Profile TPO (Time Price Opportunity). Get valuable insights out of currencies, equities and commodities data. Gain an edge trading financial markets. Volume and TPO histogram bar and line charts. Volume Footprint charts. TPO letter and block marker charts including split structures. Versatile segmentation and compositing methods. Static, dynamic and flexible ranges with relative and/or absolute visualizations. Lay
This is advanced Multi-Symbol and Multi-Timeframe version of the "Candle Pattern Finder" indicator (search for candlestick patterns based on the book by Gregory L. Morris "Candlesticks charting explained. Timeless techniques for trading stocks and futures" ). The indicator searches for candlestick patterns for ALL symbols of the "Market Watch" window and for ALL standard timeframes from M1 to MN1. When patterns appear on any symbol / timeframe, the indicator gives a signal (text, sound, sending
FXC iMACD-DivergencE MT5 Indicator This is an advanced MACD indicator that finds trend-turn divergences on the current symbol. The indicator detects divergence between the MACD and the price movements as a strong trend-turn pattern. Main features: Advanced divergence settings Price based on Close, Open or High/Low prices Give Buy/Sell open signals PUSH notifications E-mail sending Pop-up alert Customizeable Information panel Input parameters: MACD Fast-EMA: The Fast-EMA variable of the MACD
Vict Channel
Tatiana Savkevych
Victory Channel is a forex trend arrow indicator for identifying potential entry points. I like it, first of all, because it has a simple mechanism of work, adaptation to all time periods and trading tactics. Created on the basis of a regression channel with filters. We display the signals of the Victory Channel indicator on the chart of the price function using a mathematical approach. How it works - when the price breaks through the overbought/oversold zone (channel levels), a buy or sell s
An indicator of pattern #31 ("Long Island") from Encyclopedia of Chart Patterns by Thomas N. Bulkowski. The second gap is in the opposite direction. Parameters: Alerts - show alert when an arrow appears   Push - send a push notification when an arrow appears (requires configuration in the terminal) GapSize - minimum gap size in points ArrowType - a symbol from 1 to 17 ArrowVShift - vertical shift of arrows in points   ShowLevels - show levels ColUp - color of an upward line ColDn - color of a
This indicator provides an original mix of WPR, VSA, and volume delta. It shows ratio of buy/sell volumes scaled on 100% range based on total volume change for a selected period. The convetional VSA (Volume Spread Analysis) studies interconnections of price action and volume change in absolute values, whereas WPR (Williams Percent Range) offers a convenient approach of price moves normalization into the fixed percentage metric: 0 - 100%. Hence overbough and oversold states are easily spotted. N
A machine translation from the English product description was used. We apologize for possible imprecisions. È stata utilizzata una traduzione automatica dalla descrizione del prodotto in inglese. Ci scusiamo per eventuali imprecisioni. Un sistema di visualizzazione per i modelli di azione dei prezzi dei candelieri preferiti. Una volta collegato, l'indicatore segnerà automaticamente i modelli successivi sul grafico: Pinocchio bar  - un bar piccolo corpo con un lungo "naso", molto noto motivo inv
Exclusive Limited Time Offer! Grab this useful indicator for a lifetime at just $49. Note: It is requested that purchases must be refrained from if the buyer is from India, Bangladesh, or Pakistan, as developer support for these regions is unavailable due to legal restrictions. Volatility indicator dashboard designed to revolutionize how traders perceive and navigate market volatility. Track volatile for multiple currency pairs one at time for multiple timeframes. Works best with Forex Market,
PipFinite Exit EDGE MT5
Karlo Wilson Vendiola
4.89 (35)
Did You Have A Profitable Trade But Suddenly Reversed? In a solid strategy, exiting a trade is equally important as entering. Exit EDGE helps maximize your current trade profit and avoid turning winning trades to losers. Never Miss An Exit Signal Again Monitor all pairs and timeframes in just 1 chart www.mql5.com/en/blogs/post/726558 How To Trade You can close your open trades as soon as you receive a signal Close your Buy orders if you receive an Exit Buy Signal. Close your Sell orde
The professional tool of stock traders in now available on MetaTrader 5 . The Actual depth of market chart indicator visualizes the depth of market in the form of a histogram displayed on a chart, which refreshes in the real-time mode. Meet new updates according to user requests! Now Actual Depth of Market indicator displays the current ratio of volume of buy and sell requests (B/S ratio). It shows the share of volume of each type of requests in the entire flow of requests as well as the absol
Fractal 358 Plus
Renato Fridschtein
Fractal 358 Plus is a predictive indicator that provides the clearest sight of price movements. Identifying graphic patterns such as Caixote (Crate), Pivot and Inside Candle , it shows entries and exits spots, as well as threats to your trades in the markets. It comes ready to use with B3 Mini Index (WIN$ series) and can be adjusted to use with any asset and timeframe. Fractal 358 unravels price movement Based on the Fibonacci sequence, Fractal 358 is a new and different way of reading and un
AW Candle Patterns
AW Trading Software Limited
L'indicatore AW Candle Patterns è una combinazione di un indicatore di tendenza avanzato combinato con un potente scanner di modelli di candele. È uno strumento utile per riconoscere ed evidenziare i trenta modelli di candele più affidabili. Inoltre, è un analizzatore di trend attuale basato su barre colorate con a       pannello di trend multi-timeframe plug-in che può essere ridimensionato e posizionato. Una capacità unica di regolare la visualizzazione dei modelli in base al filtraggio delle
The San Andres Fault   is an indicator designed to detect the movements that make the market tremble. This system detects a tremor and marks its intensity in real time to decide in your operation. In addition, the recording of the sismic signal allows us to interpret movement patterns that help us in decision making You can download the demo and test it yourself. The indicator has a text help in the upper right corner, in which it shows whether the indicator has a   bullish   or   bearish   b
Seconds Bars
Andrej Nikitin
The indicator displays in a separate window a price chart as bars or Japanese candlesticks with a periodicity below a minute. Available periods (seconds): 30, 20, 15, 12, 10, 6, 5, 4, 3, 2, 1. The display mode (bars or candlesticks) is switched by clicking on the chart. Parameters Period in seconds - the period of bars in seconds Price levels count - the number of price levels on a chart Buffer number: 0 - Open, 1 - High, 2 - Low, 3 - Close, 4 - Color.
Volality Index Scalper
Lesedi Oliver Seilane
Volality Index scalper indicator  Meant for Volality pairs such as Volality 10, 25, 50, 75 and 100 The indicator works on all timeframes from the 1 minute to the monthly timeframe the indicator is non repaint the indicator has 3 entry settings 1 color change on zero cross 2 color change on slope change 3 color change on signal line cross Orange line is your sell signal Blue line is your buy signal.
The indicator shows the trend of 3 timeframes: higher timeframe; medium timeframe; smaller (current) timeframe, where the indicator is running. The indicator should be launched on a chart with a timeframe smaller than the higher and medium ones. The idea is to use the trend strength when opening positions. Combination of 3 timeframes (smaller, medium, higher) allows the trend to be followed at all levels of the instrument. The higher timeframes are used for calculations. Therefore, sudden change
Owl Smart Levels MT5
Sergey Ermolov
4.47 (36)
Versione MT4  |  FAQ L' indicatore Owl Smart Levels è un sistema di trading completo all'interno dell'unico indicatore che include strumenti di analisi di mercato popolari come i frattali avanzati di Bill Williams , Valable ZigZag che costruisce la corretta struttura a onde del mercato, e i livelli di Fibonacci che segnano i livelli esatti di entrata nel mercato e luoghi per prendere profitti. Descrizione dettagliata della strategia Istruzioni per lavorare con l'indicatore Consulente-assistente
Big Candle Detect
Guilherme Guimaraes Dias
The indicator, Big Candle Detect , is based on ATR and Volume to detect candlesticks of buying and selling strength, which is represented through an oscillator indicator. With this indicator you will be able to identify the lateral market, providing better entries according to your strategy. Big Candle Detect highlights candles with brighter colors when the condition is found, making it easier to identify, in addition to being fully compatible for automation in your EA. SETTINGS ATR P
Welcome to the Ultimate Harmonic Patterns recognition indicator that is focused to detect advanced patterns. The Gartley pattern, Bat pattern, and Cypher pattern  are popular technical analysis tools used by traders to identify potential reversal points in the market. Our Ultimate Harmonic Patterns recognition Indicator is a powerful tool that uses advanced algorithms to scan the markets and identify these patterns in real-time. With our Ultimate Harmonic Patterns recognition Indicator, you
Pipfinite creates unique, high quality and affordable trading tools. Our tools may or may not work for you, so we strongly suggest to try the Demo Version for MT4 first. Please test the indicator prior to purchasing to determine if it works for you. We want your good reviews, so hurry up and test it for free...we hope you will find it useful. Combo Swing Control with Energy Beam Strategy: Confirm swing pullback signals Watch Video: (Click Here) Features Detects overall bias and waits for ove
Supply demand zoning
Oluwatosin Isaac Omotayo
After forming a New Structure High the market will retrace creating a higher low. When this movement occurs, that NSH's now become an area of structure called  resistance . As price action pushes up from the newly created higher lows, that resistance level becomes the last stand for sellers to stop the buyers from rallying.    IF the resistance level cannot be penetrated, THEN it's likely that we'll see either a period of consolidation or a reversal in trend. IF price action breaks through
Gli utenti di questo prodotto hanno anche acquistato
Innanzitutto è importante sottolineare che questo sistema di trading è un indicatore Non-Repainting, Non-Redrawing e Non-Lagging, il che lo rende ideale sia per il trading manuale che per quello automatico. Il "Sistema di Trading Smart Trend MT5" è una soluzione completa pensata sia per i trader principianti che per quelli esperti. Combina oltre 10 indicatori premium e offre più di 7 robuste strategie di trading, rendendolo una scelta versatile per diverse condizioni di mercato. Strategia di Tre
Atomic Analyst MT5
Issam Kassas
5 (11)
Innanzitutto, vale la pena sottolineare che questo indicatore di trading non è repaint, non è ridisegno e non presenta ritardi, il che lo rende ideale sia per il trading manuale che per quello automatico. L'Analista Atomico è un indicatore di azione del prezzo PA che utilizza la forza e il momentum del prezzo per trovare un miglior vantaggio sul mercato. Dotato di filtri avanzati che aiutano a rimuovere rumori e segnali falsi, e aumentare il potenziale di trading. Utilizzando più strati di in
Quantum Trend Sniper
Bogdan Ion Puscasu
5 (37)
Presentazione       Quantum Trend Sniper Indicator   , l'innovativo indicatore MQL5 che sta trasformando il modo in cui identifichi e scambi le inversioni di tendenza! Sviluppato da un team di trader esperti con un'esperienza di trading di oltre 13 anni,       Indicatore Quantum Trend Sniper       è progettato per spingere il tuo viaggio di trading verso nuove vette con il suo modo innovativo di identificare le inversioni di tendenza con una precisione estremamente elevata. *** Acquista Quant
FX Volume MT5
Daniel Stein
4.94 (17)
Ricevi il tuo aggiornamento quotidiano sul mercato con dettagli e schermate tramite il nostro Morning Briefing qui su mql5 e su Telegram ! FX Volume è il PRIMO e UNICO indicatore di volume che fornisce una visione REALE del sentiment del mercato dal punto di vista del broker. Fornisce informazioni straordinarie su come gli operatori di mercato istituzionali, come i broker, sono posizionati sul mercato Forex, molto più velocemente dei rapporti COT. Vedere queste informazioni direttamente sul vo
Trend Screener Pro MT5
STE S.S.COMPANY
4.89 (61)
Indicatore di tendenza, soluzione unica rivoluzionaria per il trading di tendenze e il filtraggio con tutte le importanti funzionalità di tendenza integrate in un unico strumento! È un indicatore multi-timeframe e multi-valuta al 100% non ridipingibile che può essere utilizzato su tutti i simboli/strumenti: forex, materie prime, criptovalute, indici e azioni. Trend Screener è un indicatore di tendenza che segue un indicatore efficiente che fornisce segnali di tendenza a freccia con punti nel gra
FX Power MT5 NG
Daniel Stein
5 (4)
Ricevi il tuo aggiornamento quotidiano sul mercato con dettagli e schermate tramite il nostro Morning Briefing qui su mql5 e su Telegram ! FX Power MT5 NG è la nuova generazione del nostro popolare misuratore di forza delle valute, FX Power. Cosa offre questo misuratore di forza di nuova generazione? Tutto ciò che avete amato dell'FX Power originale IN PIÙ Analisi della forza di ORO/XAU Risultati di calcolo ancora più precisi Periodi di analisi configurabili individualmente Limite di calcolo pe
Top indicator for MT5   providing accurate signals to enter a trade without repainting! It can be applied to any financial assets:   forex, cryptocurrencies, metals, stocks, indices .  Watch  the video  (6:22) with an example of processing only one signal that paid off the indicator! MT4 version is here It will provide pretty accurate trading signals and tell you when it's best to open a trade and close it. Most traders improve their trading results during the first trading week with the help of
Innanzitutto, vale la pena sottolineare che questo Strumento di Trading è un Indicatore Non-Ridipingente, Non-Ridisegnante e Non-Laggante, il che lo rende ideale per il trading professionale. L'Indicatore Smart Price Action Concepts è uno strumento molto potente sia per i nuovi che per i trader esperti. Racchiude più di 20 utili indicatori in uno solo, combinando idee di trading avanzate come l'Analisi del Trader del Circolo Interno e le Strategie di Trading dei Concetti del Denaro Intelligen
RelicusRoad Pro MT5
Relicus LLC
4.82 (22)
Ora $ 147 (aumentando a $ 499 dopo alcuni aggiornamenti) - account illimitati (PC o MAC) Manuale utente di RelicusRoad + Video di formazione + Accesso al gruppo Discord privato + Stato VIP UN NUOVO MODO DI GUARDARE IL MERCATO RelicusRoad è l'indicatore di trading più potente al mondo per forex, futures, criptovalute, azioni e indici, fornendo ai trader tutte le informazioni e gli strumenti di cui hanno bisogno per rimanere redditizi. Forniamo analisi tecniche e piani di trading per aiutar
Auto Order Block with break of structure based on ICT and Smart Money Concepts Futures Break of Structure ( BoS )             Order block ( OB )            Higher time frame Order block / Point of Interest ( POI )    shown on current chart           Fair value Gap ( FVG ) / Imbalance   ,  MTF      ( Multi Time Frame )    Volume Imbalance     ,  MTF          vIMB Gap’s Equal High / Low’s     ,  MTF             EQH / EQL Liquidity               Current Day High / Low           HOD /
AW Trend Predictor MT5
AW Trading Software Limited
4.76 (55)
La combinazione di trend e livelli di rottura in un unico sistema. Un algoritmo di indicatore avanzato filtra il rumore del mercato, determina la tendenza, i punti di ingresso e i possibili livelli di uscita. I segnali indicatori sono registrati in un modulo statistico, che permette di selezionare gli strumenti più adatti, mostrando l'efficacia dello storico dei segnali. L'indicatore calcola i segni Take Profit e Stop Loss. Manuale e istruzioni ->   QUI   / versione MT4 ->   QUI Come fare tradi
Blahtech Supply Demand MT5
Blahtech Limited
4.57 (14)
Was: $299  Now: $99   Supply Demand uses previous price action to identify potential imbalances between buyers and sellers. The key is to identify the better odds zones, not just the untouched ones. Blahtech Supply Demand indicator delivers functionality previously unavailable on any trading platform. This 4-in-1 indicator not only highlights the higher probability zones using a multi-criteria strength engine, but also combines it with multi-timeframe trend analysis, previously confirmed swings
ICT, SMC, SMART MONEY CONCEPTS, SMART MONEY, Smart Money Concept, Support and Resistance, Trend Analysis, Price Action, Market Structure, Order Blocks, BOS/CHoCH,   Breaker Blocks ,  Momentum Shift,   Supply&Demand Zone/Order Blocks , Strong Imbalance,   HH/LL/HL/LH,    Fair Value Gap, FVG,  Premium  &   Discount   Zones, Fibonacci Retracement, OTE, Buy Side Liquidity, Sell Side Liquidity, BSL/SSL Taken, Equal Highs & Lows, MTF Dashboard, Multiple Time Frame, BigBar, HTF OB, HTF Market Structure
L'indicatore Quadrato di Gann è uno strumento potente di analisi di mercato basato sull'articolo "Formula Matematica per le Previsioni di Mercato" scritto da W.D. Gann. Questo strumento utilizza concetti matematici e teorie di Gann per effettuare un'analisi precisa del mercato. Utilizza i quadrati di 144, 90, 52 e anche il quadrato di 9. Inoltre, integra il metodo del  per il quadrato di 9 e la sua relazione con canali e modelli stellari di quel quadrato. Manuale Utente e Applicazione: Prima di
TPSproTREND PrO MT5
Roman Podpora
5 (5)
TPSpro TRENDPRO  - is a trend indicator that automatically analyzes the market and provides information about the trend and each of its changes, as well as giving signals for entering trades without redrawing! The indicator uses each candle, analyzing them separately. referring to different impulses - up or down impulse. Exact entry points into transactions for currencies, crypto, metals, stocks, indices!  -  Version MT4                  DETAILED DESCRIPTION        /       TRADING SETUPS       
Advanced Supply Demand MT5
Bernhard Schweigert
4.53 (15)
La migliore soluzione per qualsiasi principiante o trader esperto! Questo indicatore è uno strumento di trading unico, di alta qualità e conveniente perché abbiamo incorporato una serie di funzionalità proprietarie e una nuova formula. Con questo aggiornamento, sarai in grado di mostrare fusi orari doppi. Non solo potrai mostrare una TF più alta, ma anche entrambe, la TF del grafico, PIÙ la TF più alta: SHOWING NESTED ZONES. Tutti i trader di domanda di offerta lo adoreranno. :) Informazioni imp
Disegna automaticamente i livelli di supporto e resistenza PIÙ i gap delle candele di propulsione sul vostro grafico, in modo da poter vedere dove il prezzo potrebbe dirigersi successivamente e/o potenzialmente invertire. Questo indicatore è stato progettato per essere utilizzato come parte della metodologia di trading di posizione insegnata sul mio sito web (The Market Structure Trader) e visualizza informazioni chiave per il targeting e le potenziali entrate. MT4 Version:  https://www.mql5.
A key element in trading is zones or levels from which decisions to buy or sell a trading instrument are made. Despite attempts by major players to conceal their presence in the market, they inevitably leave traces. Our task was to learn how to identify these traces and interpret them correctly. Reversal First Impulse levels (RFI)   -  Version MT4                  INSTRUCTIONS                 RUS                 ENG                         R ecommended to use with an indicator   -  TREND PRO  
Il profitto dalla struttura del mercato cambia quando il prezzo si inverte e si ritira. L'indicatore di avviso di inversione della struttura del mercato identifica quando una tendenza o un movimento di prezzo si sta avvicinando all'esaurimento e pronto a invertire. Ti avvisa dei cambiamenti nella struttura del mercato che in genere si verificano quando stanno per verificarsi un'inversione o un forte pullback. L'indicatore identifica inizialmente i breakout e lo slancio del prezzo, ogni volta
Presentazione       Quantum Breakout PRO   , l'innovativo indicatore MQL5 che sta trasformando il modo in cui scambi le zone di breakout! Sviluppato da un team di trader esperti con un'esperienza di trading di oltre 13 anni,       Quantum Breakout PRO       è progettato per spingere il tuo viaggio di trading a nuovi livelli con la sua strategia innovativa e dinamica della zona di breakout. Quantum Breakout Indicator ti fornirà frecce di segnalazione sulle zone di breakout con 5 zone target
TrendLine PRO MT5
Evgenii Aksenov
4.78 (49)
The Trend Line PRO indicator is an independent trading strategy. It shows the trend change, the entry point to the transaction, as well as automatically calculates three levels of Take Profit and Stop Loss protection Trend Line PRO is perfect for all Meta Trader symbols: currencies, metals, cryptocurrencies, stocks and indices Advantages of Trend Line PRO Never redraws its signals The possibility of using it as an independent strategy It has three automatic levels Take Profit and Stop Loss lev
XQ Indicator MetaTrader 5
Marzena Maria Szmit
5 (1)
Step into the realm of Forex trading with confidence and precision using XQ, a cutting-edge Forex indicator designed to elevate your trading game to unprecedented heights. Whether you're a seasoned trader or just stepping into the world of currency exchange, XQ Forex Indicator empowers you with the insights and signals needed to make informed trading decisions. The signal conditions are a combination of three indicators, and XQ Forex Indicator only display  medium and long-term trends . The ind
Trend Line Map Pro MT5
STE S.S.COMPANY
4.67 (9)
Trend Line Map indicator is an addons for   Trend Screener Indicator . It's working as a scanner for all signals generated by Trend screener ( Trend Line Signals ) . It's a Trend Line Scanner based on Trend Screener Indicator.  If you don't have Trend Screener Pro Indicator,   the Trend Line Map Pro will not work.     LIMITED TIME OFFER : Trend Line Map Indicator is available for only 50 $ and lifetime. ( Original price 125$ ) By accessing to our MQL5 Blog,  you can find all our premium indica
TrendDecoder Premium MT5
Christophe, Pa Trouillas
5 (1)
Identificare i range e le prossime mosse probabili     |    Ottenere i primi segnali e la forza delle tendenze     |    Ottenere uscite chiare prima dell'inversione     |    Individuare i livelli di Fibo che il prezzo testerà   |  Indicatore non tracciante e non ritardato - ideale per il trading manuale e automatizzato - adatto a tutti gli asset e a tutte le unità temporali 50% di sconto   - per il lancio poi torna a   >>   149 $ Dopo l'acquisto,   contattatemi su questo canale  per le impostazi
MetaBands M5
Vahidreza Heidar Gholami
4.67 (3)
MetaBands uses powerful and unique algorithms to draw channels and detect trends so that it can provide traders with potential points for entering and exiting trades. It’s a channel indicator plus a powerful trend indicator. It includes different types of channels which can be merged to create new channels simply by using the input parameters. MetaBands uses all types of alerts to notify users about market events. Features Supports most of the channel algorithms Powerful trend detection algorith
Was: $249  Now: $99   Market Profile defines a number of day types that can help the trader to determine market behaviour. A key feature is the Value Area, representing the range of price action where 70% of trading took place. Understanding the Value Area can give traders valuable insight into market direction and establish the higher odds trade. It is an excellent addition to any system you may be using. Inspired by Jim Dalton’s book “Mind Over Markets”, this indicator is designed to suit the
Malaysian SNR Levels
Matthias Horst Pieroth
This indicator can be used to display Support and Resistance levels according to  the  Malaysian SNR concept , in which Support and Resistance are exact levels of a line chart. Malaysian SNR There are 3 different horizontal levels in Malaysian SNR: A-Level : This level is located at the peak of this line chart. (shape looks like the letter A) V-Level : Level at the valley of a line chart, (shape looks like the letter V) Gap-Leve l: This level is located at the Close/Open gap between two cand
ICT Silver Bullet MT5
Haidar, Lionel Haj Ali
5 (19)
ICT Silver Bullet If you are searching for a reliable indicator to trade the ICT Silver Bullet concept, or ICT concepts, Smart Money Concepts, or SMC, this indicator will respond to your need!  Before version 2.2, this indicator was focused only on ICT Silver Bullet, but moving forward, we will include the different elements for smart money concept trading. This indicator will help you identify the following: FVG - fair value gaps Market structure: BOS and CHOCH. It is based on ZIGZAG as it is
Account Graph MT5
Kyra Nickaline Watson-gordon
5 (1)
An indicator to draw a graph of account current and historical state such as Balance, Equity, Margin, Free Margin, Margin Level, Drawdown, Account Profit, Deposit and Withdrawals. Indicator Inputs : Draw Balance Graph Draw Equity Graph Draw Margin Graph Draw Free Margin Graph Draw Margin Level Graph Draw Drawdown Graph Draw Account Profit Graph Hide Data on Chart and Buffers Connect Gaps by Lines Sign of DDs on Profit Sign of DDs on Loss Tips : The Indicator will draw historical balance gra
TPA True Price Action indicator reveals the true price action of the market makers through 100% non-repainting signals strictly at the close of a candle! TPA shows entries and re-entries, every time the bulls are definitely stronger than the bears and vice versa. Not to confuse with red/green candles. The shift of power gets confirmed at the earliest stage and is ONE exit strategy of several. There are available now two free parts of the TPA User Guide for our customers. The first "The Basics"
Altri dall’autore
MT4/MT5トレードを簡単にコピー!使いやすい取引ツールで取引方向や数量を自在に同期   MT4 & MT5 TC-CTrades EA (取引コピーツール) このツールを使えば、MetaTrader 4(MT4)とMetaTrader 5(MT5)のアカウント間で取引を、好きな方向や数量で手軽にコピーできます。 デモ環境で動作するツールは こちらから 以下のMT4およびMT5間でのコピーが可能になります。 MT5 ↔ MT5 MT4 ↔ MT4 MT5 ↔ MT4 MT4 ↔ MT5 ※MT5にコピーするには MT5 Copy Trades Tool が必要になります。 主な機能: 1 つのツールで動作モード [マスター] または [スレーブ] を選択できます。 1つの「マスター」アカウントが複数の「スレーブ」アカウントに取引をコピーできます。 MetaTrader 4 - MetaTrader 5 間およびヘッジの注文/ポジションをコピーできます。 ※ネッティングには対応しておりません。 SL および TPもコピー されます。 マスター側で設定したB
このEAを使用することによりワンクリックによる決済、 決済したい通貨のチャートに適用しておけば様々な条件で自動で 決済することが可能になります。 パフォーマンスを考慮しているので動作が非常に軽いです。 新機能:Ver2.3 設定した利益以上になるとSLが建値(BE)に設定 新機能:Ver2.0 資金管理による買いや売りエントリ トレード毎に自動スクリーンショット取得 詳細な情報はこちらにサイトがあります。 https://toushika.top/tc-panel-for-mt5/ 機能: ワンクリックによる全通貨決済 ワンクリックによる表示上の通貨決済 分かりやすいPips表示 移動可能 全通貨での合計Pips表示 自動利確、損切り設定 設定以上のスプレッドになった場合には画面の色が変化 Break Evenラインの表示 チャート画像の保存 決済の通知機能(Email,SNS) パネル位置指定 Pips表示消去 他の通貨で設定した水平線で決済 下記に示した条件での利確 条件による決済:
新機能:Ver3.5 28通貨ペアの強弱も表示するようにしました。 監視ペアで最強、最弱の通貨ペアとなった場合、四つ葉のマークが出るように変更しました。 15分足、1時間足、4時間足単位での通貨ペアの強弱を表示するようにしました。 詳細な情報はこちらにサイトがあります。 https://toushika.top/tc-cs-plus-cfd/ 注:こちらはTitanのデモ口座で動作します。 XMで使用したい場合は こちらのでセットファイル を使用してください。 機能: 一目で現在の通貨の方向性と強弱が確認できます。 15M,1H,4Hでの方向性を表示します。 15M,1H,4Hでの方向が揃った場合にドットが表示されます。 通貨の相関が揃った場合にドットが表示されます。 ※相関はピアソン相関係数を使用しています。 より詳しい情報につきましてはこちらを参照してください。 https://www.mql5.com/ja/articles/5481 通貨の強弱を表示します。 現時点でのボラリティーの状況を表示します。 過去20日/過去5日/今日のボラリティーを
TrendBar
Koji Kobayashi
5 (4)
パラボリックのデータをもとにトレンドの方向性を1分足から月足まで表示します。 1分足から 月足 まで表示されているので今どの方向に価格が動いているのかがすぐに分かります。 更新はティク毎ではなくディフォルトでは1秒毎、もちろん変更も可能なのでチャートの表示が遅くなるようなことはありません。 機能: どの通貨でも表示可能になります。 アイコンの色を指定することが可能になります。 表示位置(X軸、Y軸)が変更可能 になります。 表示位置 (左上 、 右上 、 左下 、 右下) が 指定 が可能 になります。 フォント を指定することが可能になります。 フォントサイズ が 変更可能 になります。 アイコンのサイズ が 変更可能 になります。 週足、 月足  の非表示 が 可能 になります。
FREE
移動平均線クロス、ボリンジャーと移動平均線のクロス、移動平均線の角度でサイン表示 MT5インジケータ こちらに サイト があります。 このインジケータは3つのパターンでサインを表示(切り替え可能)します。 ① 移動平均線のクロス ② ボリンジャーバンドと短期移動平均線とのクロス ③ ボリンジャーバンドと短期移動平均線とのクロスと、中期移動平均線と長期移動平均線の角度 ⓸ ボリンジャーバンドと短期移動平均線とのクロス(サインを交互に表示) 移動平均線のクロス 指定した短期移動平均線と長期移動平均線のゴールデンクロスでは買いサイン、デットクロスでは売りサインを表示します。 ディフォルトでは短期は5,長期は20となっています。 もちろん変更可能になります。 移動平均線の種類をEMA(指数平滑移動平均線)やSMMA(平滑化移動平均)などに変更可能で適する価格も変更可能になります。 ボリンジャーバンドと短期移動平均線のクロス ボリンジャーバンド(以降BB)と短期移動平均線のクロスでサインを表示します。 ディフォルトではBB+1σと5MAのゴールデンクロスで買いサイン、BB-1σと5MAのデ
TrendBar for MT4
Koji Kobayashi
1 (1)
パラボリックのデータをもとにトレンドの方向性を1分足から月足まで表示します。 1分足から 月足 まで表示されているので今どの方向に価格が動いているのかがすぐに分かります。 更新はティク毎ではなくディフォルトでは1秒毎、もちろん変更も可能なのでチャートの表示が遅くなるようなことはありません。 機能: どの通貨でも表示可能になります。 パラボリックの数値を変更することは可能になります。 上昇時と下降時のアイコンの色を指定することが可能になります。 表示位置(Y軸)が変更可能 になります。   表示位置 (左上 、 右上 、 左下 、 右下) が 指定 が可能 になります。 フォント を指定することが可能になります。 フォントサイズ が 変更可能 になります。 アイコンのサイズ が 変更可能 になります。 週足、 月足  の非表示 が 可能 になります。
FREE
Traders Club Clock for MT5 Readme ローソク足のすぐ横にその時間足での 残り時間とスプレッドを表示します。 ※残り時間はサーバ時間から計算しています。 月足、週足、日足、4時間足、1時間足、30分足、15分足、5分足、1分足 で表示可能となっております。 ※スプレッド値ポイント単位での表示になります。 ※時間の更新はティック毎ではなく1秒 毎 に更新するようにしています。   一目で残り時間とスプレッドを確認できます。 機能: 使用しているフォント種類を変更できます。 使用しているフォントサイズを変更できます。 表示しているテキストの色を変更できます。 スプレッド表示を非表示にすることができます。 表示する位置を変更することが出来ます。
FREE
エントリー前に確認できるチェックリストを作成しました。 以下のコードを参照してMT5用に作成しました。 Strategy Checklist - indicator for MetaTrader 4 https://www.mql5.com/en/code/18877 機能: チェックリスト20個まで入力できます。 表示位置 (左上 、 右上 、 左下 、 右下) の 指定 が可能 になります。 フォントサイズ の 変更が可能 になります。 チェックリストの幅を変更できます。 ドラッグ&ドロップでチェックリストを移動できます。 インストール方法: ファイル->データフォルダーを開く->MQL5フォルダー->Indicatorsフォルダー 配下にex5ファイルを置いてMT5を再起動してください。 チェックリストはマニュアルで入力が必要になります。入力後 保存しておいてください。 テンプレートで保存しておくと容易にチャートに適用できます。
FREE
多数の通貨を取引している場合、画面をカチャカチャ切り替えの際にどの通貨を見ているか 迷ったことはありませんか。 表示している通貨が大きく表示されるMT4用のインジケーターは あるのですがMT5用がなかったので作成しました。 機能: どの通貨でも表示可能になります。 表示位置 (左上 、 右上 、 左下 、 右下) の 指定 が可能 になります。 表示位置(X軸、Y軸)が変更可能 になります。 フォントの色を 変更可能 になります。 使用するフォント を指定することが可能になります。 フォントサイズ の 変更が可能 になります。 インストール方法: ファイル->データフォルダーを開く->MQL5フォルダー->Indicatorsフォルダー 配下にex5ファイルを置いてMT5を再起動してください。
FREE
RoundNum Readme (Traders Club) 特徴: このツールはDOWやNIKKEIなど500や1000ポイントがラウンドナンバーの 指数を取引する際に表示するように開発しました。 もちろんメジャー通貨でも表示はされます。 更新頻度を制限しているのでチャート表示が遅くなるということは ありません。 XMでDOWを取引される場合、Main Levelsを10000 Sub Levelsを5000にしてください。 各パラメータの説明: Number to display lines:表示するライン数を設定します。 Main Levels:メインレベルをポイントで指定します。 Main Line Color:メインラインの色を設定します。 Main Line Style:メインラインで使用されるラインを設定します。 Show Sub Lines:サブラインを表示するか設定します。 Sub Levels:サブレベルをポイントで指定します。 Sub Line Color:サブラインの色を設定します。 Sub Line Style:サブライン
FREE
特徴: このツールはDOWやNIKKEIなど500や1000ポイントがラウンドナンバーの 指数を取引する際に表示するように開発しました。 もちろんメジャー通貨でも表示はされます。 更新頻度を制限しているのでチャート表示が遅くなるということは ありません。 XMでDOWを取引される場合、Main Levelsを10000 Sub Levelsを5000にしてください。 各パラメータの説明: Number to display lines:表示するライン数を設定します。 Main Levels:メインレベルをポイントで指定します。 Main Line Color:メインラインの色を設定します。 Main Line Style:メインラインで使用されるラインを設定します。 Show Sub Lines:サブラインを表示するか設定します。 Sub Levels:サブレベルをポイントで指定します。 Sub Line Color:サブラインの色を設定します。 Sub Line Style:サブラインで使用されるラインを設定します。 Update Frequency(
FREE
Time Line (Traders Club)  機能: 昨日高値、安値、本日始値、高値、安値の時間から線を引きます。 時間足により表示する時間が変わります。 1分、5分足では1時間ごとの表示 15分、30分足では4時間ごとの表示 1時間、4時間は12時間ごとの表示 日足以降は時間は表示されません。 高値安値は週足より下位足で表示されます。 各ラベルを変更可能になります。 更新頻度を変更できるのでチャート表示が 重くなることはありません。 各パラメータの説明: Difference hours form Server Time: サーバとの時間差を入力します。 Yesterday High Label:昨日高値のラベルを設定します。 Yesterday Low Label:昨日安値のラベルを設定します。 Show open line:true 始値の線を表示するかどうか Today Open Label:本日始値のラベルを設定します。 Today High Label:本日高値のラベルを設定します。 Today Low Label:本日安値のラベルを設定します。 L
特徴: MTF Moving Averageを8本一気に表示してくれるインジケータになります。 8本も必要ない場合にももちろん非表示にできます。 どの通貨でも使用可能になります。 それぞれのMTF Moving Averageの色や太さを変更できます。 各パラメータの説明: Method:MAの種類設定をします。 Applied price:MAで使用する価格を設定をします。 TimeFrame M5:使用するMAの時間足を設定します。 Period M5:使用するMAの期間を設定します。 ※ラベルに関係なく8本のMTF MAはどの時間足でも期間設定可能になります。 Update Frequency(seconds):MTF Moving Averageの再作成更新頻度を入力します。
MA cross AKT (Traders Club)  機能: MAゴールデンクロスで買いサイン、デットクロスで売りサインを表示します。 MAの期間は入力できます。 MAの種類を選択できます。(SMA、EMA、SMMA、LWMA) 適用する価格を選べます。(CLOSE,OPEN,LOW,HIGH,MEDIAN,TYPICAL,WEIGHTED) サインをアラートで通知します。 サイン発生をE-mailやSNSで通知します。 MAクロスの勝率を表示します。 ローソク足の本数を変更することにより過去何か月かの MAクロスの勝率をすぐに確認することができます。 これは各時間足、各通貨で確認することが出来ます。 判定するローソク足を3か所選ぶことが出来ます。 ディフォルトでは5本目、9本目、14本目となっています。 サインの表示をボタンで表示したり消したりできます。 表示するサインを変更することが出来ます。
このEAを使用することにより様々な条件で自動で決済することが可能になります。 詳細な情報はこちらにサイトがあります。 https://toushika.top/ea-takeaprofit/ 条件: 条件1:利確か損切で決済 条件2:利確か損切または反転MAで決済 (ディフォルトでは20MA反転で利確) 条件3:利確か損切またはゴールデンクロス、デットクロスで決済 条件4:利確か損切またはボリンジャーバンドにタッチで決済 条件5:利確か損切またはパラボリックで決済 条件6:利確か損切または設定した水平線で決済 <- 他の通貨で設定した水平線でも決済可能 重要:水平線で決済の際、買いポジションと売りポジションは同時に持てません。 買いポジションがある時に売りポジションを持つとすぐに決済されてしまいます。 反対に売りポジションがる時に買いポジションを持つとすぐに決済されてしまいます のでご注意ください。
PO-Plus Readme 機能: 3つのロジックでの買いサイン、売りサインを表示します。 各ロジックでの勝率を表示します。 サイン表示後、勝率を確認して高い勝率でBOやFXでエントリーすることが出来ます。 勝率の判定本数を変更できます。 Indicator Noを変えることによるこのインジケータを複数適用することができます。 これによりRCIの数値を変更して勝率を複数表示が可能になります。 その際は、ラベルの表示位置も変更してください。 ボタンを押すことによりラベルや買いサイン、売りサインを表示、非表示すことが出来ます。   注意:こちらのロジックはZigZag+ロジックでの勝率になりますので 勝率は実際のものより高めに表示されます。 エントリーする際は勝率60%以上のものを推奨します。 ZigZagベースなので価格が動く日本、欧州、NY時間の前半でのエントリしない ことを推奨します。 各パラメータの説明: ----------Basic Setting---------- Indicator No:インジケータNoを設定します。もし同じチャート
移動平均線クロス、ボリンジャーと移動平均線のクロス、移動平均線の角度でサイン表示 MT5インジケータ こちらに サイト とがあります。 このインジケータは3つのパターンでサインを表示(切り替え可能)します。 ①   移動平均線のクロス ②   ボリンジャーバンドと短期移動平均線とのクロス ③   ボリンジャーバンドと短期移動平均線とのクロスと、中期移動平均線と長期移動平均線の角度 移動平均線のクロス 指定した短期移動平均線と長期移動平均線のゴールデンクロスでは買いサイン、デットクロスでは売りサインを表示します。 ディフォルトでは短期は5,長期は20となっています。 もちろん変更可能になります。 移動平均線の種類をEMA(指数平滑移動平均線)やSMMA(平滑化移動平均)などに変更可能で適する価格も変更可能になります。 ボリンジャーバンドと短期移動平均線のクロス ボリンジャーバンド(以降BB)と短期移動平均線のクロスでサインを表示します。 ディフォルトではBB+1σと5MAのゴールデンクロスで買いサイン、BB-1σと5MAのデットクロスで売りサインでサインを表示します。 BBの期間や
Time Line for MT5 機能: 昨日高値、安値、本日始値、高値、安値の時間から線を引きます。 時間足により表示する時間が変わります。 1分、5分足では1時間ごとの表示 15分、30分足では4時間ごとの表示 1時間、4時間は12時間ごとの表示 日足以降は時間は表示されません。 高値安値は週足より下位足で表示されます。 各ラベルを変更可能になります。 更新頻度を変更できるのでチャート表示が 重くなることはありません。 各パラメータの説明: Server_Time:6 サーバとの時間差を入力 Yesterday_High_Label:昨日高値 Yesterday_Low_Label:昨日安値 Show_Open:true 始値の線を表示するかどうか Today_Open_Label:本日始値 Today_High_Label:本日高値 Today_Low_Label:本日安値 max_bar:true 使用するバーを制限するかどうか Maxbars:1500 制限を使用した場合に1分では5日分 UpdateFrequency:60 更新頻度、ディフォルトは
MTF MA2 for MT5
Koji Kobayashi
3 (1)
MTF-MA2 for MT5 特徴: MTF Moving Averageを8本一気に表示してくれるインジケータになります。 8本も必要ない場合にももちろん非表示にできます。 パフォーマンスを考慮しているのでチャートが重くなるようなことは 無いはずになります。どの通貨でも使用可能になります。 それぞれのMTF Moving Averageの色や太さを変更できます。 各パラメータの説明: Method:MAの種類設定をします。 Applied price:MAで使用する価格を設定をします。 TimeFrame M5:使用するMAの時間足を設定します。 Period M5:使用するMAの期間を設定します。 ※ラベルに関係なく8本のMTF MAはどの時間足でも期間設定可能になります。 Limited bar?:表示に使用するバーを制限するかどうかを設定します。 ※ここをFalseにするとすべてのバーを読み込むことになるのでチャートが重く なるかもしれません。ご注意ください。 Max bars:使用するバーの本数を設定します。過去検証をする場合にはここの値を増や
AKT for MT5 (Traders Club)  機能: MAゴールデンクロスで買いサイン、デットクロスで売りサインを表示します。 MAの期間は短期足と長期足を入力できます。 MAの種類を選択できます。(SMA、EMA、SMMA、LWMA) 適用する価格を選べます。(CLOSE,OPEN,LOW,HIGH,MEDIAN,TYPICAL,WEIGHTED) サインをアラートで通知します。 サイン発生をE-mailやSNSで通知します。 表示するサインを変更することが出来ます。 サインの色を変更することが出来ます。 サインの表示された時間と価格が表示されます。 ※価格は終値になります。 Indicator Noを変えることによるこのインジケータを複数適用することができます。 これにより違う MAの期間による ゴールデンクロスと  デットクロスのサインを 表示できます。
ResiSupo (Traders Club)  このインジケータは直近の高値と安値を抜いたときに何ら方法で 知る方法はないかと思い開発されました。 機能: 指定したローソク足の本数で終値をベースに最高値と最安値の ラインを自動で引きます。 最高値と最安値のラインにタッチするとアラートで通知します。 通知はE-mailやSNSにも送信することができます。 最高値と最安値のラインを終値か高値または安値ベースにするかを選択できます。 Indicator Noを変えることによるこのインジケータを複数適用することができます。 これにより過去80本と20本などでの最高値と最安値のラインを引くことが可能になります。 現在のATRの値を画面に表示します。 これにより現在のボラリティーの状況が一目で分かります。 表示されているSLはディフォルトではATR値の1.5倍になっています。 この数値は現時点でのボラリティーの状況からの損切り幅の目安となります。 ATRのレベルにより表示の色が変わります。 ボタンを押すことによりアラートの通知を無効にできます。 ※ネットワークの不安
機能&特徴: ZigZagをもとに主要なレジスタンスとサポートラインを引きます。 各時間足で押し安値、戻り高値を簡単に把握できます。 現在何波目なのか簡単に把握できます。 ※ トレンド転換時はカウンターは1、継続時は2,3,4..となります。 ※ちなみにこちらはZigZagの谷山を数えています。エリオット波動数ではありません。 現在買い目線でいるべきなのか売り目線なのか簡把握できます。 過去2つのZigZagラインで静的にフィボナッチを引きます。 今の値動きで動的にフィボナッチを引きます。 逆フィボナッチ(静的なフィボナッチのみ)に変更することも可能になります。 ボタンにより以下の操作が可能になります。 1.ZigZagラインの表示、非表示 2.ノーマルフィボナッチ、逆フィボナッチの切り替え ※環境により表示に時間が掛かる場合があります。 3.1分足、5分足、15分足で1つ上のZigZagラインが引けるようになりました。 4.レジスタンスとサポートラインを再描写します。  トレンド継続や変換をアラートで通知します。 エリオ
MT5インジケータ TC-Alerts 開発経緯: 実はFXで簡単に勝てる手法があるんです。 それは。。。 主要な(4時間足以上、4時間足、日足、週足)のレジスタンスとサポートラインの反発を狙う FXは一方向には進まず90%以上で 必ず、必ずと言っていいほど、 どこかで反発します 。そこは大抵主要なレジスタンスとサポートラインまたは主要なフィボナッチラインなのです。 なのでそこに水平線を引いて ただ待つ のです。そこに到達したら、1分足や5分足に落として 長いヒゲ、ダブルボトム、ダブルヘッド、トリプルボトム、トリプルヘッド、三尊、逆三尊などの反転の形成を確認してエントリーする。 または、こちらを使用して https://www.mql5.com/ja/market/product/53987 強弱が弱くなってきたのを確認してエントリーすればいいのです。 これだけです。シンプルです!! うまく行くと、長期足レベルでレジスタンスとサポートライン間、つまり頭から尻尾まで取れる可能性もありますし、リスクリワードが異常にいいです。 そのためには、チャートに主要なレジスタンスと
ボリンジャーバンドは、価格変動を分析するためのテクニカル分析の1つのツールになります。 ボリンジャーバンドには、中心線と2つのバンドがあります。 中心線は、一般的には移動平均線(通常は20日間の単純移動平均)として計算されます。この中心線は、一定期間の価格の平均値を表しています。 ボリンジャーバンドのバンドは、中心線の上と下に等間隔で配置されます。通常は中心線から2つの標準偏差分だけ離れた位置に設定されます。 拡大(Expansion)とは、ボリンジャーバンドが広がる状態を指します。 つまり、上下のバンドが中心線から離れ、価格の変動範囲が広がっていることを示します。拡大は、相場が活発になり、価格の大幅な変動が起こりやすいことを示すことがあります。 収縮(Contraction)とは、ボリンジャーバンドが狭くなる状態を指します。 つまり、上下のバンドが中心線に近づき、価格の変動範囲が狭まっていることを示し、相場が方向感を失い、一時的に価格変動が鈍化していることを示すことがあります。 ボリンジャーバンドの収縮と拡大は、価格変動のパターンや相場の特徴を捉えるために重要な指
TC-Supportは手動取引とEA運用のために開発されたパネルになります。 このパネルでは、リスクリワード、リスク計算、リスク管理など資金管理、 トレーリングストップ機能、ブレークイーブンなどポジション管理が可能になります。 その他、便利な機能があります。 詳細な情報はこちらにサイトがあります。 デモ口座で動作するEAはこちらに置いてあります。   https://toushika.top/ mt5-tc-support / Disable Auto Trading  の 機能はMQL5では外部のDLLの利用は許可されませんので使用できません。 おもな機能一覧 資金管理 リスクリワード計算 ロット計算 損失金額計算 最大ロット数の設定 設定したリスクパーセンテージでヘッジポジション EA運用 最大損失金額またはパーセンテージによる強制クローズ EA運用 資金破綻回避  ポジション管理 成行、指値、Stop Limit注文に対応 ポジションを部分的にクローズ トレーリングストップ機能 一定の距離を超え
MT4/MT5トレードを簡単にコピー!使いやすい取引ツールで取引方向や数量を自在に同期   MT4 & MT5 TC-CTrades EA (取引コピーツール) このツールを使えば、MetaTrader 4(MT4)とMetaTrader 5(MT5)のアカウント間で取引を、好きな方向や数量で手軽にコピーできます。 デモ環境で動作するツールは こちらから 以下のMT4およびMT5間でのコピーが可能になります。 MT5 ↔ MT5 MT4 ↔ MT4 MT5 ↔ MT4 MT4 ↔ MT5 ※MT4にコピーするには MT4 Copy Trades Tool が必要になります。 主な機能: 1 つのツールで動作モード [マスター] または [スレーブ] を選択できます。 1つの「マスター」アカウントが複数の「スレーブ」アカウントに取引をコピーできます。 MetaTrader 4 - MetaTrader 5 間およびヘッジの注文/ポジションをコピーできます。 ※ネッティングには対応しておりません。 SL および TPもコピー されます。 マスター側で設定したB
Filtro:
Nessuna recensione
Rispondi alla recensione