• Panoramica
  • Recensioni (7)
  • Commenti (22)

Bermaui RSI Candles

5

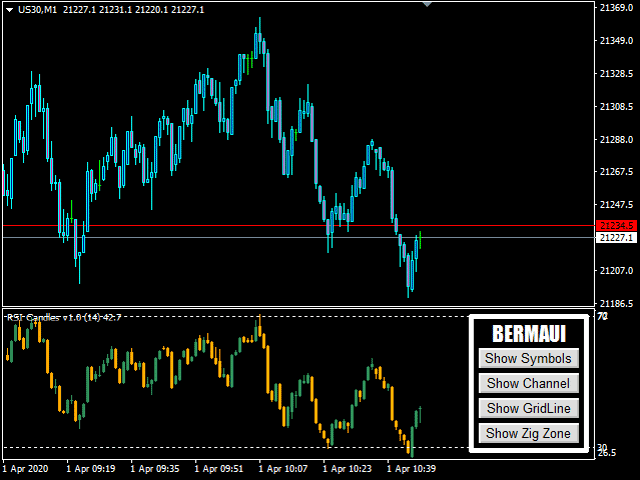
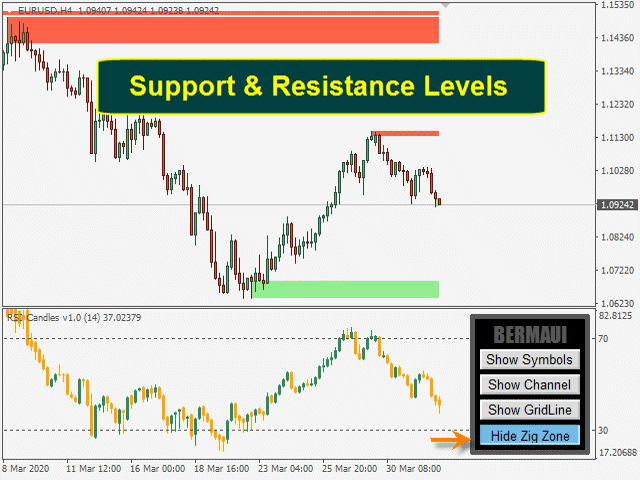
L'idea di questo indicatore è disegnare l'RSI sotto forma di candele che possono essere confrontate con i grafici dei prezzi per generare segnali di acquisto e vendita. L'indicatore non è una mia invenzione. L'ho fondato su internet diversi anni fa. Ho aggiornato il codice, aggiunto funzioni di avviso, aggiunto il gruppo di strumenti Bermaui Utilities.

L'indicatore calcola l'RSI di tutti i prezzi utilizzati per disegnare le candele (RSI di apertura, massimo, minimo e chiusura). Usa il più alto di loro per disegnare lo stoppino alto delle candele RSI e il più basso di loro per disegnare lo stoppino basso delle candele RSI. Il corpo delle candele RSI si trova tra i loro massimi e minimi. Se l'RSI dell'apertura è inferiore all'RSI della chiusura, la candela RSI è considerata rialzista. Se l'RSI dell'apertura è superiore all'RSI della chiusura, la candela RSI è considerata ribassista.

Come usarlo

  • Puoi negoziare il breakout delle linee di tendenza sull'indicatore delle candele RSI, che guiderà la tendenza sul grafico dei prezzi perché lo slancio guida il prezzo.
  • Puoi disegnare qualsiasi forma di schemi grafici classici sull'indicatore Candele RSI e scambiarli esattamente come fai con l'RSI originale.
  • Può essere utilizzato come un classico RSI. Se incrocia l'ipercomprato (70%), allora vendi e se incroci l'ipervenduto (30%), allora compra.
  • Puoi utilizzare la divergenza tra le candele RSI e i grafici dei prezzi per confermare i tuoi segnali di trading.

Caratteristiche delle candele RSI

  • Non ridipinge o ricalcola i risultati.
  • Funziona su criptovalute, azioni, indici, petrolio, oro e su tutti i tempi.
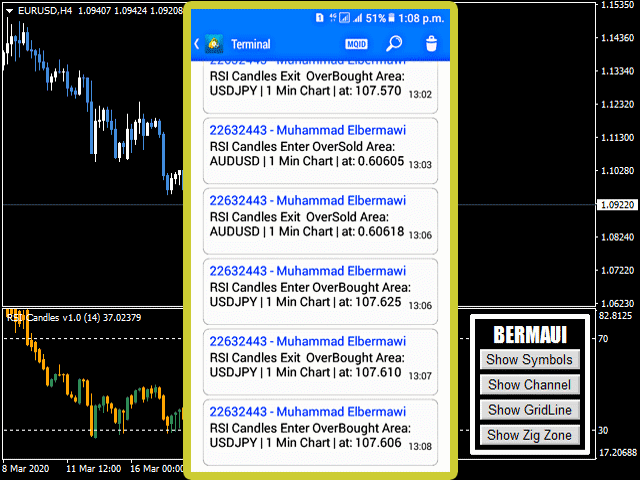
  • Suono, avvisi e-mail e notifiche mobili.
  • Linee verticali che mostrano i segnali di ipercomprato e ipervenduto sul grafico.
  • Parametri ben progettati per aiutare l'utente a navigare facilmente tra di loro.
  • Buffer per creare i tuoi consulenti esperti.
  • Quattro diversi elenchi di colori tra cui scegliere.

Parametri delle candele RSI

(1) PARAMETRI INDICATORI

  • Periodo RSI.Il valore predefinito è 14.
  • Oltre il livello venduto.Il valore predefinito è 30%
  • Oltre il livello di acquisto.Il valore predefinito è 70%

(2) LINEE V E AVVISI

  • Mostra linea verticale.Se è vero, disegnerà linee verticali sul grafico quando le candele RSI si incrociano da/per le aree di ipercomprato o ipervenduto. L'impostazione predefinita è false.
  • Allarme sonoro.L'impostazione predefinita è vero.
  • Invia una email.L'impostazione predefinita è false.
  • Invia notifica mobile.L'impostazione predefinita è false.
(3) IMPOSTAZIONI UTILITÀ
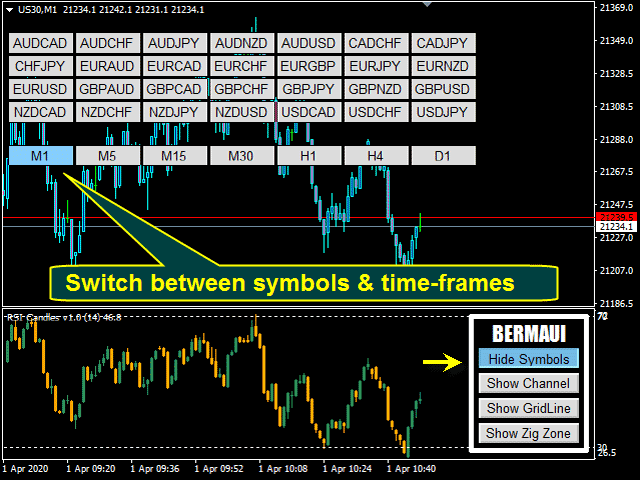
  • Simboli Fonte da.Ottieni simboli dall'Elenco simbolipersonalizzato o da Market Watch.
  • Elenco di simboli (separato da ";")Se scegli i simboli da un elenco personalizzato, separa i simboli da ";".
  • Dimensione carattere pulsante. Il valore predefinito è dieci.
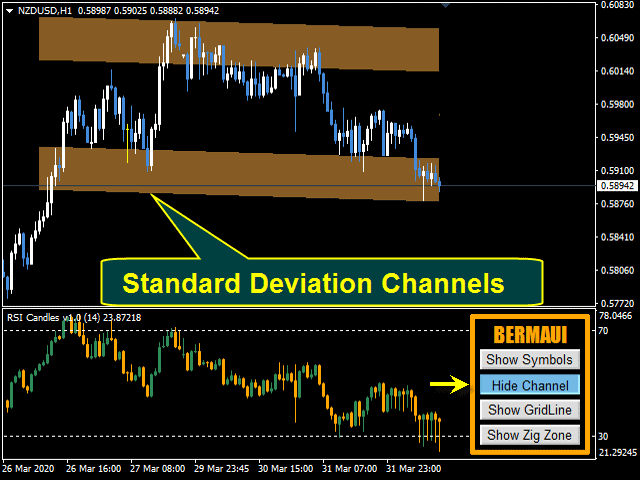
  • Lunghezza canale [> 1]Numero di candele utilizzate nel calcolo del canale. Il valore predefinito è 100.
  • Appare pannello [Maiusc + Lettera]Lettera da premere più Maiusc per far apparire il pannello. Il valore predefinito è "A"
  • Pannello scompare [Shift + Letter]Lettera da premere più shift per far scomparire il pannello. Il valore predefinito è "D"
(4) STILE INDICATORE
  • Elenco Colori Grafico:l'utente può scegliere tra quattro diversi elenchi di colori per il suo grafico oppure può scegliere (Non fare nulla) se desidera utilizzare un proprio elenco.


Se hai domande, contattami tramite un messaggio privato o scrivile nella sezione commenti.
Muhammad Al Bermaui, CMT
Recensioni 7
pornchai_p
340
pornchai_p 2023.06.04 04:21 
 

This is the best RSI indicator. HIghly recommnended. Please kindly send me the free Stochastic indicator. Thank you.

Hisham Ghoneim
301
Hisham Ghoneim 2022.08.18 10:39 
 

Great work as usual

Suvashish Halder
13535
Suvashish Halder 2022.04.07 05:58 
 

Best RSI indicator in this market and it's a real deal. Thank you for your work ❤

Prodotti consigliati
GeoWprPro
Georgij Komarov
WPR by Profile, or WPR for Professionals Geo_WprPro is one of the well-known currency profile indicators. It simultaneously displays two WPR indicators with different parameters in the matrix form on all timeframes of multiple currency pairs forming the currency profile . As follows from the description, " WPR is a leading indicator that often goes ahead of the price chart. The oscillator frequently reaches extreme values before the price reversal as if anticipating that event: it almost always
The principle of this indicator is very simple: detecting the trend with Moving Average, then monitoring the return point of graph by using the crossing of Stochastic Oscillator and finally predicting BUY and SELL signal with arrows, alerts and notifications. The parameters are fixed and automatically calculated on each time frame. Example: If you install indicator on EURUSD, timeframe M5: the indicator will detect the main trend with the Moving Average on this timeframe (for example the Moving
Binary Options Support Resistance Indicator This indicator is designed for binary options trading and effectively shows retracements from support and resistance levels. Signals appear on the current candle. A red arrow pointing downwards indicates a potential selling opportunity, while a blue arrow pointing upwards suggests buying opportunities. All that needs adjustment is the color of the signal arrows. It is recommended to use it on the M1-M5 timeframes as signals are frequent on these timef
MACD Divergence Finder Indicator will help you to find Divergences between your typical MACD values and the Chart Prices as potential points of actual Trend Reversion or Pull Backs to increase your positions as per the current Trend. Indicator Windows draws MACD value and Divergence arrows but not MACD Signal as it is not considered relevant to detect this kind of Classic Divergences. In some computer/VPS with old microprocessors or low RAM size, when you launch this Indicator (attach it, change
Indicator for binary options arrow is easy to use and does not require configuration works on all currency pairs, cryptocurrencies buy signal blue up arrow sell signal red down arrow tips do not trade during news and 15-30 minutes before their release, as the market is too volatile and there is a lot of noise it is worth entering trades one or two candles from the current period (recommended for 1 candle) timeframe up to m 15 recommended money management fixed lot or fixed percentage of the depo
Owl smart levels
Sergey Ermolov
4.63 (54)
Versione MT5  |  FAQ L' indicatore Owl Smart Levels   è un sistema di trading completo all'interno dell'unico indicatore che include strumenti di analisi di mercato popolari come i   frattali avanzati di Bill Williams , Valable ZigZag che costruisce   la corretta struttura a onde   del mercato, e i   livelli di Fibonacci che segnano i livelli esatti di entrata nel mercato e luoghi per prendere profitti. Descrizione dettagliata della strategia Istruzioni per lavorare con l'indicatore Consulente-
VR Cub
Vladimir Pastushak
VR Cub è un indicatore per ottenere punti di ingresso di alta qualità. L'indicatore è stato sviluppato per facilitare i calcoli matematici e semplificare la ricerca dei punti di ingresso in una posizione. La strategia di trading per la quale è stato scritto l'indicatore ha dimostrato la sua efficacia per molti anni. La semplicità della strategia di trading è il suo grande vantaggio, che consente anche ai trader alle prime armi di commerciare con successo con essa. VR Cub calcola i punti di apert
This indicator Master XR indicator.Indicator displays trend movement. Indicator calculates automatically line. Features FiltPer - displays indicator period. deviation - displays indicator deviation. deviation2 - displays indicator deviation. How to understand the status: If (Timeframe M1-H1) FiltPer = 100; If ( Timeframe H4-MN) FiltPer = 5-20; ////////////////////////////////////////////////////////////////////////////////////////////////////////////////////////////////////////////////////// /
Multi Trend Analyzer MT4 indicator provides signals from the following technical trading indicators: RSI, STOCH, STOCHRSI, MACD, ADX, Williams % R, ATR, Oscillator, ROC and Bull/Bear Power. It supports all time frames, from the 1 minute up to the monthly charts. You can change all indicator inputs. Indicator provide total trend summary. We can easily analysis and study market movement .
Trend PA
Mikhail Nazarenko
5 (3)
The Trend PA indicator uses   Price Action   and its own filtering algorithm to determine the trend. This approach helps to accurately determine entry points and the current trend on any timeframe. The indicator uses its own algorithm for analyzing price changes and Price Action. Which gives you the advantage of recognizing, without delay, a new nascent trend with fewer false positives. Trend filtering conditions can be selected in the settings individually for your trading style. The indicator
GG TrendBar Indicator
Biswarup Banerjee
5 (1)
GG TrendBar Indicator - Your Multitimeframe ADX Trading Solution Experience the power of multi-timeframe trading with the "GG TrendBar Indicator." This versatile tool, built upon the ADX indicator, offers precise insights by considering multiple timeframes, ensuring you make well-informed trading decisions. Basic Details : Indicator Type : GG TrendBar Indicator (Multi-Timeframe ADX) Key Metrics : Real-time ADX analysis across multiple timeframes. Customization : Enable or disable specific timefr
Strong Retracement Points Pro demo edition! SRP (Strong Retracement/Reversal Points) is a powerful and unique support and resistance indicator. It displays the closest important levels which we expect the price retracement/reversal! If all level are broken from one side, it recalculates and draws new support and resistance levels, so the levels might be valid for several days depending on the market! If you are still hesitating to start using this wonderful tool, you can check this link to see h
Apollo Price Action System è un indicatore completamente basato sul principio Price Action. L'indicatore fornisce un segnale di acquisto o vendita non appena si formano le condizioni per entrare nel mercato secondo la strategia dell'indicatore. L'indicatore può essere utilizzato come sistema di trading di base o come aggiunta al proprio sistema di trading.  L'indicatore può funzionare con qualsiasi intervallo di tempo, ma si consiglia di utilizzare D1. Questo indicatore è molto facile da usare.
Market Structure Zig Zag
Lesedi Oliver Seilane
4.78 (23)
Free Market structure zig zag to assist in price action trading the screenshots describe how to use and how to spot patterns new version comes with alerts, email alert and  push notification alert can be used on all pairs  can be used on all timeframes  you can add additional confirmation indicators the indicator shows you your higher high and low highs as well as your lower lows and lower highs  the indication makes price action analysis easier to spot.
FREE
Forex Indicator HTF Ichimoku for MT4 Ichimoku indicator is   one of the most powerful trend indicators .  H TF means -   H igher Time Frame This indicator is excellent for Trend Traders as well as combination with Price Action entries. HTF Ichimoku  Indicator allows you to attach Ichimoku from Higher time frame to your current chart. Up trend   - red line above blue one (and both lines are above cloud) /   Down trend   - red line below blue one  (and both lines are below cloud) Open BUY orders
Easy Bands Mt4
Nikolay Kositsin
В основе индикатора EasyBands лежит тот же принцип, что и при построении Bollinger Band. Однако, данная модификация индикатора использует вместо стандартного отклонения средний торговый диапазон (Average True Range). Соответственно, с данным индикатором абсолютно аналогично можно использовать все стратегии, которые применяются с Bollinger Band. В данной версии индикатора используется двенадцать уровней и средняя линия (белый цвет). Индикация тренда выполнена в виде окраски свечей в зависимости
Deal Trading SPT
Sukunthakan Ngernbamrung
Deal Trading SPT (Super Trend) is an indicator, shows the market trend direction, entry position, take profit level, stop loss level and trend strength. Utility Help to further filter and develop strategy to trade Market overview on the chart Stop loss and take profit calculation with market volatility Resistance and support for trialing stop No repaint after the finished bar Works in any timeframe and financial instrument, including forex, CFD and crypto etc. Message pop-up, notification wi
ADX Pointer
Dominik Mandok
ADX Pointer is an indicator which is based on "Average Directional Index" and draws three numbers in chart window depending on the value of ADX. In ADX Pointer you can set "ADX_Period" which is of course period of Average Directional Index and you can also set 3 levels. When ADX value exceed first level ("ADX_Level1") in chart window appears number "1", when ADX exceed second level ("ADX_Level2") appears "2" and when ADX exceed third level ("ADX_Level3") appears "3". Simple. ADX Pointer works on
Forex Gump
Andrey Kozak
2.83 (6)
Forex Gump is a fully finished semi-automatic trading system. In the form of arrows, signals are displayed on the screen for opening and closing deals. All you need is to follow the instructions of the indicator. When the indicator shows a blue arrow, you need to open a buy order. When the indicator shows a red arrow, you need to open a sell order. Close orders when the indicator draws a yellow cross. In order to get the most effective result, we recommend using the timeframes H1, H4, D1. There
The indicator detects and displays Shark harmonic pattern (see the screenshot). The pattern is plotted by the extreme values of the ZigZag indicator (included in the resources, no need to install). After detecting the pattern, the indicator notifies of that by a pop-up window, a mobile notification and an email. The indicator highlights the process of the pattern formation and not just the complete pattern. In the former case, it is displayed in the contour triangles. After the pattern is comple
Contact me for instruction, any questions! Introduction V Bottoms and Tops are popular   chart patterns   among traders due to their potential for identifying trend reversals. These patterns are characterized by sharp and sudden price movements, creating a V-shaped or inverted V-shaped formation on the   chart . By recognizing these patterns, traders can anticipate potential shifts in market direction and position themselves accordingly.  V pattern is a powerful bullish/bearish reversal pattern
Noize Absorption Index MT4
Ekaterina Saltykova
5 (1)
Noize Absorption Index - is the manual trading system that measures the difference of pressure between bears forces and bulls forces. Green line - is a noize free index that showing curent situation. Zero value of index shows totally choppy/flat market.Values above zero level shows how powerfull bullish wave is and values below zero measures bearish forces.Up arrow appears on bearish market when it's ready to reverse, dn arrow appears on weak bullish market, as a result of reverse expectation. S
ZhiBiCCI MT4
Qiuyang Zheng
5 (1)
[ZhiBiCCI] indicators are suitable for all cycle use, and are also suitable for all market varieties. [ZhiBiCCI] Green solid line is a reversal of bullish divergence. The green dotted line is a classic bullish divergence. [ZhiBiCCI] The solid line to the red is a reverse bearish divergence. The red dotted line is a classical bearish divergence. [ZhiBiCCI] can be set in the parameters (Alert, Send mail, Send notification), set to (true) to send instant signals to the alarm window, email, in
The Four Moving Averages Message indicator ( please see the description and video ), a version of Four Moving Averages , concurrently displays four Moving Averages with default settings in the main chart window: Green and Red ones represent a short-term trend, Red and Blue ones - mid-term trend, while Blue and Yellow ones - long-term trend. You can change the moving average settings and colors. However, these parameters have been configured so that to allow trading on all time frames. The built-
Forex Indicator "RSI and 2   Moving Averages"   for MT4 This indicator is excellent for   Momentum trading systems . " RSI and 2 MAs"   Indicator allows you to   see Fast and Slow Moving Averages of RSI itself Indicator gives opportunities to see the trend change very early " RSI and 2 MAs" can be used to catch the momentum into the trend direction It is very easy to set up this indicator via parameters (see the picture) Indicator can be used on any time-frame // More great Expert Advisors and I
Rainbow Ribbon
Pierce Vallieres
Rainbow Ribbon - Rainbow MA bands - Useful for spotting trend changes - Useful for spotting trend slopes - Useful for spotting trend acceleration - Ability to choose ribbon colors, moving averages, and distances - Provides colorful rainbow ribbons to show an array of moving averages Rainbow Ribbon is an extremely useful indicator, it has been designed to make it easy to spot the trend and also changes within the trend before they occur. It can be used many different ways and provides the abil
The Vortex Indicator was inspired by the work of an Austrian inventor, Viktor Schauberger, who studied the flow of water in rivers and turbines. Etienne Botes and Douglas Siepman developed the idea that movements and flows within financial markets are similar to the vortex motions found in water. The Vortex Indicator was also partly inspired by J. Welles Wilder's concept of directional movement, which assumes the relationship between price bars gives clues as to the direction of a market. This i
Scalping Modulator
Andrey Kozak
5 (1)
Scalping Modulator is a scalping trading system. The indicator consists of several analytical modules. It automatically analyzes the market and shows the trader all the necessary information for trading. Scalping Modulator draws two trend lines on the chart. One line shows the long-term direction of the price, the second line shows the medium-term direction of the price. The indicator also draws red and blue dots on the chart. They indicate a likely change in price movement. In order to open a
Gold Level MT4
Aleksandr Makarov
Gold Level MT4 A great helper for trading Gold. Levels do not repaint and do not change their data We recommend using it with the indicator - Professional Trade Arrow Levels are built every day, so you will trade every day with the indicator. Gold Level. Price markups are shown on the chart, after reaching TP1 or SL1, close half of the position, and the rest is transferred to breakeven. Any questions? Need help?, I am always happy to help, write me in private messages or in telegram.
Trend Flasher Trend is your friend is the age old saying quote in trading arena, there are though many ways to gauge the trend and its direction, more scientific measure and logically meaningful will be an ATR break outs to identify and spot the trend and its acceleration, so we created this easy to use trend identification panel and optimized super trend based multi time frame panel entry system to aid and help the traders to make their trading decision. Unique Features of Trend Flasher 1
Gli utenti di questo prodotto hanno anche acquistato
Gann Made Easy
Oleg Rodin
4.91 (58)
Gann Made Easy è un sistema di trading Forex professionale e facile da usare che si basa sui migliori principi del trading utilizzando la teoria di mr. WD Gann. L'indicatore fornisce segnali ACQUISTA e VENDI accurati, inclusi i livelli di Stop Loss e Take Profit. Puoi fare trading anche in movimento utilizzando le notifiche PUSH. Vi prego di contattarmi dopo l'acquisto! Condividerò i miei consigli di trading con te e fantastici indicatori bonus gratuitamente! Probabilmente hai già sentito parlar
Atomic Analyst
Issam Kassas
5 (3)
Innanzitutto, vale la pena sottolineare che questo indicatore di trading non è repaint, non è ridisegno e non presenta ritardi, il che lo rende ideale sia per il trading manuale che per quello automatico. Manuale utente: impostazioni, input e strategia. L'Analista Atomico è un indicatore di azione del prezzo PA che utilizza la forza e il momentum del prezzo per trovare un miglior vantaggio sul mercato. Dotato di filtri avanzati che aiutano a rimuovere rumori e segnali falsi, e aumentare il pote
Scopri il segreto per il trading Forex di successo con il nostro indicatore MT4 personalizzato! Ti sei mai chiesto come raggiungere il successo nel mercato Forex, guadagnando costantemente profitti minimizzando il rischio? Ecco la risposta che hai cercato! Permettici di presentare il nostro indicatore MT4 proprietario che rivoluzionerà il tuo approccio al trading. Versatilità unica Il nostro indicatore è appositamente progettato per gli utenti che preferiscono le formazioni di candele Ren
ATTUALMENTE SCONTATO DEL 26% La soluzione migliore per ogni principiante o trader esperto! Questo indicatore è uno strumento di trading unico, di alta qualità e conveniente perché abbiamo incorporato una serie di caratteristiche proprietarie e una nuova formula. Con un solo grafico è possibile leggere la forza delle valute per 28 coppie Forex! Immaginate come migliorerà il vostro trading perché sarete in grado di individuare l'esatto punto di innesco di una nuova tendenza o di un'opportunit
TPSpro RFI Levels
Roman Podpora
5 (13)
A key element in trading is zones or levels from which decisions to buy or sell a trading instrument are made. Despite attempts by major players to conceal their presence in the market, they inevitably leave traces. Our task was to learn how to identify these traces and interpret them correctly. Reversal First Impulse levels (RFI)   -  Version MT5                INSTRUCTIONS                 RUS                 ENG                                       R ecommended to use with an indicator   -  
ON Trade Optuma Astro
Abdullah Alrai
5 (4)
Presentazione dell'Indicatore Astronomico per MT4: Il tuo compagno di trading celeste definitivo Sei pronto a elevare la tua esperienza di trading a livelli celesti? Non cercare oltre, il nostro rivoluzionario Indicatore Astronomico per MT4 è qui. Questo strumento innovativo va oltre gli indicatori di trading tradizionali, sfruttando algoritmi complessi per offrirti intuizioni astronomiche senza pari e calcoli di precisione. Un universo di informazioni a portata di mano: Ammira un pannello compl
Break and Retest
Mohamed Hassan
4.56 (9)
‍You can visually backtest Break & Retest to see how it behaved in the past!     Manual guide:   Click here $65  for only 1  copy left! Next price is $120 .  This Indicator only places quality trades when the market is really in your favor with a clear break and retest. Patience is key with this price action strategy! Recommended timeframes: M1 for Scalpers.  M15 for Intraday traders. H1 & H4 for Day traders. Other timeframes are also excellent! After many months of hard w
Advanced Supply Demand
Bernhard Schweigert
4.92 (310)
CURRENTLY 26% OFF !! Best Solution for any Newbie or Expert Trader! This indicator is a unique, high quality and affordable trading tool because we have incorporated a number of proprietary features and a new formula. With this update, you will be able to show double timeframe zones. You will not only be able to show a higher TF but to show both, the chart TF, PLUS the higher TF: SHOWING NESTED ZONES. All Supply Demand traders will love it. :) Important Information Revealed Maximize the potenti
Trend Screener
STE S.S.COMPANY
4.83 (86)
Indicatore di tendenza, soluzione unica rivoluzionaria per il trading di tendenze e il filtraggio con tutte le importanti funzionalità di tendenza integrate in un unico strumento! È un indicatore multi-timeframe e multi-valuta al 100% non ridipingibile che può essere utilizzato su tutti i simboli/strumenti: forex, materie prime, criptovalute, indici e azioni. Trend Screener è un indicatore di tendenza che segue un indicatore efficiente che fornisce segnali di tendenza a freccia con punti nel gra
Innanzitutto, vale la pena sottolineare che questo Strumento di Trading è un Indicatore Non-Ridipingente, Non-Ridisegnante e Non-Laggante, il che lo rende ideale per il trading professionale. Corso online, manuale utente e demo. L'Indicatore Smart Price Action Concepts è uno strumento molto potente sia per i nuovi che per i trader esperti. Racchiude più di 20 utili indicatori in uno solo, combinando idee di trading avanzate come l'Analisi del Trader del Circolo Interno e le Strategie di Trading
on free demo press zoom out button to see back.. cnt number is bar numbers.you can change up to 3000 related to chart bars numbers. minimum value is 500. there is g value set to 10000. sometimes need to lower or increase. and if they need can make small change on it. this indicator almost grail,no repaint and all pairs ,all timeframe indicator. there is red and blue histograms. if gold x sign comes on red histogram that is sell signal. if blue x sign comes on blue histogram that is buy signal.
TPSproTREND PrO
Roman Podpora
5 (15)
TPSpro TRENDPRO  - is a trend indicator that automatically analyzes the market and provides information about the trend and each of its changes, as well as giving signals for entering trades without redrawing! The indicator uses each candle, analyzing them separately. referring to different impulses - up or down impulse. Exact entry points into transactions for currencies, crypto, metals, stocks, indices!  -  Version MT5               DETAILED DESCRIPTION        /       TRADING SETUPS           
Presentazione       Quantum Trend Sniper Indicator   , l'innovativo indicatore MQL5 che sta trasformando il modo in cui identifichi e scambi le inversioni di tendenza! Sviluppato da un team di trader esperti con un'esperienza di trading di oltre 13 anni,       Indicatore Quantum Trend Sniper       è progettato per spingere il tuo viaggio di trading verso nuove vette con il suo modo innovativo di identificare le inversioni di tendenza con una precisione estremamente elevata. *** Acquista Quant
Scalper Vault
Oleg Rodin
5 (28)
Scalper Vault è un sistema di scalping professionale che ti fornisce tutto il necessario per scalping di successo. Questo indicatore è un sistema di trading completo che può essere utilizzato dai trader di forex e opzioni binarie. L'intervallo di tempo consigliato è M5. Il sistema fornisce segnali di freccia accurati nella direzione della tendenza. Ti fornisce anche i segnali più alti e più bassi e i livelli di mercato di Gann. Gli indicatori forniscono tutti i tipi di avvisi, comprese le notifi
Attualmente 20% di sconto! La soluzione migliore per ogni principiante o trader esperto! Questo software per cruscotti funziona su 28 coppie di valute. Si basa su 2 dei nostri indicatori principali (Advanced Currency Strength 28 e Advanced Currency Impulse). Offre un'ottima panoramica dell'intero mercato Forex. Mostra i valori di forza delle valute avanzate, la velocità di movimento delle valute e i segnali per 28 coppie Forex in tutti i (9) timeframe. Immaginate come migliorerà il vostro t
Market Reversal Alerts
LEE SAMSON
4.21 (121)
Il profitto dalla struttura del mercato cambia quando il prezzo si inverte e si ritira. L'indicatore di avviso di inversione della struttura del mercato identifica quando una tendenza o un movimento di prezzo si sta avvicinando all'esaurimento e pronto a invertire. Ti avvisa dei cambiamenti nella struttura del mercato che in genere si verificano quando stanno per verificarsi un'inversione o un forte pullback. L'indicatore identifica inizialmente i breakout e lo slancio del prezzo, ogni volta
Currency Strength Wizard è un indicatore molto potente che ti fornisce una soluzione all-in-one per un trading di successo. L'indicatore calcola la potenza di questa o quella coppia forex utilizzando i dati di tutte le valute su più intervalli di tempo. Questi dati sono rappresentati in una forma di indice di valuta facile da usare e linee elettriche di valuta che puoi utilizzare per vedere il potere di questa o quella valuta. Tutto ciò di cui hai bisogno è collegare l'indicatore al grafico che
Il sistema di trading tecnico delle frecce BB è stato sviluppato per prevedere punti inversi per prendere decisioni al dettaglio. L'attuale situazione di mercato è analizzata dall'indicatore e strutturata per diversi criteri: l'aspettativa di momenti di inversione, potenziali punti di svolta, segnali di acquisto e vendita. L'indicatore non contiene informazioni in eccesso, ha un'interfaccia comprensibile visiva, che consente ai trader di prendere decisioni ragionevoli. Tutte le frecce sembr
RelicusRoad Pro
Relicus LLC
4.78 (139)
Ora $ 147 (aumentando a $ 499 dopo alcuni aggiornamenti) - account illimitati (PC o MAC) Manuale utente di RelicusRoad + Video di formazione + Accesso al gruppo Discord privato + Stato VIP UN NUOVO MODO DI GUARDARE IL MERCATO RelicusRoad è l'indicatore di trading più potente al mondo per forex, futures, criptovalute, azioni e indici, fornendo ai trader tutte le informazioni e gli strumenti di cui hanno bisogno per rimanere redditizi. Forniamo analisi tecniche e piani di trading per aiuta
Entry Points Pro
Yury Orlov
4.7 (225)
Indicatore top per MT5 che fornisce segnali accurati per entrare in un trade senza riverniciare! Può essere applicato a qualsiasi attività finanziaria: forex, criptovalute, metalli, azioni, indici.  La versione MT5 è qui Fornirà segnali di trading piuttosto precisi e ti dirà quando è meglio aprire un trade e chiuderlo. Guarda il video (6:22) con un esempio di elaborazione di un solo segnale che ha ripagato l'indicatore! La maggior parte dei trader migliora i propri risultati di trading
Vi presentiamo ON Trade Waves Patterns Harmonic Elliot Wolfe, un indicatore avanzato progettato per rilevare vari tipi di pattern sul mercato utilizzando metodi sia manuali che automatici. Ecco come funziona: Pattern Armonici: Questo indicatore è in grado di individuare pattern armonici che appaiono sul vostro grafico. Questi pattern sono fondamentali per i trader che praticano la teoria del trading armonico, come descritta nel libro di Scott Carney "Harmonic Trading vol 1 & 2". Che li disegniat
Up down v6T
Guner Koca
5 (1)
Thise indicator is up down v6  comes with tradingwiev pinescript. purchased people, after installed on terminal ,contact me on mql5  to get BONUS  TradingView pinescript. up-down indicator is no repaint and works all pairs and lower than weekly time frames charts. it is suitable also 1 m charts for all pairs. and hold long way to signal. dont gives too many signals. when red histogram cross trigger line that is up signal.and price probably will down when blue histogram cross trigger line that
TrendDecoder Premium
Christophe, Pa Trouillas
5 (3)
Identificare i range e le prossime mosse probabili   |  Ottenere i primi segnali e la forza delle tendenze   |  Ottenere uscite chiare prima dell'inversione   |  Individuare i livelli di Fibo che il prezzo testerà Indicatore non tracciante e non ritardato - ideale per il trading manuale e automatizzato - adatto a tutti gli asset e a tutte le unità temporali Offerta limitata nel tempo >>   50% OFF Dopo l'acquisto, contattatemi su questo canale  per le impostazioni personalizzate. Versione   MT5 :
TrendMaestro
Stefano Frisetti
5 (2)
nota: questo indicatore e' per METATRADER4, se vuoi la versione per  METATRADER5 questo e' il link:  https://www.mql5.com/it/market/product/108123 TRENDMAESTRO ver 2.4 TRENDMAESTRO riconosce un nuovo TREND sul nascere, non sbaglia mai. La sicurezza di identificare un nuovo TREND non ha prezzo. DESCRIZIONE TRENDMAESTRO identifica un nuovo TREND sul nascere, questo indicatore prende in esame la volatilita' i volumi ed il momentum per identificare il momento in cui c'e' un'esplosione di uno 
FX Power MT4 NG
Daniel Stein
5 (9)
Ricevi il tuo aggiornamento quotidiano sul mercato con dettagli e schermate tramite il nostro Morning Briefing qui su mql5 e su Telegram ! FX Power MT4 NG è la nuova generazione del nostro popolare misuratore di forza delle valute, FX Power. Cosa offre questo misuratore di forza di nuova generazione? Tutto ciò che avete amato dell'FX Power originale IN PIÙ Analisi della forza di ORO/XAU Risultati di calcolo ancora più precisi Periodi di analisi configurabili individualmente Limite di calcolo pe
Trend Forecasting
Mohamed Hassan
5 (20)
This indicator is unstoppable when combined with our other indicator called Katana. After purchase, send us a message and you could get Katana for FREE as a BONUS After purchase, send us a private message for your instructions.  MT5 version: click here 1 copy left available at $45. Next price is $95. Don't miss this great deal!  The Trend Forecasting indicator is a very unique & easy tool that is able to make prediction about future price movement based on the signals generated by
Connect Indicator
Sukunthakan Ngernbamrung
Connect Indicator is a tool used for connecting indicators between the MQL market and MT4. The connected indicators are made by our group and can be used for other applications, such as sending messages to the Line application or Telegram application. If you have any questions, please don't hesitate to ask us to receive support. Function and indicator buffer Buffer one is the high price of the previous candle. Buffer two is the high price of the previous candle. Usage To connect indicators to fu
Quantum Breakout Indicator PRO
Bogdan Ion Puscasu
4.96 (26)
Presentazione       Quantum Breakout PRO   , l'innovativo indicatore MQL5 che sta trasformando il modo in cui scambi le zone di breakout! Sviluppato da un team di trader esperti con un'esperienza di trading di oltre 13 anni,   Quantum Breakout PRO   è progettato per spingere il tuo viaggio di trading a nuovi livelli con la sua strategia innovativa e dinamica della zona di breakout. Quantum Breakout Indicator ti fornirà frecce di segnalazione sulle zone di breakout con 5 zone target di prof
Scalper Inside PRO
Alexey Minkov
4.75 (57)
An exclusive indicator that utilizes an innovative algorithm to swiftly and accurately determine the market trend. The indicator automatically calculates opening, closing, and profit levels, providing detailed trading statistics. With these features, you can choose the most appropriate trading instrument for the current market conditions. Additionally, you can easily integrate your own arrow indicators into Scalper Inside Pro to quickly evaluate their statistics and profitability. Scalper Inside
Quantum Heiken Ashi PRO MT4
Bogdan Ion Puscasu
4.43 (7)
Presentazione del       Grafici   Quantum Heiken Ashi PRO Progettate per fornire informazioni chiare sulle tendenze del mercato, le candele Heiken Ashi sono rinomate per la loro capacità di filtrare il rumore ed eliminare i falsi segnali. Dì addio alle confuse fluttuazioni dei prezzi e dai il benvenuto a una rappresentazione grafica più fluida e affidabile. Ciò che rende il Quantum Heiken Ashi PRO davvero unico è la sua formula innovativa, che trasforma i dati tradizionali delle candele in barre
Altri dall’autore
True Direction Oscillator
Muhammad Elbermawi
4.89 (493)
Oppure (TDO) che è un indice che misura il tasso di variazione del prezzo utilizzando il principio del " Pure Momentum ". Quando il prezzo di un titolo avanza da 10 a 15, il tasso di variazione del prezzo è del 150%, ma quando scende da 15 a 10, il tasso di variazione del prezzo è solo del 33,3%. Ecco perché gli indicatori di analisi tecnica come "Price Rate of Change" (ROC) o "Momentum" forniscono letture più elevate per i movimenti di prezzo ascendente rispetto a quelli dati a quelli discende
Moving Average Cloud
Muhammad Elbermawi
4.93 (14)
O "MAC". Questo è un indicatore progettato per aiutarti a catturare e scambiare la tendenza. L'idea alla base di questo indicatore può essere spiegata nei passaggi successivi: Disegna una busta media in rapido movimento. Disegna una busta media lenta. Il MAC Upper Band è il valore più alto tra il massimo di entrambi gli inviluppi. La banda inferiore del MAC è il valore più basso tra i minimi di entrambi gli inviluppi. MAC Histogram Cloud riempie la distanza tra due bande per mostrare il cambi
Bermaui Bands
Muhammad Elbermawi
4.94 (89)
Bermaui Bands (BB) è uno strumento di analisi tecnica che aiuta a filtrare tra i movimenti di prezzo di range e trend. L'idea alla base di questo indicatore può essere spiegata nei passaggi successivi: Calcola la deviazione standard come un oscillatore che si muove tra 0 e 100. Lo chiamerò Bermaui Deviation percent (BD %). Se "BD%" è vicino allo zero, la volatilità è al suo estremo. Inoltre, se "BD%" è vicino a 100, la volatilità è molto bassa. Alta volatilità significa una grande probabilità pe
Classic Keltner Channel
Muhammad Elbermawi
4.9 (40)
o CKC. Questo indicatore funziona in base alla classica regola della media mobile a dieci giorni descritta da Chester W. Keltner (1909–1998). Tutti i parametri sono impostati di default sulla versione classica del sistema Keltner, mentre l'utente può modificarli se lo desidera. Informazioni importanti Leggi il manuale CKC: https://www.mql5.com/en/blogs/post/736577 Esempio di consulente esperto CKC: https://www.mql5.com/en/blogs/post/734150 Informazioni sulla formula del canale Keltner 1. C
Bermaui Manual EA
Muhammad Elbermawi
5 (10)
Questo è un consulente esperto semiautomatico che scambia il sistema di rete. L'idea è quella di prendere gradualmente posizioni diverse nel mercato, quindi calcolare il livello di pareggio per loro. Quando i prezzi superano questo punto di pareggio di una distanza predeterminata, tutti gli ordini aperti vengono chiusi. Informazioni importanti Ecco la guida per l'utente:   https://www.mql5.com/en/blogs/post/730567 Puoi provare questo EA con uno qualsiasi dei miei altri prodotti, qui: https:/
Bermaui Pin Bars
Muhammad Elbermawi
5 (22)
Bermaui Pin Bars Oppure (BPB) è un indicatore che trova il modello di azione dei prezzi delle barre dei pin sul grafico. Pin Bars è una scorciatoia per "Pinocchio Bars" che è un classico modello a barre alternativo ai candelabri giapponesi con alte ombre superiori o inferiori e corpi molto piccoli come Hammer, Inverted-Hammer, Hanging Man, Shooting Star, Dragon Fly Doji o Grave Stone Doji . L'indicatore Bermaui Pin Bars trova questo modello in base a una formula che può essere spiegata nei pa
Bermaui Deviation Percent
Muhammad Elbermawi
4.94 (129)
Oppure ( BD% ) che è un indice di volatilità che misura la volatilità in percentuale anziché in punti. L'idea di BD% è quella di creare un indice in base alla Classic Standard Deviation (CSD) che si sposta tra 0 e 100 percento. È possibile utilizzare BD% per confrontare la volatilità per lo stesso titolo in diversi periodi di tempo o periodi di tempo diversi. Inoltre, puoi utilizzare BD% per confrontare la volatilità tra diversi titoli in diversi mercati in termini di percentuale anziché di p
MASR Bands
Muhammad Elbermawi
5 (10)
O bande M Oving A verage S upport R esistance. L'indicatore MASR Bands è una media mobile circondata da due bande che lavorano insieme come livelli di supporto e resistenza. Statisticamente, le bande MASR contengono candele di prezzo il 93% delle volte. Ecco come viene calcolato in passaggi: 1. Il primo passaggio consiste nel calcolare il massimo massimo (HHV) e il minimo minimo (LLV) per un periodo di tempo X. 2. Il secondo passaggio consiste nel dividere HHV per LLV per ottenere quanto
Or DBD%. The indicator consists of colored tape that shows trading signals depending on two Bermaui Deviation Oscillator (BD%) and two moving averages. Bermaui Deviation Percent is a volatility index that measures volatility in percent rather than points. The idea of BD% is to make an index depending on Classic Standard Deviation (CSD) that moves between 0 and 100 percent. Important Information DBD% expert advisor example:  https://www.mql5.com/en/blogs/post/731145 If you want to know mor
BACD Cloud
Muhammad Elbermawi
4.57 (7)
Oppure B ermaui A verage C onvergence D ivergence Cloud , che è un oscillatore che mostra la direzione del trend e ne misura la forza in percentuale. Il calcolo del BACD Cloud è il seguente: 1- Calcola due medie mobili esponenziali. Uno di loro è più veloce dell'altro. Chiamerò il primo (Veloce) e il secondo (Lento) 2- Trova il centro tra di loro, dove: Center MA = (Fast + Slow) / 2 3- Calcola la linea BACD come segue: BACD = 100 * (Fast / Center MA) 4- Calcola la linea del segnale BACD
Bermaui Channel
Muhammad Elbermawi
5 (27)
This is a price channel that shows five important price levels on the chart. Those levels are: 1. The Highest High (HH) of the previous x bars. 2. The Highest Low (HL) of the previous x bars. 3. The Center Line. 4. The Lowest High (LH) of the previous x bars. 5. The Lowest Low (LL) of the previous x bars. How does Bermaui Channels Captures Overbought  area Think of the distance between HH and HL levels as an overbought area. When the price candles or bars crosses the HL to the upside this
Horus EA
Muhammad Elbermawi
3.67 (3)
Horus EA per MT4 Migliaia di anni fa, gli antichi egizi inventarono un sistema di conteggio che usavano per misurare le loro terre e pesare le loro merci. Questo sistema era noto come " Occhio di Horus ". L'occhio di Horus era associato al mito del dio Osiride e divenne uno dei simboli sacri dei faraoni. Ho usato le equazioni matematiche nell'Occhio di Horus con la sequenza di Fibonacci per costruire un sistema di gestione del denaro a progressione negativa che è dell'89% più sicuro del famos
Filtro:
pornchai_p
340
pornchai_p 2023.06.04 04:21 
 

This is the best RSI indicator. HIghly recommnended. Please kindly send me the free Stochastic indicator. Thank you.

Hisham Ghoneim
301
Hisham Ghoneim 2022.08.18 10:39 
 

Great work as usual

Suvashish Halder
13535
Suvashish Halder 2022.04.07 05:58 
 

Best RSI indicator in this market and it's a real deal. Thank you for your work ❤

Muhammad Elbermawi
52260
Risposta dello sviluppatore Muhammad Elbermawi 2022.04.07 08:20
You are welcome. Suvashish 🙏
faithdefender
1691
faithdefender 2022.02.12 21:05 
 

This man is just plain honest! I own three of his indicators and I cant complain. Bermaui Bands, TDO and now RSI Candles. I may not be making money, but the indicators do what he says they would do. And the price is fair especially in the light of 1000 activations compared to many of the sleazy Vendors who only give 5. And then they (other Vendors) turn around and lie to you saying "we are following the rules set by MQL and are prohibited from giving more than 5. Apparently, Mr. Elbimawri didnt get the memo. Nevertheless, why the lengthy review? I just purchased a different RSI indicator (because it was 10 bucks cheaper) and I have nothing but regrets. It is called "RSI As Bar". I sent the complaint to the Vendor the first hour, , but he never responded. Not only that, but he has pulled his indicator. If I go to the page, I now have a note that says "Unfortunately, "RSI as Bar" is unavailable." He will probably repackage it with a new name and sell it again to the public. Why? Because he can do it and get away with it since there is no accountability on this platform. MQL loves the vendors because it brings people to this venue, but to think of the people who have been ripped off! I hope Mr Elbermawi continues to come up with new ideas. And thank you for your honesty in value and indicators.

Muhammad Elbermawi
52260
Risposta dello sviluppatore Muhammad Elbermawi 2022.02.13 12:27
Thanks a lot for all the great words 🙏
cvdestyfx
2702
cvdestyfx 2021.03.09 17:33 
 

The best RSI indicator!

Muhammad Elbermawi
52260
Risposta dello sviluppatore Muhammad Elbermawi 2021.03.10 12:09
Thanks a lot, cvdestyfx 🤗
Livio Yves Chathuant
878
Livio Yves Chathuant 2020.12.26 04:44 
 

Hi really happy with my purchase this indicator reveals to us and confirms the future price movements, I have this very complete tool for swing trading.thank you M. Muhammad

Baboloki Mathabe
605
Baboloki Mathabe 2020.10.31 14:31 
 

Author Mr Albermawi provides quality products this is an addition to the other tools got from him

Muhammad Elbermawi
52260
Risposta dello sviluppatore Muhammad Elbermawi 2020.10.31 18:14
Thanks a lot, Baboloki Mathabe 🤗
Rispondi alla recensione