DMI Trend
- Indicatori
- Norio Takahashi
- Versione: 2.1
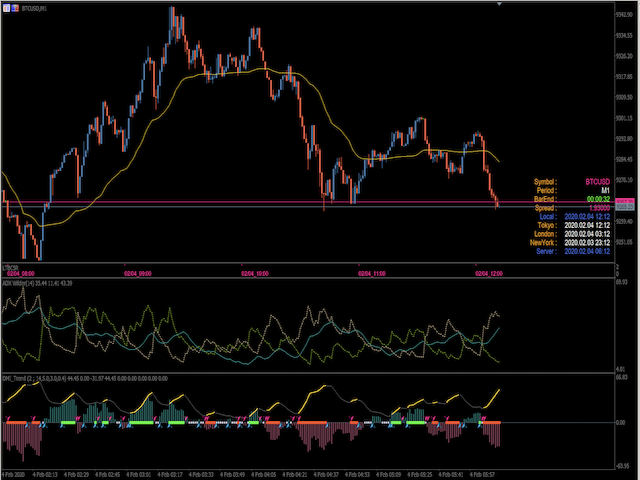
The indicator allows you to simplify the interpretation of signals produced by the classical ADX indicator.
The position of the hight bars of the histogram relative to zero and the histogram coloring indicate the direction of price movement determined by the intersection of DI+ / DI-.
The position of the hight bars of the histogram relative to zero and the color indicate the strength of the price movement.
The indicator is a logical continuation of the series of indicators using this classical and efficient technical indicator.
The strength of the trend is determined by the slope of ADX line.
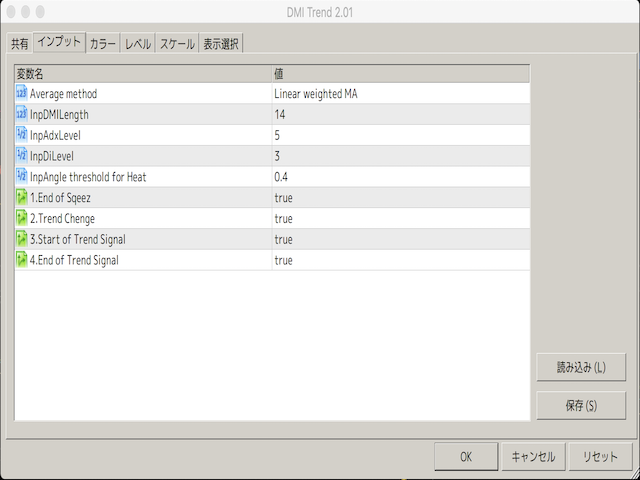
If the histogram of DI+ / DI-. are lower than the specified value, judge it as suqueeze and do not recommend trading.
Displaying the arrows makes it easier to see.
The position of the hight bars of the histogram relative to zero and the histogram coloring indicate the direction of price movement determined by the intersection of DI+ / DI-.
The position of the hight bars of the histogram relative to zero and the color indicate the strength of the price movement.
The indicator is a logical continuation of the series of indicators using this classical and efficient technical indicator.
The strength of the trend is determined by the slope of ADX line.
If the histogram of DI+ / DI-. are lower than the specified value, judge it as suqueeze and do not recommend trading.
Displaying the arrows makes it easier to see.


Very good indicator! Thank you very much.