• Panoramica
  • Recensioni (5)
  • Commenti (15)
  • Novità

Divergence dashboard MT5

5

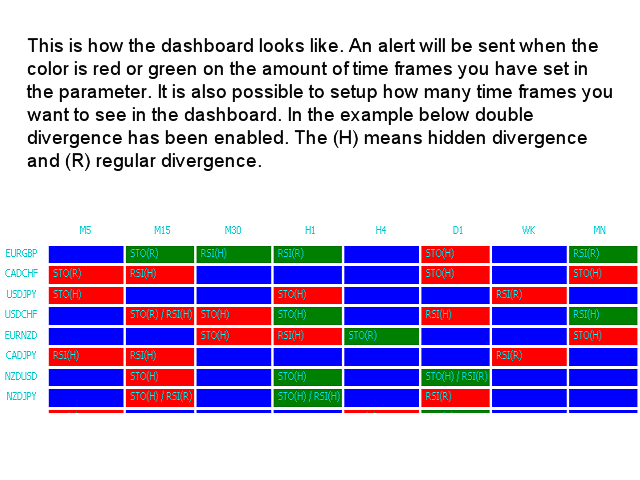
Questo indicatore del dashboard di divergenza multi time frame e multi simbolo invia un avviso quando una o due divergenze diverse sono state identificate su più time frame e non su singole divergenze. Può essere utilizzato con tutte le fasce orarie da M1 a MN. È possibile visualizzare contemporaneamente nella dashboard un massimo di 9 intervalli di tempo. È possibile abilitare il filtro di tendenza della media mobile, dell'RSI o delle bande di Bollinger per filtrare solo le configurazioni più forti. Combinato con le tue regole e tecniche, questo indicatore ti permetterà di creare (o migliorare) il tuo potente sistema.

Caratteristiche

  • Può rilevare le divergenze per i seguenti oscillatori/indicatori: MACD, Stochastics, OsMA, RSI, CCI, Awesome, OBV, ADX, ATR, MFI, Momentum e Accelerator.
  • È possibile selezionare fino a 9 fasce orarie da utilizzare.
  • Esegue continuamente un ordinamento della classifica di divergenza all'interno della dashboard.
  • Cliccando all'interno di un rettangolo si aprirà un nuovo grafico con il simbolo e la fascia oraria in questione.
  • L'indicatore può scrivere i segnali su variabili globali che possono essere utilizzate da un Expert Advisor per il trading automatico. Ad esempio questo prodotto .

È sufficiente posizionare l'indicatore su un grafico e riceverai un avviso da qualsiasi simbolo a tua scelta.

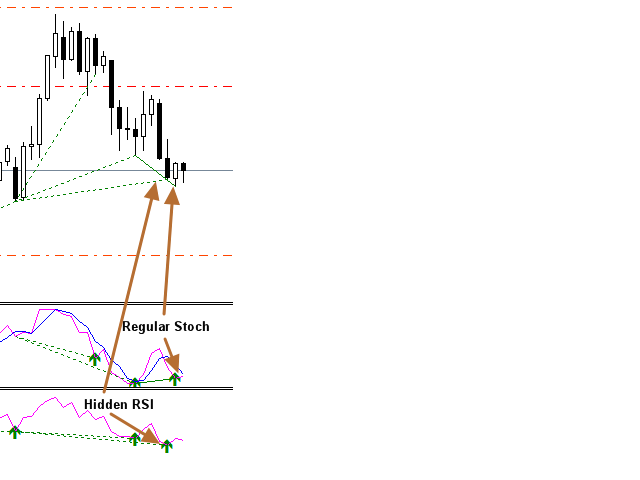
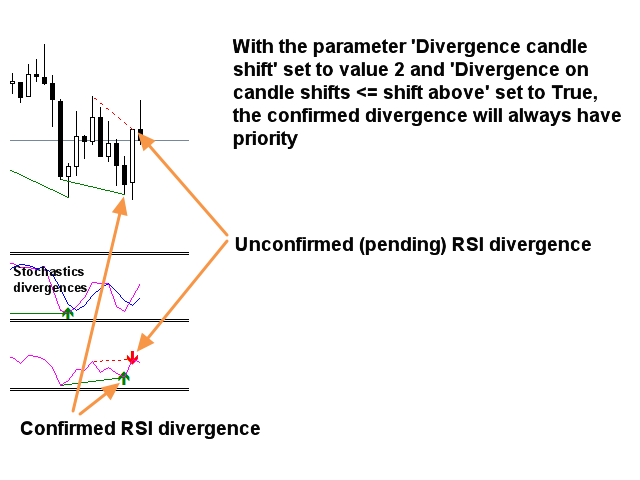
Verranno prese in considerazione sia le divergenze regolari/classiche (inversione di tendenza) che quelle nascoste (proseguimento del trend). Quindi potrebbe esserci una divergenza regolare e allo stesso tempo una divergenza nascosta su un altro lasso di tempo. Si prega di vedere lo screenshot n. 3 di seguito. L'esempio mostra divergenze da 2 indicatori, ma potrebbe anche provenire da uno stesso indicatore. E' possibile però impostare se utilizzare solo divergenze regolari o solo nascoste modificando un parametro.

Parametri di input

Si prega di trovare la descrizione e la spiegazione dei parametri di input qui .

Importante

Si prega di notare che questo indicatore non è supportato nel tester di strategia. Inoltre, non disegnerà linee e frecce o venderà e acquisterà consigli su alcun grafico.

L'indicatore deve essere messo su un grafico M5. Un grafico pulito (vuoto) senza altri indicatori o Expert Advisor su di esso che potrebbero interferire con il dashboard. La dashboard verrà caricata in una finestra dell'indicatore che puoi espandere per coprire l'intero grafico.


Recensioni 5
Multi Disipliner
352
Multi Disipliner 2022.02.21 21:10 
 

nice

Andrew William Little
467
Andrew William Little 2020.12.10 03:18 
 

Great indicator for trading divergences on multiple time frames with both individual and simultaneous alignment. Definitely recommended!

Bruno Cano
268
Bruno Cano 2019.11.27 01:54 
 

Excellent indicator, on the other hand Jan is an excellent person who has managed to answer my questions quickly and easily.

I recommend this indicator.

Prodotti consigliati
Questo indicatore multi time frame e multi simbolo esegue la scansione di barre pin, stelle del mattino/sera, engulfing, pinzette, colpi a tre linee, barre interne e gagliardetti e triangoli.   L'indicatore può essere utilizzato anche in modalità grafico singolo. Si prega di leggere di più su questa opzione nel prodotto   blog .   Combinato con le tue regole e tecniche, questo indicatore ti consentirà di creare (o migliorare) il tuo potente sistema. Caratteristiche Può monitorare contemporaneam
Questo indicatore di tendenza multi time frame e multi simbolo invia un avviso quando è stata identificata una forte tendenza o inversione di tendenza. Può farlo selezionando di costruire il cruscotto usando Media mobile (singola o doppia (crossover MA)), RSI, bande di Bollinger, ADX, indice composito (Constance M. Brown), Awesome (Bill Williams), MACD (linea di segnale ), Heiken Ashi livellato, media mobile di Hull, crossover stocastici, attivatore di Gann HiLo e indice dinamico dei trader. Può
Utilities
Douglas Lucio De Araujo
Indicator with 3 features - Clock : Clock independent of the chart, counting continues even when the market is closed. - Template : After setting up a configuration in any graphic, be it color patterns, indicators, zoom ... The configuration will be copied to all active graphics. - TimeFrame : Set the TimeFrame on a chart, and with just one click all the active charts will be changed to the same TimeFrame.
Santa Trend
Marco Aurelio Cestari
4.22 (9)
Santa Trend Indicator  is an efficient way to forecast and detect the trend in any market. Advantages Generates instant buy and sell signals. Provides an alternate exit strategy to your existing trading system. Never repaints, never backpaints, never recalculates. Works in all symbols and all timeframes. Perfect trend filter for any strategy or expert advisor. Fully compatible with Expert Advisor (EA) development. Does not lag.
FREE
Bar Sequential
Maximiliano Frisione Figueroa
This indicator can help you clearly identify trend changes in both bullish and bearish markets. The indicator compares the closing price of the last candle with the closing price of the candle "X" periods ago (input parameter). In an uptrend, an initial number '1' is plotted if a candle closes higher than the closing of a candle "X" periods ago. In a downtrend, an initial number '1' is plotted if a candle closes below the closing of a candle "X" periods ago. Subsequent numbers are plotted when e
Questo indicatore multi time frame e multi simbolo identifica formazioni alto/basso doppie o triple o un successivo breakout della scollatura (confermato alto/basso). Offre RSI, pin bar, engulfing, tweezer, filtri a stella del mattino/sera e opzioni di filtro di divergenza che consentono di filtrare solo le configurazioni più forti.       L'indicatore può essere utilizzato anche in modalità grafico singolo. Si prega di leggere di più su questa opzione nel prodotto   blog .   Combinato con le tue
The market structure indicator helps traders easily read market trends, this indicator shows trend continuity and trend reversals, this tool will be very useful for beginners who are just getting to know market structure, the indicator will provide visualization of the patterns that occur Key Features: 1. BOS pattern: The indicator will provide an overview of the Break Of Structure pattern, where the pattern will indicate the continuation of the trend 2. CHOCH Pattern: The indicator will prov
I do not have the exact indicator for MT4 but the nearest possible look alike can be downloaded from here . Also you may check this link . This is the exact conversion from TradingView: "Donchian Trend Ribbon" By "LonesomeTheBlue". One of the coolest indicators out there to detect trend direction and strength. As a trader you always need such indicator to avoid getting chopped in range markets. There are ten buffers as colors to use in EAs also. The indicator is loaded light and non-repaint. Not
Optimistic trader may enter the market when the price crosses the Aqua line. More reliable entry will be when the price crosses the Blue line. When the price comes back and crosses the Red line you can open a position in the course of price movements.
Breakout Trend Lines EA
Alexander Nikolaev
3 (1)
This EA trades when the trend line, or high (low) price is broken. Trend lines and extremes are found by the specified parameters. In addition to trading, it also displays these lines on the chart. A trade occurs when the price goes outside the line and the candlestick closes. Also, the advisor may not trade if the market has low volatility, or other filters do not allow it to do so in order to cut off non-profit trades. It can set a stop loss in a parabolic pattern, or use a simple trailing st
SupportResistence
Eduardo Borges Mariani
SupportResistance is a dynamic support and resistance indicator based on the high and low of the previous candles. The calculation parameters are configurable. You can use the maximum and minimum values of the previous candle as a reference, or you can use the maximum and minimum of a group of previous candles. The indicator uses a red line to indicate resistance and a green line to indicate support. When a support or resistance is broken, its line is dotted, being restored only when it b
Kill Zones MT5
Diego Arribas Lopez
MT4 Version Kill Zones Kill Zones allows you to insert up to 3 time zones in the chart. The visual representation of the Kill Zones in the chart together with an alert and notification system helps you to ignore fake trading setups occurring outside the Kill Zones or specific trading sessions. Using Kill Zones in your trading will help you filter higher probability trading setups. You should select time ranges where   the market   usually reacts with high volatility. Based on   EST time zone, f
Multi TimeFrame Moving Average MT5
Ahmed Alaaeldin Abdulrahman Ahmed Elherzawi
Unlock the power of the market with the Investment Castle Multi Time Frame Moving Average Indicator. Simplify your trading journey by easily identifying trends and pullbacks across multiple time frames on one convenient chart. This indicator is a must-have tool for any serious trader. Available for MT4 and MT5, and exclusively on the MQL5 market, customize your experience by adding as many indicators as you need on the chart, each with their own unique time frame or period.   Enhance your strat
【Super Scanner】Indicator Introduction : The color of the Super Scanner which is green and climbing up means that the price trend is going up.The color of the Super Scanner is red and going down means that the price trend is going down. It is very simple to use it to judge the market trend! What's even better is that the open parameters of the indicators allow investors to adjust. You can adjust【Super Scanner】according to your needs. Adjust it faster to be closer to short-term market fluctuati
Zigzag X Fibo
Ian David Emmanuel Bello
The ZigZag indicator's main objective is to highlight significant price movements by filtering out minor price fluctuations. It enables the visualization of trends by eliminating market "noise," which can assist traders in making more informed decisions. Adding the Fibonacci indicator, which is a powerful tool for identifying potential support and resistance levels in financial markets.
--- StudentK Sync Chart --- 1. Move charts at the same time 2. Cross check among different Symbols and Timeframes 3. Plan your own trading strategies --- Context --- StudentK is not indicated as a master or K Sir for knowledgeable person who claims for winning all the time. (But lots of traders should know the fact that it is rarely truth, especially in fluctuated period of time) StudentK is a group of years-experienced traders who want to share amazing tools in Free and Paid versions. Aimi
SuperTrendCCI
Volkan Mustafaoglu
The best quality application of the famous Super Trend indicator that requires no introduction. It is completely faithful to the original algorithm and powered by the CCI indicator. - easy to trade - It implements all kinds of warnings. - It implements a multi-timezone dashboard. - It cannot be repainted or backpainted. Input parameters - ATR Period – This is the average true range period. - ATR Multiplier - The ATR multiplier that defines the trend. - CCI - Makes trend following powerful. -
This indicator is a perfect wave automatic analysis indicator for practical trading! 黄金实战 案例... The standardized definition of the band is no longer a wave of different people, and the art of man-made interference is eliminated, which plays a key role in strict analysis of the approach.=》Increase the choice of international style mode, (red fall green rise style) The  purchase discount is currently in progress! Index content: 1.Basic wave: First, we found the inflection point of the ba
To get access to MT4 version please click   here . This is the exact conversion from TradingView: QQE MT4 Glaz-modified by JustUncleL This is a light-load processing and non-repaint indicator. All input options are available. This is not a multi time frame indicator. Buffers are available for processing in EAs. You can message in private chat for further changes you need.
PAX BDB Trade Chaos system of Bill Williams   (Bearish/Bullish divergent bar). One of the signals of the "Trade Chaos" system of Bill Williams. (First wiseman) When bar moving away from the  "Alligator" indicator and there is divergence on the Awesome Oscillator indicator, it shows a potential point of movement change. It is based on the opening/closing of the bar, the position relative to the previous ones, the Alligator and AO. When trading, the entrance is at the breakthrough of the bar(sh
To get access to MT4 version please click here . - This is the exact conversion from TradingView: "Twin Range Filter" by " colinmck ". - This is a light-load processing and non-repaint indicator. - All input options are available.  - Buffers are available for processing in EAs. - You can message in private chat for further changes you need. Thanks for downloading
RSIScalperPro
PATRICK WENNING
Introducing RSIScalperPro - the revolutionary RSI-based indicator for Metatrader 5, specifically designed for scalping in the one-minute chart. With RSIScalperPro, you'll have a powerful toolkit for precise entry and exit signals to take your trading to the next level. RSIScalperPro utilizes two different RSI indicators that provide clear signals for overbought and oversold areas. You can customize the time periods and limit values of the two RSIs according to your preferences to achieve the be
I  recommend you to read the   product's blog  (manual) from start to end so that it is clear from the beginning what the indicator offers. This multi time frame and multi symbol indicator scans for engulfing and tweezer formations.  The indicator can also be used in single chart mode. Combined with your own rules and techniques, this indicator will allow you to create (or enhance) your own powerful system. Features Can monitor all symbols visible in your Market Watch window at the same time. A
Here I present you this awesome indicator I made. This is a nique combination witch puts you in the same level as MM's. So you can surf a lot of waves and identify the rally time, breakouts, and the perfect time to get in the market. ---- The SSL Channel is a great all-rounder based on 2 Simple Moving Averages, one of recent Highs, one of recent Lows. The calculation prints a   channel   on the chart consisting of 2 lines. This strategy gives a Long signal when price closes above the top of the
The Market Structures Pro indicator finds and displays 5 (five) patterns of the Smart Money Concepts (SMC) system on the chart, namely: Break Of Structures (BoS)       Change of character (CHoCH) Equal Highs & Lows Premium, Equilibrium and Discount zones with Fibo grid High-high, Low-low, High-low and Low-high extremes Patterns are displayed for two modes - Swing and Internal and are easily distinguished by color on the chart. Internal mode features higher contrast colors, finer lines, and sm
I recommend you to read the  product's blog  (manual) from start to end so that it is clear from the beginning what the indicator offers. This multi time frame and multi symbol supply and demand zone dashboard indicator sends alerts when the price has reached a supply/demand zone. It is also possible to use it to be alerted about regular double tops/bottoms instead of zones. It can be used with all time frames from M1 to MN. Maximum 9 time frames can be shown in the dashboard at the same time. 
Didi Index
Flavio Javier Jarabeck
4.77 (22)
The famous brazilian trader and analyst Didi Aguiar created years ago a study with the crossing of 3 Simple Moving Averages called "Agulhada do Didi", then later was also named Didi Index, as a separate indicator. The period of those SMAs are 3, 8 and 20. As simple as that, this approach and vision bring an easy analysis of market momentum and trend reversal to those traders looking for objective (and visual) information on their charts. Of course, as always, no indicator alone could be used wit
FREE
FRB Day Points
Fernando Baratieri
Day Points Indicadtor that shows the points considered important for X days. (Open,Close, High, Low) Used a lot by those who do day trade. These points can be used for decision making by a trader. You will choose the amount of days ago for it to show. Settings High/Low/Close/Open Show - True/False. Days - Number of days that will show on the chart. Color - Line Color. Style - Line Style.
KT DMA is a modified and advanced version of the classic Displaced Moving Averages with buy/sell crossover alerts and a Multi-Timeframe scanner that shows DMA's direction across each real-time time frame. A Displaced Moving Average is a simple moving average that moves ahead or backward in a time frame (either short-term or long-term). It also allows you to predict price movement more accurately. Features Depicts the trend direction using the alignment of three moving averages. Buy/Sell signa
Squeeze Momentum Indicator for MetaTrader 5 - Unleash the Power of Market Momentum Introducing the "Squeeze Momentum Indicator" for MetaTrader 5, your gateway to mastering market momentum. This advanced tool is meticulously crafted to provide you with actionable insights into market dynamics, helping you make well-informed trading decisions. Basic Details : Indicator Type : Squeeze Momentum Indicator for MetaTrader 5 Key Metrics : Real-time analysis of market momentum and volatility. Customizati
Gli utenti di questo prodotto hanno anche acquistato
Innanzitutto è importante sottolineare che questo sistema di trading è un indicatore Non-Repainting, Non-Redrawing e Non-Lagging, il che lo rende ideale sia per il trading manuale che per quello automatico. Il "Sistema di Trading Smart Trend MT5" è una soluzione completa pensata sia per i trader principianti che per quelli esperti. Combina oltre 10 indicatori premium e offre più di 7 robuste strategie di trading, rendendolo una scelta versatile per diverse condizioni di mercato. Strategia di Tre
Atomic Analyst MT5
Issam Kassas
4.82 (11)
Innanzitutto, vale la pena sottolineare che questo indicatore di trading non è repaint, non è ridisegno e non presenta ritardi, il che lo rende ideale sia per il trading manuale che per quello automatico. L'Analista Atomico è un indicatore di azione del prezzo PA che utilizza la forza e il momentum del prezzo per trovare un miglior vantaggio sul mercato. Dotato di filtri avanzati che aiutano a rimuovere rumori e segnali falsi, e aumentare il potenziale di trading. Utilizzando più strati di in
FX Volume MT5
Daniel Stein
4.94 (17)
Ricevi il tuo aggiornamento quotidiano sul mercato con dettagli e schermate tramite il nostro Morning Briefing qui su mql5 e su Telegram ! FX Volume è il PRIMO e UNICO indicatore di volume che fornisce una visione REALE del sentiment del mercato dal punto di vista del broker. Fornisce informazioni straordinarie su come gli operatori di mercato istituzionali, come i broker, sono posizionati sul mercato Forex, molto più velocemente dei rapporti COT. Vedere queste informazioni direttamente sul vo
Quantum Trend Sniper
Bogdan Ion Puscasu
5 (37)
Presentazione       Quantum Trend Sniper Indicator   , l'innovativo indicatore MQL5 che sta trasformando il modo in cui identifichi e scambi le inversioni di tendenza! Sviluppato da un team di trader esperti con un'esperienza di trading di oltre 13 anni,       Indicatore Quantum Trend Sniper       è progettato per spingere il tuo viaggio di trading verso nuove vette con il suo modo innovativo di identificare le inversioni di tendenza con una precisione estremamente elevata. *** Acquista Quant
Trend Screener Pro MT5
STE S.S.COMPANY
4.89 (61)
Indicatore di tendenza, soluzione unica rivoluzionaria per il trading di tendenze e il filtraggio con tutte le importanti funzionalità di tendenza integrate in un unico strumento! È un indicatore multi-timeframe e multi-valuta al 100% non ridipingibile che può essere utilizzato su tutti i simboli/strumenti: forex, materie prime, criptovalute, indici e azioni. Trend Screener è un indicatore di tendenza che segue un indicatore efficiente che fornisce segnali di tendenza a freccia con punti nel gra
Innanzitutto, vale la pena sottolineare che questo Strumento di Trading è un Indicatore Non-Ridipingente, Non-Ridisegnante e Non-Laggante, il che lo rende ideale per il trading professionale. L'Indicatore Smart Price Action Concepts è uno strumento molto potente sia per i nuovi che per i trader esperti. Racchiude più di 20 utili indicatori in uno solo, combinando idee di trading avanzate come l'Analisi del Trader del Circolo Interno e le Strategie di Trading dei Concetti del Denaro Intelligen
Top indicator for MT5   providing accurate signals to enter a trade without repainting! It can be applied to any financial assets:   forex, cryptocurrencies, metals, stocks, indices .  Watch  the video  (6:22) with an example of processing only one signal that paid off the indicator! MT4 version is here It will provide pretty accurate trading signals and tell you when it's best to open a trade and close it. Most traders improve their trading results during the first trading week with the help of
FX Power MT5 NG
Daniel Stein
5 (4)
Ricevi il tuo aggiornamento quotidiano sul mercato con dettagli e schermate tramite il nostro Morning Briefing qui su mql5 e su Telegram ! FX Power MT5 NG è la nuova generazione del nostro popolare misuratore di forza delle valute, FX Power. Cosa offre questo misuratore di forza di nuova generazione? Tutto ciò che avete amato dell'FX Power originale IN PIÙ Analisi della forza di ORO/XAU Risultati di calcolo ancora più precisi Periodi di analisi configurabili individualmente Limite di calcolo pe
RelicusRoad Pro MT5
Relicus LLC
4.82 (22)
Ora $ 147 (aumentando a $ 499 dopo alcuni aggiornamenti) - account illimitati (PC o MAC) Manuale utente di RelicusRoad + Video di formazione + Accesso al gruppo Discord privato + Stato VIP UN NUOVO MODO DI GUARDARE IL MERCATO RelicusRoad è l'indicatore di trading più potente al mondo per forex, futures, criptovalute, azioni e indici, fornendo ai trader tutte le informazioni e gli strumenti di cui hanno bisogno per rimanere redditizi. Forniamo analisi tecniche e piani di trading per aiutar
Auto Order Block with break of structure based on ICT and Smart Money Concepts Futures Break of Structure ( BoS )             Order block ( OB )            Higher time frame Order block / Point of Interest ( POI )    shown on current chart           Fair value Gap ( FVG ) / Imbalance   ,  MTF      ( Multi Time Frame )    Volume Imbalance     ,  MTF          vIMB Gap’s Equal High / Low’s     ,  MTF             EQH / EQL Liquidity               Current Day High / Low           HOD /
XQ Indicator MetaTrader 5
Marzena Maria Szmit
5 (1)
Step into the realm of Forex trading with confidence and precision using XQ, a cutting-edge Forex indicator designed to elevate your trading game to unprecedented heights. Whether you're a seasoned trader or just stepping into the world of currency exchange, XQ Forex Indicator empowers you with the insights and signals needed to make informed trading decisions. The signal conditions are a combination of three indicators, and XQ Forex Indicator only display  medium and long-term trends . The ind
Blahtech Supply Demand MT5
Blahtech Limited
4.57 (14)
Was: $299  Now: $99   Supply Demand uses previous price action to identify potential imbalances between buyers and sellers. The key is to identify the better odds zones, not just the untouched ones. Blahtech Supply Demand indicator delivers functionality previously unavailable on any trading platform. This 4-in-1 indicator not only highlights the higher probability zones using a multi-criteria strength engine, but also combines it with multi-timeframe trend analysis, previously confirmed swings
Advanced Supply Demand MT5
Bernhard Schweigert
4.53 (15)
La migliore soluzione per qualsiasi principiante o trader esperto! Questo indicatore è uno strumento di trading unico, di alta qualità e conveniente perché abbiamo incorporato una serie di funzionalità proprietarie e una nuova formula. Con questo aggiornamento, sarai in grado di mostrare fusi orari doppi. Non solo potrai mostrare una TF più alta, ma anche entrambe, la TF del grafico, PIÙ la TF più alta: SHOWING NESTED ZONES. Tutti i trader di domanda di offerta lo adoreranno. :) Informazioni imp
ICT, SMC, SMART MONEY CONCEPTS, SMART MONEY, Smart Money Concept, Support and Resistance, Trend Analysis, Price Action, Market Structure, Order Blocks, BOS/CHoCH,   Breaker Blocks ,  Momentum Shift,   Supply&Demand Zone/Order Blocks , Strong Imbalance,   HH/LL/HL/LH,    Fair Value Gap, FVG,  Premium  &   Discount   Zones, Fibonacci Retracement, OTE, Buy Side Liquidity, Sell Side Liquidity, BSL/SSL Taken, Equal Highs & Lows, MTF Dashboard, Multiple Time Frame, BigBar, HTF OB, HTF Market Structure
L'indicatore Quadrato di Gann è uno strumento potente di analisi di mercato basato sull'articolo "Formula Matematica per le Previsioni di Mercato" scritto da W.D. Gann. Questo strumento utilizza concetti matematici e teorie di Gann per effettuare un'analisi precisa del mercato. Utilizza i quadrati di 144, 90, 52 e anche il quadrato di 9. Inoltre, integra il metodo del  per il quadrato di 9 e la sua relazione con canali e modelli stellari di quel quadrato. Manuale Utente e Applicazione: Prima di
AW Trend Predictor MT5
AW Trading Software Limited
4.76 (54)
La combinazione di trend e livelli di rottura in un unico sistema. Un algoritmo di indicatore avanzato filtra il rumore del mercato, determina la tendenza, i punti di ingresso e i possibili livelli di uscita. I segnali indicatori sono registrati in un modulo statistico, che permette di selezionare gli strumenti più adatti, mostrando l'efficacia dello storico dei segnali. L'indicatore calcola i segni Take Profit e Stop Loss. Manuale e istruzioni ->   QUI   / versione MT4 ->   QUI Come fare tradi
Volume by Price MT5
Brian Collard
5 (3)
The Volume by Price Indicator for MetaTrader 5 features Volume Profile and Market Profile TPO (Time Price Opportunity). Get valuable insights out of currencies, equities and commodities data. Gain an edge trading financial markets. Volume and TPO histogram bar and line charts. Volume Footprint charts. TPO letter and block marker charts including split structures. Versatile segmentation and compositing methods. Static, dynamic and flexible ranges with relative and/or absolute visualizations. Lay
Presentazione       Quantum Breakout PRO   , l'innovativo indicatore MQL5 che sta trasformando il modo in cui scambi le zone di breakout! Sviluppato da un team di trader esperti con un'esperienza di trading di oltre 13 anni,       Quantum Breakout PRO       è progettato per spingere il tuo viaggio di trading a nuovi livelli con la sua strategia innovativa e dinamica della zona di breakout. Quantum Breakout Indicator ti fornirà frecce di segnalazione sulle zone di breakout con 5 zone target
Owl Smart Levels MT5
Sergey Ermolov
4.47 (36)
Versione MT4  |  FAQ L' indicatore Owl Smart Levels è un sistema di trading completo all'interno dell'unico indicatore che include strumenti di analisi di mercato popolari come i frattali avanzati di Bill Williams , Valable ZigZag che costruisce la corretta struttura a onde del mercato, e i livelli di Fibonacci che segnano i livelli esatti di entrata nel mercato e luoghi per prendere profitti. Descrizione dettagliata della strategia Istruzioni per lavorare con l'indicatore Consulente-assistente
Gartley Hunter Multi
Siarhei Vashchylka
5 (5)
Gartley Hunter Multi - An indicator for searching for harmonic patterns simultaneously on dozens of trading instruments and on all classic timeframes: (m1, m5, m15, m30, H1, H4, D1, Wk, Mn). Manual (Be sure to read before purchasing) | Version for MT4 Advantages 1. Patterns: Gartley, Butterfly, Shark, Crab. Bat, Alternate Bat, Deep Crab, Cypher 2. Simultaneous search for patterns on dozens of trading instruments and on all classic timeframes 3. Search for patterns of all possible sizes. Fr
Trend Line Map Pro MT5
STE S.S.COMPANY
4.67 (9)
Trend Line Map indicator is an addons for   Trend Screener Indicator . It's working as a scanner for all signals generated by Trend screener ( Trend Line Signals ) . It's a Trend Line Scanner based on Trend Screener Indicator.  If you don't have Trend Screener Pro Indicator,   the Trend Line Map Pro will not work.     LIMITED TIME OFFER : Trend Line Map Indicator is available for only 50 $ and lifetime. ( Original price 125$ ) By accessing to our MQL5 Blog,  you can find all our premium indica
TrendDecoder Premium MT5
Christophe, Pa Trouillas
5 (1)
Identificare i range e le prossime mosse probabili     |    Ottenere i primi segnali e la forza delle tendenze     |    Ottenere uscite chiare prima dell'inversione     |    Individuare i livelli di Fibo che il prezzo testerà   |  Indicatore non tracciante e non ritardato - ideale per il trading manuale e automatizzato - adatto a tutti gli asset e a tutte le unità temporali 50% di sconto   - per il lancio poi torna a   >>   149 $ Dopo l'acquisto,   contattatemi su questo canale  per le impostazi
MetaBands M5
Vahidreza Heidar Gholami
4.67 (3)
MetaBands uses powerful and unique algorithms to draw channels and detect trends so that it can provide traders with potential points for entering and exiting trades. It’s a channel indicator plus a powerful trend indicator. It includes different types of channels which can be merged to create new channels simply by using the input parameters. MetaBands uses all types of alerts to notify users about market events. Features Supports most of the channel algorithms Powerful trend detection algorith
TPSproTREND PrO MT5
Roman Podpora
5 (5)
TPSpro TRENDPRO  - is a trend indicator that automatically analyzes the market and provides information about the trend and each of its changes, as well as giving signals for entering trades without redrawing! The indicator uses each candle, analyzing them separately. referring to different impulses - up or down impulse. Exact entry points into transactions for currencies, crypto, metals, stocks, indices!  -  Version MT4                  DETAILED DESCRIPTION        /       TRADING SETUPS       
Was: $249  Now: $99   Market Profile defines a number of day types that can help the trader to determine market behaviour. A key feature is the Value Area, representing the range of price action where 70% of trading took place. Understanding the Value Area can give traders valuable insight into market direction and establish the higher odds trade. It is an excellent addition to any system you may be using. Inspired by Jim Dalton’s book “Mind Over Markets”, this indicator is designed to suit the
Golden Spikes Detector
Batsirayi L Marango
5 (1)
Golden Spikes Detector This indicator is based on an advanced strategy primarily for trading spikes on Boom and Crash Indices. Complex algorithms were implemented to detect high probability entries only. It alerts on potential Buy and Sell entries. To trade spikes on the Deriv or Binary broker, only take Buy Boom and Sell Cash alerts. It was optimised to be loaded on 5-minute timeframe although multiple timeframe analysis is done in the background. Features ·             Desktop pop up and sound
IX Power MT5
Daniel Stein
5 (2)
IX Power   porta finalmente l'imbattibile precisione di FX Power ai simboli non-Forex. Determina con precisione l'intensità delle tendenze a breve, medio e lungo termine dei vostri indici preferiti, azioni, materie prime, ETF e persino criptovalute. Potete   analizzare tutto ciò che   il vostro terminale ha da offrire. Provatelo e sperimentate come   il vostro tempismo migliori significativamente   durante il trading. Caratteristiche principali di IX Power Risultati di calcolo precisi al
Golden Gate Algo MT5
James David Lane
4 (6)
40% DI SCONTO PER NATALE! AUMENTO DEL PREZZO A $250 IL 1 GENNAIO! Presentiamo GoldenGate Entries: una soluzione di trading all'avanguardia! Scopri un approccio rivoluzionario al trading con GoldenGate Entries (GGE), un indicatore avanzato progettato per migliorare la tua esperienza di trading. GGE offre un set completo di funzionalità per fornire agli utenti precisione e fiducia nelle loro decisioni di trading. Coppie: Qualsiasi (FX - Materie prime - Azioni - Azioni - Cripto) TimeFrame
Matrix Arrow Indicator MT5
Juvenille Emperor Limited
5 (14)
Matrix Arrow Indicator MT5   è un trend unico 10 in 1 che segue un indicatore multi-timeframe al   100% non ridipinto   che può essere utilizzato su tutti i simboli/strumenti:   forex ,   materie prime ,   criptovalute ,   indici ,   azioni .  Matrix Arrow Indicator MT5  determinerà la tendenza attuale nelle sue fasi iniziali, raccogliendo informazioni e dati da un massimo di 10 indicatori standard, che sono: Indice di movimento direzionale medio (ADX) Indice del canale delle materie prime (CCI
Bill Williams Advanced
Siarhei Vashchylka
5 (3)
Bill Williams Advanced is designed for automatic chart analysis using Bill Williams' "Profitunity" system. The indicator analyzes four timeframes at once. Manual (Be sure to read before purchasing) Advantages 1. Automatically analyzes the chart using the "Profitunity" system of Bill Williams. The found signals are placed in a table in the corner of the screen. 2. Equipped with a trend filter based on the Alligator indicator. Most of the system signals are recommended to be used only accordi
Altri dall’autore
Ti consiglio di leggere il       blog del prodotto   (manuale) dall'inizio alla fine in modo che       è chiaro fin dall'inizio cosa offre l'EA. La strategia principale di questo Expert Advisor (EA) è piazzare operazioni quando 3 medie mobili (MA) sono in allineamento consecutivo e ad una certa distanza l'una dall'altra (può essere utilizzata ad esempio per una strategia poco conosciuta utilizzata da alcuni trader istituzionali , che coinvolge le MA 10, 20 e 30 sulla fascia oraria D1). L'EA fun
Questo indicatore multi time frame e multi simbolo identifica formazioni alto/basso doppie o triple o un successivo breakout della scollatura (confermato alto/basso). Offre filtri RSI, pin bar, engulfing, tweezer, stelle del mattino/sera, nonché MACD, Awesome (AO) o filtri divergenza RSI che consentono di filtrare solo le configurazioni più forti.       L'indicatore può essere utilizzato anche in modalità grafico singolo. Si prega di leggere di più su questa opzione nel prodotto   blog .   Combi
I recommend you to read the   product's blog  (manual) from start to end so that it is clear from the beginning what the indicactor offers. This multi time frame and multi symbol divergence dashboard indicator sends an alert when one or two different divergences have been identified. It can be used with all time frames from M1 to MN. It is possible to enable moving average or RSI trend filter to filter out only the strongest setups. Combined with your own rules and techniques, this indicator wi
I recommend you to read the   product's blog  (manual) from start to end so that it is clear from the beginning what the indicactor offers. This multi time frame and multi symbol indicator can identify the following 5 crosses: when a fast moving average crosses a slow moving average line. when price has reached a single moving average (closed above/below or just bounced). when a triple moving average formation has appeared (all 3 MA:s in consecutive alignment) when the MACD main line crosses th
The indicator identifies when a divergence occurs between price and an indicator or oscillator. It identifies both regular and hidden divergences. Combined with your own rules and techniques, this indicator will allow you to create (or enhance) your own powerful system. Features Can detect divergences for the following oscillators/indicators:   MACD, OsMA, Stochastics, RSI, CCI, RVI, Awesome, ADX, ATR, OBV, Composite index, MFI and Momentum. Only one oscillator/indicator can be selected. Draws
FREE
Questo indicatore multi-time frame e multi-simbolo identifica i modelli doppio alto/basso, testa e spalla, gagliardetto/triangolo e bandiera. È anche possibile impostare avvisi solo quando si è verificato un breakout della scollatura/triangolo/asta della bandiera (breakout della scollatura = segnale confermato per la parte superiore/inferiore e testa e spalle).       L'indicatore può essere utilizzato anche in modalità grafico singolo. Si prega di leggere di più su questa opzione nel prodotto  
Questo indicatore di tendenza multi time frame e multi simbolo invia un avviso quando è stata identificata una forte tendenza o inversione di tendenza. Può farlo selezionando di costruire il cruscotto usando Media mobile (singola o doppia (crossover MA)), RSI, bande di Bollinger, ADX, indice composito (Constance M. Brown), Awesome (Bill Williams), MACD (linea di segnale ), Heiken Ashi livellato, media mobile di Hull, crossover stocastici, attivatore di Gann HiLo e indice dinamico dei trader. Può
This multi time frame and multi symbol indicator scans for pin bars. Combined with your own rules and techniques, this indicator will allow you to create (or enhance) your own powerful system. Features Can monitor all symbols visible in your Market Watch window at the same time. Apply the indicator to just one chart and instantly monitor the entire market. Can monitors every time frame, from M1 to MN, and sends you a real-time alert when a pin bar is identified. All Metatrader native alert types
Please if possible consider the  paid version  which I will continue to develop (there will be no future updates for this free version). This Expert Advisor identifies when a divergence occurs between price and an oscillator/indicator. It identifies both regular/classical (trend reversal) and hidden (trend continuation) divergences. It has RSI, bollinger, stochastics, moving average and ADX filter options which makes it possible to filter out only the strongest setups. The default settings ar
FREE
Questo indicatore può inviare avvisi quando si verifica un cambiamento di colore Heiken Ashi Smoothed. Combinato con le tue regole e tecniche, questo indicatore ti permetterà di creare (o migliorare) il tuo potente sistema. Caratteristiche Può inviare tutti i tipi di avvisi. Possibilità di ritardare l'avviso di una o più barre per confermare il cambio colore (tendenza). Parametri di input Spostamento candela per avviso: l'impostazione predefinita è 1. Impostandolo su 0 ti avviserà del cambiament
FREE
Averaging down EA
Jan Flodin
5 (1)
This cost averaging Expert advisor (EA) places additional trades in the same direction as the original (manually opened) order when the price goes against you. It can be used as a grid system or as pure martingale system (exponential increasing of lot size) or smoothed martingale (for instance linear increasing of the lot size). Due to the risk involved, this EA is more suitable for intermediate to advanced traders who are well aware of how to handle risk management and trading an already profit
The indicator identifies when a divergence occurs between price and an indicator or oscillator. It identifies bullish and bearish hidden or regular (classical) divergences. Combined with your own rules and techniques, this indicator will allow you to create (or enhance) your own powerful system. Features Can detect divergences for the following indicators/oscillators: MACD, OsMA (Moving average of Oscillator), Stochastics, RSI, CCI, RVI, Awesome (AO), ADX, ATR, OBV, MFI, Momentum and   Composi
FREE
Ti consiglio di leggere il   blog (manuale) del prodotto   dall'inizio alla fine in modo che sia chiaro fin dall'inizio cosa offre EA. Questo Expert Advisor identifica quando si verifica una divergenza tra il prezzo e un oscillatore/indicatore. Identifica sia le divergenze regolari/classiche (inversione del trend) che quelle nascoste (continuazione del trend). Dispone di zona di domanda/offerta, RSI, bollinger, stocastico, media mobile (MA regolare e MA di Hull), ADX e opzioni di filtro del vol
Questo indicatore può inviare avvisi quando si verifica un cambiamento di colore Heiken Ashi Smoothed. Combinato con le tue regole e tecniche, questo indicatore ti permetterà di creare (o migliorare) il tuo potente sistema. Caratteristiche Può inviare tutti i tipi di avvisi. Possibilità di ritardare di una barra l'avviso per confermare il cambio colore (tendenza). Parametri di input Attendi la chiusura della candela:       'vero o falso'. Impostandolo su 'true' ritarderà l'avviso all'apertura de
FREE
I  recommend you to read the   product's blog  (manual) from start to end so that it is clear from the beginning what the indicator offers. In addition to finding bullish and bearish Three line strike formations this multi symbol and mutli time frame indicator can also scan for the following candlestick patterns (please see screenshots for explanation of the patterns): Three white soldiers (reversal>continuation pattern) Three black crows (reversal>continuation pattern) The formations do not ap
Questo indicatore multi time frame e multi simbolo identifica formazioni alto/basso doppie o triple o un successivo breakout della scollatura (confermato alto/basso). Offre RSI, pin bar, engulfing, tweezer, filtri a stella del mattino/sera e opzioni di filtro di divergenza che consentono di filtrare solo le configurazioni più forti.       L'indicatore può essere utilizzato anche in modalità grafico singolo. Si prega di leggere di più su questa opzione nel prodotto   blog .   Combinato con le tue
I  recommend you to read the   product's blog  (manual) from start to end so that it is clear from the beginning what the indicator offers. This multi time frame and multi symbol indicator identifies double top/bottom, head & shoulders, pennant/triangle and flag patterns. It is also possible to setup alerts only when a neckline/triangle/flagpole breakout has occured (neckline breakout = confirmed signal for top/bottoms and head & shoulders).  The indicator can also be used in single chart mode.
Questo indicatore della zona di domanda e offerta disegna le zone sul grafico e invia avvisi quando il prezzo ha raggiunto o rotto una zona. È anche possibile utilizzarlo per essere avvisati di doppi cime/basse regolari invece che di zone. È possibile utilizzare filtri RSI, volume e divergenza per filtrare solo le configurazioni più potenti. Combinato con le tue regole e tecniche, questo indicatore ti consentirà di creare (o migliorare) il tuo potente sistema. Questo indicatore è per il trader p
I recommend you to read the   product's blog  (manual) from start to end so that it is clear from the beginning what the indicactor offers. This multi time frame and multi symbol supply and demand zone dashboard indicator sends alerts when the price has reached a supply/demand zone. It is also possible to use it to be alerted about regular double tops/bottoms instead of zones. It can be used with all time frames from M1 to MN. It is possible to use RSI, divergence (MACD, OsMA, RSI or Awesome) a
I recommend you to read the  product's blog  (manual) from start to end so that it is clear from the beginning what the indicator offers. This multi time frame and multi symbol supply and demand zone dashboard indicator sends alerts when the price has reached a supply/demand zone. It is also possible to use it to be alerted about regular double tops/bottoms instead of zones. It can be used with all time frames from M1 to MN. Maximum 9 time frames can be shown in the dashboard at the same time. 
L'indicatore identifica quando si verifica una divergenza tra il prezzo e un oscillatore/indicatore. Identifica divergenze regolari e nascoste. Ha un'opzione di filtro RSI che consente di filtrare solo le configurazioni più potenti. L'indicatore offre anche opzioni per attendere una formazione Engulfing, un breakout del canale Donchian o che il prezzo superi una media mobile   (vedi screenshot n. 3)       per confermare la divergenza prima di segnalare l'opportunità commerciale. Combinato con le
Questo indicatore multi time frame e multi simbolo può identificare le seguenti 5 croci: quando una media mobile veloce attraversa una linea di media mobile lenta. quando il prezzo ha raggiunto una singola media mobile (chiusa sopra/sotto o rimbalzata). quando è apparsa una formazione a media mobile tripla (tutti e 3 i MA:s in allineamento consecutivo). quando la linea principale MACD attraversa la linea di segnale. quando la linea del segnale attraversa la linea MACD zero (0). Combinato con le
Per favore, se possibile, considera l'acquisto del       Versione MT5   che continuerò a sviluppare (non ci saranno aggiornamenti futuri per questa versione MT4). Ti consiglio anche di leggere il       blog del prodotto   (manuale) dall'inizio alla fine in modo che sia chiaro fin dall'inizio cosa offre EA. La strategia principale di questo Expert Advisor (EA) è quella di piazzare operazioni quando 3 medie mobili (MA) sono in allineamento consecutivo e ad una certa distanza l'una dall'altra (può
L'indicatore identifica quando si verifica una divergenza tra il prezzo e un oscillatore/indicatore. Identifica divergenze sia rialziste che ribassiste. Ha un'opzione di filtro RSI che consente di filtrare solo le configurazioni più forti. L'indicatore offre anche opzioni per attendere un breakout del canale Donchian o che il prezzo attraversi una media mobile (vedi screenshot n. 3) per confermare la divergenza prima di segnalare l'opportunità commerciale. Combinato con le tue regole e tecniche,
Questo indicatore multi time frame e multi simbolo esegue la scansione di barre pin, stelle del mattino/sera, engulfing, pinzette, colpi a tre linee, barre interne e gagliardetti e triangoli.   L'indicatore può essere utilizzato anche in modalità grafico singolo. Si prega di leggere di più su questa opzione nel prodotto   blog .   Combinato con le tue regole e tecniche, questo indicatore ti consentirà di creare (o migliorare) il tuo potente sistema. Caratteristiche Può monitorare contemporaneam
This multi time frame and multi symbol indicator scans for Pin bars, Morning/Evening stars, Engulfings, Tweezers, Three line strikes, Inside bars and Pennants and Triangles. The indicator can also be used in single chart mode. Please read more about this option in the product's blog . Combined with your own rules and techniques, this indicator will allow you to create (or enhance) your own powerful system. Features Can monitor all symbols visible in your Market Watch window at the same time. Ap
Questo indicatore riconosce un tipo speciale di formazione Inside Bar che è formata da una grande candela Master seguita da 4 candele più piccole (vedi la spiegazione della strategia di seguito). Caratteristiche Traccia le linee di stop di acquisto/vendita sul grafico, nonché i livelli di take profit e stop loss. I livelli TP/SL si basano sull'indicatore ATR (Average True Range). I colori degli oggetti sono modificabili. Ti invia un avviso in tempo reale quando viene identificata una formazione
Questo indicatore multi time frame e multi simbolo identifica quando la linea del segnale stocastico attraversa la linea principale stocastica. Come bonus può anche eseguire la scansione delle bande di Bollinger e dei cross RSI ipercomprato/ipervenduto. Combinato con le tue regole e tecniche, questo indicatore ti permetterà di creare (o migliorare) il tuo potente sistema. Caratteristiche Può monitorare contemporaneamente tutti i simboli visibili nella finestra Market Watch. Applica l'indicatore
This multi indicator/oscillator (hereafter indicator), multi time frame and multi symbol indicator identifies when a divergence occurs between price and one, two or three indicators. It identifies both regular/classical (trend reversal) and hidden (trend continuation) divergences. It has RSI and MA trend filter options which makes it possible to filter out only the strongest setups. Combined with your own rules and techniques, this indicator will allow you to create (or enhance) your own powerfu
This multi time frame and multi symbol indicator identifies fractals patterns. As a bonus it can also scan for Parabolic SAR (pSAR) trend changes. Combined with your own rules and techniques, this indicator will allow you to create (or enhance) your own powerful system. Features Can monitor all symbols visible in your Market Watch window at the same time. Apply the indicator to just one chart and instantly monitor the entire market. Can monitor every time frame, from M1 to MN, and sends you a
Filtro:
Multi Disipliner
352
Multi Disipliner 2022.02.21 21:10 
 

nice

Andrew William Little
467
Andrew William Little 2020.12.10 03:18 
 

Great indicator for trading divergences on multiple time frames with both individual and simultaneous alignment. Definitely recommended!

Bruno Cano
268
Bruno Cano 2019.11.27 01:54 
 

Excellent indicator, on the other hand Jan is an excellent person who has managed to answer my questions quickly and easily.

I recommend this indicator.

Thomas
85
Thomas 2019.06.13 16:59 
 

Again a great indicator from Jan. It works great and you can decide how usefull the signals are. Finding not the wright words to thank Jan for his wonderful work. Will not be the last indicator I will buy.

Devonish
2938
Devonish 2019.03.19 12:34 
 

I like it :)

If divergence forms a part of your strategy, then this indicator offers a lot. There are various ways you could use it. The ability to have set ups ranked by score is nice.

This programmer offers quality products and provides good support.

Rispondi alla recensione
Versione 2.6 2023.11.18
*** IMPORTANT - Please always make a backup of the existing indicator (the .ex5 file) before you make the update ***

Change log:
- improved the accuracy when clicking on the text in a box (rectangle)
- added a new input parameter for additional symbols
- clicking on the symbol name in the first column will open up a D1 chart
- added the option to set the border color
Versione 2.5 2022.06.25
*** Please always make a backup of the existing indicator (the .ex5 file) before you make an update ***

- added the possibility to get individual divergence alerts (for each single divergence)
Versione 2.4 2020.10.12
*** Please always make a backup of the existing indicator (the .ex5 file) before you make an update ***

- added scanning for Accelerator oscillator divergences
- added an option to set the scanning interval. This is by default set to 1 second but could be set to for instance 60 seconds, or higher, for users with slower computers.
Versione 2.3 2020.09.07
*** Please always make a backup of the existing indicator (the .ex5 file) before you make an update ***

- added a possibility to enable writing of of global variables when point ranking has been enabled. The global variables can be used by an Expert Advisor for automatical trading.

- I have changed the logic of detecting divergences so that more divergences will be detected. The new logic will allow divergences even if there are additional indicator extremums (top/bottoms) between the 2 already existing extremum points. Please be aware of the fact that the new logic also comes with a performance cost. Something which will be more visible on slower computers.

Versione 2.2 2020.09.01
*** Please always make a backup of the existing indicator (the .ex5 file) before you make an update ***

- bug fix. Not a mandatory update if everything is already working as it should.
Versione 2.1 2020.08.23
*** Please always make a backup of the existing indicator (the .ex5 file) before you make an update ***

- added the possibility to select from all supported time frames in MT5. Max. 9 time frames can be used in the dashboard
Versione 2.0 2020.07.22
*** Please always make a backup of the existing indicator (the .ex4 file) before you install an update ***

- added an option to change the blue color in the rectangles when there is no signal (neutral)
Versione 1.9 2020.06.08
- Recompiled (recommended by Metaquotes as of June 05,2020) to the new MT5 version 2485: https://www.mql5.com/en/forum/342948
Versione 1.8 2020.06.04
- upon request I have added the possibility to scan for "early" divergences. This means that the alert will come directly upon candle open instead of waiting for the slope in the indicator to change direction (candle shift 1 or 2). Candle shift must be set to 0 for this to work. Please be aware though that this will lead to more false signals.
Versione 1.7 2019.12.23
- added information if the divergence is hidden or regular. Please see the first screenshot.
- added the possibility to set the rectangle bull and bear colors
Versione 1.6 2019.11.27
- added support for the H12 time frame
- added Bollinger bands (reversal) trend filter
Versione 1.5 2019.11.01
- added support for ADX, ATR, OBV, MFI and Momentum divergences
Versione 1.4 2019.05.27
- corrected an issue with empty dashboard when having less than 9 symbols
Versione 1.3 2019.04.04
- fixed an issue with the indicator not properly terminating when manually offloaded from the chart or when the terminal was closed.
Versione 1.2 2019.03.19
- added the possibility to add a custom text for alerts
- added the possbility to be alerted based on the point system instead of the color count system
Versione 1.1 2019.03.18
- resolved some minor display issues
- the indicactor will now print warnings in the Expert tab if there are not enough bars on a chart. Can sometimes happen on WK1 and MN