• Panoramica
  • Recensioni (3)
  • Commenti (12)
  • Novità

Trend dashboard MT5

5

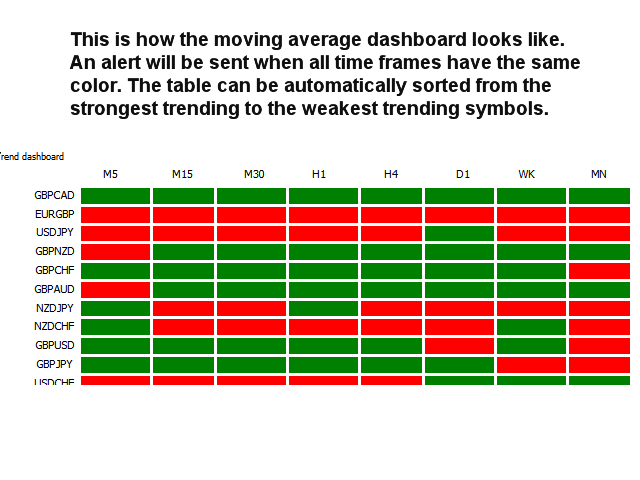
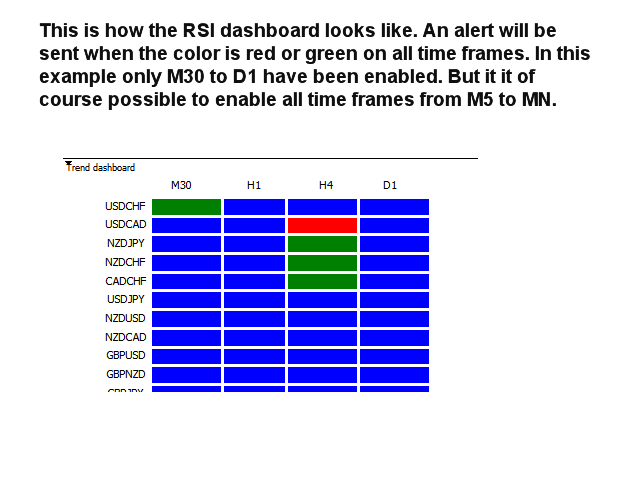
Questo indicatore di tendenza multi time frame e multi simbolo invia un avviso quando è stata identificata una forte tendenza o inversione di tendenza. Può farlo selezionando di costruire il cruscotto usando Media mobile (singola o doppia (crossover MA)), RSI, bande di Bollinger, ADX, indice composito (Constance M. Brown), Awesome (Bill Williams), MACD (linea di segnale ), Heiken Ashi livellato, media mobile di Hull, crossover stocastici, attivatore di Gann HiLo e indice dinamico dei trader. Può essere utilizzato con tutte le fasce orarie da M1 a MN. massimo Nella dashboard possono essere visualizzati 9 intervalli di tempo contemporaneamente. I colori nel cruscotto sono verde per rialzista, rosso per ribassista e blu per neutro (valori dell'indicatore non nell'intervallo).

Combinato con le tue regole e tecniche, questo indicatore ti permetterà di creare (o migliorare) il tuo potente sistema.

Caratteristiche

  • L'indicatore può scrivere i segnali su variabili globali che possono essere utilizzate da un Expert Advisor per il trading automatico.
  • È possibile selezionare fino a 9 fasce orarie da utilizzare.
  • Esegue continuamente un ordinamento della classifica di forza della tendenza all'interno della dashboard. È comunque possibile disabilitare questo ordinamento per facilitare la ricerca di un simbolo specifico. I simboli saranno quindi visibili nello stesso ordine in cui sono stati inseriti nel parametro Simboli o nell'ordine in cui sono visibili nella finestra Market Watch.
  • Cliccando all'interno di un rettangolo si aprirà un nuovo grafico con il simbolo e la fascia oraria in questione.

È sufficiente posizionare l'indicatore su un grafico e riceverai un avviso da qualsiasi simbolo a tua scelta. Sono supportati tutti i tipi di avviso.

Parametri di input

Si prega di trovare la descrizione e la spiegazione dei parametri di input qui .

Si prega di notare che questo indicatore non è supportato nel tester di strategia. Inoltre, non disegnerà linee e frecce o venderà e acquisterà consigli su alcun grafico.

L'indicatore deve essere messo su un grafico M5. Un grafico pulito (vuoto) senza altri indicatori o Expert Advisor su di esso che potrebbero interferire con il dashboard. La dashboard verrà caricata in una finestra dell'indicatore che puoi espandere per coprire l'intero grafico.


Recensioni 3
rbowen125
72
rbowen125 2023.11.16 03:47 
 

very satisfied with this software exactly what i needed to improve my trading

Devonish
2938
Devonish 2019.03.05 13:55 
 

I really like this tool, yes there are similar products out there, I even have some; but what I like about this particular indicator is the option to have it 'stack' the trends in order of strength and also the ability to flip to RSI reversal mode. Nice job :)

Prodotti consigliati
Questo indicatore multi time frame e multi simbolo identifica quando la linea del segnale stocastico attraversa la linea principale stocastica. In alternativa può anche avvisare quando lo stocastico sta lasciando (senza che la linea di segnale attraversi la linea principale) un'area di ipercomprato/ipervenduto. Come bonus può anche eseguire la scansione delle bande di Bollinger e degli incroci RSI ipercomprato/ipervenduto. Combinato con le tue regole e tecniche, questo indicatore ti permetterà d
Questo indicatore del dashboard di divergenza multi time frame e multi simbolo invia un avviso quando una o due divergenze diverse sono state identificate su più time frame e non su singole divergenze. Può essere utilizzato con tutte le fasce orarie da M1 a MN. È possibile visualizzare contemporaneamente nella dashboard un massimo di 9 intervalli di tempo. È possibile abilitare il filtro di tendenza della media mobile, dell'RSI o delle bande di Bollinger per filtrare solo le configurazioni più f
Questo indicatore multi time frame e multi simbolo esegue la scansione di barre pin, stelle del mattino/sera, engulfing, pinzette, colpi a tre linee, barre interne e gagliardetti e triangoli.   L'indicatore può essere utilizzato anche in modalità grafico singolo. Si prega di leggere di più su questa opzione nel prodotto   blog .   Combinato con le tue regole e tecniche, questo indicatore ti consentirà di creare (o migliorare) il tuo potente sistema. Caratteristiche Può monitorare contemporaneam
Signal Eskiya, in addition to channel lines, reflects entry signals in the form of arrows. Trading strategies using the channel indicator belong to the classic methods of technical analysis, are easy to execute, and therefore available even to beginners. Price ranges work equally well on any trading assets and timeframes, they can be used both independently and with additional confirmation from oscillators and market volumes. American traders say: “Trend is your friend”, which means “Trend is
In the Forex trading system, the Pivot Points trading method is a classic trading strategy. Pivot Points is a very simple resistance support system. Based on yesterday’s highest, lowest and closing prices, seven price points are calculated, including one pivot point, three resistance levels and three support levels. The resistance line and the support line are one of the tools that are often used in technical analysis, and the role of the support line and the pressure line can be mutually tran
The indicator ‘Probability Range Bands’ gives a prediction of the amount, how much the asset is moving from its current price. The range bands give probabilities, that the candle close will not exceed this certain price level. It is also called the expected move for the current candle close.   This Indicator is based on statistical methods, probabilities and volatility. Asset price is assumed to follow a log-normal distribution. Therefore, log returns are used in this indicator to determine the
Bar Sequential
Maximiliano Frisione Figueroa
This indicator can help you clearly identify trend changes in both bullish and bearish markets. The indicator compares the closing price of the last candle with the closing price of the candle "X" periods ago (input parameter). In an uptrend, an initial number '1' is plotted if a candle closes higher than the closing of a candle "X" periods ago. In a downtrend, an initial number '1' is plotted if a candle closes below the closing of a candle "X" periods ago. Subsequent numbers are plotted when e
Murrey Math Lines The concept of this technical analysis system was developed by T. Henning Murrey in 1995 and described in The Murrey Math Trading System; For All Markets. The main concept here is that all markets behave in the same manner based upon the observations made by W.D. Gann. To date, the Murrey Math Line X it is one the most popular methods of Forex analysis and trading. Formula The Murrey Math Line X is calculated with the help of price movement segment, which, in accordance to Gan
Santa Trend
Marco Aurelio Cestari
4.22 (9)
Santa Trend Indicator  is an efficient way to forecast and detect the trend in any market. Advantages Generates instant buy and sell signals. Provides an alternate exit strategy to your existing trading system. Never repaints, never backpaints, never recalculates. Works in all symbols and all timeframes. Perfect trend filter for any strategy or expert advisor. Fully compatible with Expert Advisor (EA) development. Does not lag.
FREE
Zigzag X Fibo
Ian David Emmanuel Bello
The ZigZag indicator's main objective is to highlight significant price movements by filtering out minor price fluctuations. It enables the visualization of trends by eliminating market "noise," which can assist traders in making more informed decisions. Adding the Fibonacci indicator, which is a powerful tool for identifying potential support and resistance levels in financial markets.
Kill Zones MT5
Diego Arribas Lopez
MT4 Version Kill Zones Kill Zones allows you to insert up to 3 time zones in the chart. The visual representation of the Kill Zones in the chart together with an alert and notification system helps you to ignore fake trading setups occurring outside the Kill Zones or specific trading sessions. Using Kill Zones in your trading will help you filter higher probability trading setups. You should select time ranges where   the market   usually reacts with high volatility. Based on   EST time zone, f
Considering the main theories of Forex (Dow Theory, support lines, chart patterns, and Fibonacci retracements), It tells you the price range where whales (large investors) are likely to appear. You can trade at the price points that professionals also aim for. You no longer have to warry about where to aim next. We are live-streaming the actual operation of the system. Please check for yourself if it is usable. Please check it out for yourself. https://www.youtube.com/@ganesha_forex We do n
I recommend you to read the  product's blog  (manual) from start to end so that it is clear from the beginning what the indicator offers. This multi time frame and multi symbol supply and demand zone dashboard indicator sends alerts when the price has reached a supply/demand zone. It is also possible to use it to be alerted about regular double tops/bottoms instead of zones. It can be used with all time frames from M1 to MN. Maximum 9 time frames can be shown in the dashboard at the same time. 
I  recommend you to read the   product's blog  (manual) from start to end so that it is clear from the beginning what the indicator offers. This multi time frame and multi symbol indicator scans for engulfing and tweezer formations.  The indicator can also be used in single chart mode. Combined with your own rules and techniques, this indicator will allow you to create (or enhance) your own powerful system. Features Can monitor all symbols visible in your Market Watch window at the same time. A
FIBO Trend PRO mt5
Evgenii Aksenov
5 (4)
The indicator allows you to instantly determine the current trend by color and FIBO levels. Higher Timeframe the panel shows the current trend of higher periods, helping to determine the strength of the trend. Trade according to the trend when changing the color of candles or trade against the trend when the price hit the extreme levels of the FIBO Trend PRO  indicator   Advantages of the FIBO Trend PRO Indicator never repaint and does not change their values Very easy to use and intuitive App
Didi Index
Flavio Javier Jarabeck
4.77 (22)
The famous brazilian trader and analyst Didi Aguiar created years ago a study with the crossing of 3 Simple Moving Averages called "Agulhada do Didi", then later was also named Didi Index, as a separate indicator. The period of those SMAs are 3, 8 and 20. As simple as that, this approach and vision bring an easy analysis of market momentum and trend reversal to those traders looking for objective (and visual) information on their charts. Of course, as always, no indicator alone could be used wit
FREE
Simple indicator to calculate fibonacci retracement levels on time. Add to chart and move trend line to set the fibonacci retracement levels. Inputs Levels  - levels for which to calculate values, separated by space, default are fibonacci levels Show time  - if true, time will be shown on levels Show date  - if true, date will be shown on levels Show fibonacci level  - if true, value of levels will be shown Fibonacci lines color  - color of levels Trend line color  - color of trend line which de
FREE
Analyze potential   Covered Call   structures in the Brazilian market. Define where you want the break-even of your structure and see what structure to use. It works for any asset that has authorized series of options on B3 (Brazilian Stock Exchange). Associate the indicator to the asset you want to set up the Covered Call. *** ATENTION *** For the robot to work, the service that consults the authorized series of B3 options must be running on your terminal. Download the utility for free from
FREE
mql4 version:  https://www.mql5.com/en/market/product/44606   Simple indicator to calculate profit on fibonacci retracement levels with fixed lot size, or calculate lot size on fibonacci levels with fixed profit. Add to chart and move trend line to set the fibonacci retracement levels. Works similar as default fibonacci retracement line study in Metatrader. Inputs Fixed  - select what value will be fix, lot or profit Fixed value  - value that will be fix on all levels Levels  - levels for which
This indicator helps to identify market sessions, It's High/Low, Open Range (OR), range of the sessions in pips and percentage of previous day (change%) under OHLC.   It is also editable for any brokerage market watch time. For traders who use session trading strategies such as Mark B. Fisher ACD it can be super effective, where they can edit OR from the settings to either line or box.  We tried to make the settings easier to edit, for traders' use on different markets, charts and brokerage t
The indicator scans for TD Sequential signals in multiple timeframes for the all markets filtered and shows the results on Dashboard. Key Features Dashboard can be used for all markets It can scan for signals on MN1, W1, D1, H4, H1, M30, M15 ,M5, M1 timeframes Parameters UseMarketWatch: Set true to copy all symbols available in market watch MarketWatchCount : Set the number of symbols that you want to copy from the market watch list. CustomSymbols: Enter the custom symbols that you want to be a
I recommend you to read the  product's blog  (manual) from start to end so that it is clear from the beginning what the EA offers. Signal monitoring can be found here . If you first download a demo version of the EA the news file 'newshistory.bin' must be placed in the Metratrader common folder. It depends on your user name and is usually located in  C:\Users\YOUR_USER_NAME\AppData\Roaming\MetaQuotes\Terminal\Common\Files\. You need to download the file 'newshistory.zip', located at the end of
The market structure indicator helps traders easily read market trends, this indicator shows trend continuity and trend reversals, this tool will be very useful for beginners who are just getting to know market structure, the indicator will provide visualization of the patterns that occur Key Features: 1. BOS pattern: The indicator will provide an overview of the Break Of Structure pattern, where the pattern will indicate the continuation of the trend 2. CHOCH Pattern: The indicator will prov
I recommend you to read the   product's blog  (manual) from start to end so that it is clear from the beginning what the indicactor offers. This multi time frame and multi symbol indicator can identify the following 5 crosses: when a fast moving average crosses a slow moving average line. when price has reached a single moving average (closed above/below or just bounced). when a triple moving average formation has appeared (all 3 MA:s in consecutive alignment) when the MACD main line crosses th
ReSu mt5
Daniel Opoku
The Wamek Support and Resistant (WSR) Indicator is a remarkable tool that stands out in the world of technical analysis. It sets itself apart by cleverly combining price action and leading indicators to delineate support and resistance levels with a high degree of accuracy. Its unique feature is its adaptability; users can fine-tune the indicator by adjusting input parameters, enabling them to create customized support and resistance levels that suit their trading strategies. Notably, one of WSR
The key to success is always a good optimisation. The system has a number of variables and in this case its simplicity is the key to its success. The system looks for the different "Gaps" as market entry failures and then filters them through a series of Moving Averages to decide whether it should enter or not. It is a simple but powerful system. The variables are the following: Lot: Defines the lot size. TakeProfit : Defines the take profit in pips. Stop Loss: Defines the stop loss
FREE
FIlter Profesional
Ignacio Agustin Mene Franco
Filter Professional , Safari pack indicator 3, It has an indicator that is a type of moving average with color that will mark the entrance perfect at different times, when it marks the green line, an upward trend is coming and it is entry for purchase, when it marks the gold line it is a downtrend gives bearish entry zone. It is used for the Forex markets and synthetic indices all pairs! All temporalities! Good profit!
SmartMass MT5
Roberto Alvarez
SMARTMASS INDICATOR This indicator is different from all known volume indicators. It has a significant distinction; it is an algorithm that relates price movement to volume, attempting to find proportionality and efficient movement while filtering out noise and other movements that are more random and do not follow a trend or reversal. Ultimately, it reveals the true strength of the movement, indicating whether it has genuine support from bulls or bears or if it's merely a high-volume movemen
MetaForecast M5
Vahidreza Heidar Gholami
5 (2)
MetaForecast predice e visualizza il futuro di qualsiasi mercato basandosi sull'armonia dei dati dei prezzi. Sebbene il mercato non sia sempre prevedibile, se esiste un modello nei prezzi, MetaForecast può prevedere il futuro con la massima precisione possibile. Rispetto ad altri prodotti simili, MetaForecast può generare risultati più accurati analizzando le tendenze di mercato. Parametri di input Past size (Dimensione passata) Specifica il numero di barre che MetaForecast utilizza per creare
High And Low MT5
Dmitriy Parfenovich
On the current chart, this indicator displays candlestick highs and lows of another time frame. Input Parameters: TimeFrame - chart time frame whose data will be displayed on the current price chart (by default, H12). Time Zone - shift of the indicator by time zone relative to the broker's time (by default, Broker-1). If the broker's time zone is UTC+1 and the Time Zone parameter is set to Broker-1, the bends of the indicator will be plotted in multiples of Greenwich Time. Indicator buffer value
Gli utenti di questo prodotto hanno anche acquistato
Innanzitutto è importante sottolineare che questo sistema di trading è un indicatore Non-Repainting, Non-Redrawing e Non-Lagging, il che lo rende ideale sia per il trading manuale che per quello automatico. Il "Sistema di Trading Smart Trend MT5" è una soluzione completa pensata sia per i trader principianti che per quelli esperti. Combina oltre 10 indicatori premium e offre più di 7 robuste strategie di trading, rendendolo una scelta versatile per diverse condizioni di mercato. Strategia di Tre
Atomic Analyst MT5
Issam Kassas
4.27 (11)
Innanzitutto, vale la pena sottolineare che questo indicatore di trading non è repaint, non è ridisegno e non presenta ritardi, il che lo rende ideale sia per il trading manuale che per quello automatico. L'Analista Atomico è un indicatore di azione del prezzo PA che utilizza la forza e il momentum del prezzo per trovare un miglior vantaggio sul mercato. Dotato di filtri avanzati che aiutano a rimuovere rumori e segnali falsi, e aumentare il potenziale di trading. Utilizzando più strati di in
FX Volume MT5
Daniel Stein
4.94 (17)
Ricevi il tuo aggiornamento quotidiano sul mercato con dettagli e schermate tramite il nostro Morning Briefing qui su mql5 e su Telegram ! FX Volume è il PRIMO e UNICO indicatore di volume che fornisce una visione REALE del sentiment del mercato dal punto di vista del broker. Fornisce informazioni straordinarie su come gli operatori di mercato istituzionali, come i broker, sono posizionati sul mercato Forex, molto più velocemente dei rapporti COT. Vedere queste informazioni direttamente sul vo
Quantum Trend Sniper
Bogdan Ion Puscasu
5 (37)
Presentazione       Quantum Trend Sniper Indicator   , l'innovativo indicatore MQL5 che sta trasformando il modo in cui identifichi e scambi le inversioni di tendenza! Sviluppato da un team di trader esperti con un'esperienza di trading di oltre 13 anni,       Indicatore Quantum Trend Sniper       è progettato per spingere il tuo viaggio di trading verso nuove vette con il suo modo innovativo di identificare le inversioni di tendenza con una precisione estremamente elevata. *** Acquista Quant
Gold Stuff mt5
Vasiliy Strukov
4.89 (166)
Gold Stuff mt5 è un indicatore di tendenza progettato specificamente per l'oro e può essere utilizzato anche su qualsiasi strumento finanziario. L'indicatore non ridisegna e non è in ritardo. Periodo consigliato H1. Contattami subito dopo l'acquisto per avere le impostazioni e un bonus personale!   IMPOSTAZIONI Disegna freccia - acceso spento. disegnando frecce sul grafico. Avvisi: avvisi acustici disattivati. Notifica e-mail - on off. notifiche di posta elettronica. Notifica Puch - on of
Trend Screener Pro MT5
STE S.S.COMPANY
4.89 (61)
Indicatore di tendenza, soluzione unica rivoluzionaria per il trading di tendenze e il filtraggio con tutte le importanti funzionalità di tendenza integrate in un unico strumento! È un indicatore multi-timeframe e multi-valuta al 100% non ridipingibile che può essere utilizzato su tutti i simboli/strumenti: forex, materie prime, criptovalute, indici e azioni. Trend Screener è un indicatore di tendenza che segue un indicatore efficiente che fornisce segnali di tendenza a freccia con punti nel gra
RelicusRoad Pro MT5
Relicus LLC
4.82 (22)
Ora $ 147 (aumentando a $ 499 dopo alcuni aggiornamenti) - account illimitati (PC o MAC) Manuale utente di RelicusRoad + Video di formazione + Accesso al gruppo Discord privato + Stato VIP UN NUOVO MODO DI GUARDARE IL MERCATO RelicusRoad è l'indicatore di trading più potente al mondo per forex, futures, criptovalute, azioni e indici, fornendo ai trader tutte le informazioni e gli strumenti di cui hanno bisogno per rimanere redditizi. Forniamo analisi tecniche e piani di trading per aiutar
Innanzitutto, vale la pena sottolineare che questo Strumento di Trading è un Indicatore Non-Ridipingente, Non-Ridisegnante e Non-Laggante, il che lo rende ideale per il trading professionale. L'Indicatore Smart Price Action Concepts è uno strumento molto potente sia per i nuovi che per i trader esperti. Racchiude più di 20 utili indicatori in uno solo, combinando idee di trading avanzate come l'Analisi del Trader del Circolo Interno e le Strategie di Trading dei Concetti del Denaro Intelligen
Top indicator for MT5   providing accurate signals to enter a trade without repainting! It can be applied to any financial assets:   forex, cryptocurrencies, metals, stocks, indices .  Watch  the video  (6:22) with an example of processing only one signal that paid off the indicator! MT4 version is here It will provide pretty accurate trading signals and tell you when it's best to open a trade and close it. Most traders improve their trading results during the first trading week with the help of
FX Power MT5 NG
Daniel Stein
5 (4)
Ricevi il tuo aggiornamento quotidiano sul mercato con dettagli e schermate tramite il nostro Morning Briefing qui su mql5 e su Telegram ! FX Power MT5 NG è la nuova generazione del nostro popolare misuratore di forza delle valute, FX Power. Cosa offre questo misuratore di forza di nuova generazione? Tutto ciò che avete amato dell'FX Power originale IN PIÙ Analisi della forza di ORO/XAU Risultati di calcolo ancora più precisi Periodi di analisi configurabili individualmente Limite di calcolo pe
Advanced Supply Demand MT5
Bernhard Schweigert
4.53 (15)
La migliore soluzione per qualsiasi principiante o trader esperto! Questo indicatore è uno strumento di trading unico, di alta qualità e conveniente perché abbiamo incorporato una serie di funzionalità proprietarie e una nuova formula. Con questo aggiornamento, sarai in grado di mostrare fusi orari doppi. Non solo potrai mostrare una TF più alta, ma anche entrambe, la TF del grafico, PIÙ la TF più alta: SHOWING NESTED ZONES. Tutti i trader di domanda di offerta lo adoreranno. :) Informazioni imp
Auto Order Block with break of structure based on ICT and Smart Money Concepts Futures Break of Structure ( BoS )             Order block ( OB )            Higher time frame Order block / Point of Interest ( POI )    shown on current chart           Fair value Gap ( FVG ) / Imbalance   ,  MTF      ( Multi Time Frame )    Volume Imbalance     ,  MTF          vIMB Gap’s Equal High / Low’s     ,  MTF             EQH / EQL Liquidity               Current Day High / Low           HOD /
XQ Indicator MetaTrader 5
Marzena Maria Szmit
5 (1)
Step into the realm of Forex trading with confidence and precision using XQ, a cutting-edge Forex indicator designed to elevate your trading game to unprecedented heights. Whether you're a seasoned trader or just stepping into the world of currency exchange, XQ Forex Indicator empowers you with the insights and signals needed to make informed trading decisions. The signal conditions are a combination of three indicators, and XQ Forex Indicator only display  medium and long-term trends . The ind
ICT, SMC, SMART MONEY CONCEPTS, SMART MONEY, Smart Money Concept, Support and Resistance, Trend Analysis, Price Action, Market Structure, Order Blocks, BOS/CHoCH,   Breaker Blocks ,  Momentum Shift,   Supply&Demand Zone/Order Blocks , Strong Imbalance,   HH/LL/HL/LH,    Fair Value Gap, FVG,  Premium  &   Discount   Zones, Fibonacci Retracement, OTE, Buy Side Liquidity, Sell Side Liquidity, BSL/SSL Taken, Equal Highs & Lows, MTF Dashboard, Multiple Time Frame, BigBar, HTF OB, HTF Market Structure
Blahtech Supply Demand MT5
Blahtech Limited
4.57 (14)
Was: $299  Now: $99   Supply Demand uses previous price action to identify potential imbalances between buyers and sellers. The key is to identify the better odds zones, not just the untouched ones. Blahtech Supply Demand indicator delivers functionality previously unavailable on any trading platform. This 4-in-1 indicator not only highlights the higher probability zones using a multi-criteria strength engine, but also combines it with multi-timeframe trend analysis, previously confirmed swings
L'indicatore Quadrato di Gann è uno strumento potente di analisi di mercato basato sull'articolo "Formula Matematica per le Previsioni di Mercato" scritto da W.D. Gann. Questo strumento utilizza concetti matematici e teorie di Gann per effettuare un'analisi precisa del mercato. Utilizza i quadrati di 144, 90, 52 e anche il quadrato di 9. Inoltre, integra il metodo del  per il quadrato di 9 e la sua relazione con canali e modelli stellari di quel quadrato. Manuale Utente e Applicazione: Prima di
AW Trend Predictor MT5
AW Trading Software Limited
4.76 (54)
La combinazione di trend e livelli di rottura in un unico sistema. Un algoritmo di indicatore avanzato filtra il rumore del mercato, determina la tendenza, i punti di ingresso e i possibili livelli di uscita. I segnali indicatori sono registrati in un modulo statistico, che permette di selezionare gli strumenti più adatti, mostrando l'efficacia dello storico dei segnali. L'indicatore calcola i segni Take Profit e Stop Loss. Manuale e istruzioni ->   QUI   / versione MT4 ->   QUI Come fare tradi
Volume by Price MT5
Brian Collard
5 (3)
The Volume by Price Indicator for MetaTrader 5 features Volume Profile and Market Profile TPO (Time Price Opportunity). Get valuable insights out of currencies, equities and commodities data. Gain an edge trading financial markets. Volume and TPO histogram bar and line charts. Volume Footprint charts. TPO letter and block marker charts including split structures. Versatile segmentation and compositing methods. Static, dynamic and flexible ranges with relative and/or absolute visualizations. Lay
MetaBands M5
Vahidreza Heidar Gholami
4.67 (3)
MetaBands uses powerful and unique algorithms to draw channels and detect trends so that it can provide traders with potential points for entering and exiting trades. It’s a channel indicator plus a powerful trend indicator. It includes different types of channels which can be merged to create new channels simply by using the input parameters. MetaBands uses all types of alerts to notify users about market events. Features Supports most of the channel algorithms Powerful trend detection algorith
Presentazione       Quantum Breakout PRO   , l'innovativo indicatore MQL5 che sta trasformando il modo in cui scambi le zone di breakout! Sviluppato da un team di trader esperti con un'esperienza di trading di oltre 13 anni,       Quantum Breakout PRO       è progettato per spingere il tuo viaggio di trading a nuovi livelli con la sua strategia innovativa e dinamica della zona di breakout. Quantum Breakout Indicator ti fornirà frecce di segnalazione sulle zone di breakout con 5 zone target
Owl Smart Levels MT5
Sergey Ermolov
4.47 (36)
Versione MT4  |  FAQ L' indicatore Owl Smart Levels è un sistema di trading completo all'interno dell'unico indicatore che include strumenti di analisi di mercato popolari come i frattali avanzati di Bill Williams , Valable ZigZag che costruisce la corretta struttura a onde del mercato, e i livelli di Fibonacci che segnano i livelli esatti di entrata nel mercato e luoghi per prendere profitti. Descrizione dettagliata della strategia Istruzioni per lavorare con l'indicatore Consulente-assistente
Gartley Hunter Multi
Siarhei Vashchylka
5 (5)
Gartley Hunter Multi - An indicator for searching for harmonic patterns simultaneously on dozens of trading instruments and on all classic timeframes: (m1, m5, m15, m30, H1, H4, D1, Wk, Mn). Manual (Be sure to read before purchasing) | Version for MT4 Advantages 1. Patterns: Gartley, Butterfly, Shark, Crab. Bat, Alternate Bat, Deep Crab, Cypher 2. Simultaneous search for patterns on dozens of trading instruments and on all classic timeframes 3. Search for patterns of all possible sizes. Fr
Trend Line Map Pro MT5
STE S.S.COMPANY
4.67 (9)
Trend Line Map indicator is an addons for   Trend Screener Indicator . It's working as a scanner for all signals generated by Trend screener ( Trend Line Signals ) . It's a Trend Line Scanner based on Trend Screener Indicator.  If you don't have Trend Screener Pro Indicator,   the Trend Line Map Pro will not work.     LIMITED TIME OFFER : Trend Line Map Indicator is available for only 50 $ and lifetime. ( Original price 125$ ) By accessing to our MQL5 Blog,  you can find all our premium indica
TrendDecoder Premium MT5
Christophe, Pa Trouillas
5 (1)
Identificare i range e le prossime mosse probabili     |    Ottenere i primi segnali e la forza delle tendenze     |    Ottenere uscite chiare prima dell'inversione     |    Individuare i livelli di Fibo che il prezzo testerà   |  Indicatore non tracciante e non ritardato - ideale per il trading manuale e automatizzato - adatto a tutti gli asset e a tutte le unità temporali 50% di sconto   - per il lancio poi torna a   >>   149 $ Dopo l'acquisto,   contattatemi su questo canale  per le impostazi
TPSproTREND PrO MT5
Roman Podpora
5 (5)
TPSpro TRENDPRO  - is a trend indicator that automatically analyzes the market and provides information about the trend and each of its changes, as well as giving signals for entering trades without redrawing! The indicator uses each candle, analyzing them separately. referring to different impulses - up or down impulse. Exact entry points into transactions for currencies, crypto, metals, stocks, indices!  -  Version MT4                  DETAILED DESCRIPTION        /       TRADING SETUPS       
Was: $249  Now: $99   Market Profile defines a number of day types that can help the trader to determine market behaviour. A key feature is the Value Area, representing the range of price action where 70% of trading took place. Understanding the Value Area can give traders valuable insight into market direction and establish the higher odds trade. It is an excellent addition to any system you may be using. Inspired by Jim Dalton’s book “Mind Over Markets”, this indicator is designed to suit the
Golden Spikes Detector
Batsirayi L Marango
5 (1)
Golden Spikes Detector This indicator is based on an advanced strategy primarily for trading spikes on Boom and Crash Indices. Complex algorithms were implemented to detect high probability entries only. It alerts on potential Buy and Sell entries. To trade spikes on the Deriv or Binary broker, only take Buy Boom and Sell Cash alerts. It was optimised to be loaded on 5-minute timeframe although multiple timeframe analysis is done in the background. Features ·             Desktop pop up and sound
Matrix Arrow Indicator MT5
Juvenille Emperor Limited
5 (14)
Matrix Arrow Indicator MT5   è un trend unico 10 in 1 che segue un indicatore multi-timeframe al   100% non ridipinto   che può essere utilizzato su tutti i simboli/strumenti:   forex ,   materie prime ,   criptovalute ,   indici ,   azioni .  Matrix Arrow Indicator MT5  determinerà la tendenza attuale nelle sue fasi iniziali, raccogliendo informazioni e dati da un massimo di 10 indicatori standard, che sono: Indice di movimento direzionale medio (ADX) Indice del canale delle materie prime (CCI
IX Power MT5
Daniel Stein
5 (2)
IX Power   porta finalmente l'imbattibile precisione di FX Power ai simboli non-Forex. Determina con precisione l'intensità delle tendenze a breve, medio e lungo termine dei vostri indici preferiti, azioni, materie prime, ETF e persino criptovalute. Potete   analizzare tutto ciò che   il vostro terminale ha da offrire. Provatelo e sperimentate come   il vostro tempismo migliori significativamente   durante il trading. Caratteristiche principali di IX Power Risultati di calcolo precisi al
Strong Support mt5
Vasiliy Strukov
5 (9)
I livelli di supporto e resistenza sono stati a lungo uno strumento potente per l'analisi del mercato. L'indicatore di supporto forte costruisce livelli di supporto ai minimi di prezzo locali e livelli di resistenza ai massimi di prezzo locali.  Gli altri miei sviluppi possono essere visualizzati qui Si consiglia di utilizzare insieme a un indicatore di tendenza, ad esempio, Gold Stuff : ciò consentirà di negoziare sulla tendenza e allo stesso tempo determinare le zone di consolidamento o i
Altri dall’autore
Ti consiglio di leggere il       blog del prodotto   (manuale) dall'inizio alla fine in modo che       è chiaro fin dall'inizio cosa offre l'EA. La strategia principale di questo Expert Advisor (EA) è piazzare operazioni quando 3 medie mobili (MA) sono in allineamento consecutivo e ad una certa distanza l'una dall'altra (può essere utilizzata ad esempio per una strategia poco conosciuta utilizzata da alcuni trader istituzionali , che coinvolge le MA 10, 20 e 30 sulla fascia oraria D1). L'EA fun
I recommend you to read the   product's blog  (manual) from start to end so that it is clear from the beginning what the indicactor offers. This multi time frame and multi symbol indicator can identify the following 5 crosses: when a fast moving average crosses a slow moving average line. when price has reached a single moving average (closed above/below or just bounced). when a triple moving average formation has appeared (all 3 MA:s in consecutive alignment) when the MACD main line crosses th
Questo indicatore multi time frame e multi simbolo identifica formazioni alto/basso doppie o triple o un successivo breakout della scollatura (confermato alto/basso). Offre filtri RSI, pin bar, engulfing, tweezer, stelle del mattino/sera, nonché MACD, Awesome (AO) o filtri divergenza RSI che consentono di filtrare solo le configurazioni più forti.       L'indicatore può essere utilizzato anche in modalità grafico singolo. Si prega di leggere di più su questa opzione nel prodotto   blog .   Combi
I recommend you to read the   product's blog  (manual) from start to end so that it is clear from the beginning what the indicactor offers. This multi time frame and multi symbol divergence dashboard indicator sends an alert when one or two different divergences have been identified. It can be used with all time frames from M1 to MN. It is possible to enable moving average or RSI trend filter to filter out only the strongest setups. Combined with your own rules and techniques, this indicator wi
The indicator identifies when a divergence occurs between price and an indicator or oscillator. It identifies both regular and hidden divergences. Combined with your own rules and techniques, this indicator will allow you to create (or enhance) your own powerful system. Features Can detect divergences for the following oscillators/indicators:   MACD, OsMA, Stochastics, RSI, CCI, RVI, Awesome, ADX, ATR, OBV, Composite index, MFI and Momentum. Only one oscillator/indicator can be selected. Draws
FREE
Questo indicatore del dashboard di divergenza multi time frame e multi simbolo invia un avviso quando una o due divergenze diverse sono state identificate su più time frame e non su singole divergenze. Può essere utilizzato con tutte le fasce orarie da M1 a MN. È possibile visualizzare contemporaneamente nella dashboard un massimo di 9 intervalli di tempo. È possibile abilitare il filtro di tendenza della media mobile, dell'RSI o delle bande di Bollinger per filtrare solo le configurazioni più f
Questo indicatore della zona di domanda e offerta disegna le zone sul grafico e invia avvisi quando il prezzo ha raggiunto o rotto una zona. È anche possibile utilizzarlo per essere avvisati di doppi cime/basse regolari invece che di zone. È possibile utilizzare filtri RSI, volume e divergenza per filtrare solo le configurazioni più potenti. Combinato con le tue regole e tecniche, questo indicatore ti consentirà di creare (o migliorare) il tuo potente sistema. Questo indicatore è per il trader p
This multi time frame and multi symbol indicator scans for pin bars. Combined with your own rules and techniques, this indicator will allow you to create (or enhance) your own powerful system. Features Can monitor all symbols visible in your Market Watch window at the same time. Apply the indicator to just one chart and instantly monitor the entire market. Can monitors every time frame, from M1 to MN, and sends you a real-time alert when a pin bar is identified. All Metatrader native alert types
I  recommend you to read the   product's blog  (manual) from start to end so that it is clear from the beginning what the indicator offers. This multi time frame and multi symbol indicator identifies double top/bottom, head & shoulders, pennant/triangle and flag patterns. It is also possible to setup alerts only when a neckline/triangle/flagpole breakout has occured (neckline breakout = confirmed signal for top/bottoms and head & shoulders).  The indicator can also be used in single chart mode.
Please if possible consider the  paid version  which I will continue to develop (there will be no future updates for this free version). This Expert Advisor identifies when a divergence occurs between price and an oscillator/indicator. It identifies both regular/classical (trend reversal) and hidden (trend continuation) divergences. It has RSI, bollinger, stochastics, moving average and ADX filter options which makes it possible to filter out only the strongest setups. The default settings ar
FREE
I  recommend you to read the   product's blog  (manual) from start to end so that it is clear from the beginning what the indicator offers. In addition to finding bullish and bearish Three line strike formations this multi symbol and mutli time frame indicator can also scan for the following candlestick patterns (please see screenshots for explanation of the patterns): Three white soldiers (reversal>continuation pattern) Three black crows (reversal>continuation pattern) The formations do not ap
Questo indicatore può inviare avvisi quando si verifica un cambiamento di colore Heiken Ashi Smoothed. Combinato con le tue regole e tecniche, questo indicatore ti permetterà di creare (o migliorare) il tuo potente sistema. Caratteristiche Può inviare tutti i tipi di avvisi. Possibilità di ritardare l'avviso di una o più barre per confermare il cambio colore (tendenza). Parametri di input Spostamento candela per avviso: l'impostazione predefinita è 1. Impostandolo su 0 ti avviserà del cambiament
FREE
Averaging down EA
Jan Flodin
5 (1)
This cost averaging Expert advisor (EA) places additional trades in the same direction as the original (manually opened) order when the price goes against you. It can be used as a grid system or as pure martingale system (exponential increasing of lot size) or smoothed martingale (for instance linear increasing of the lot size). Due to the risk involved, this EA is more suitable for intermediate to advanced traders who are well aware of how to handle risk management and trading an already profit
The indicator identifies when a divergence occurs between price and an indicator or oscillator. It identifies bullish and bearish hidden or regular (classical) divergences. Combined with your own rules and techniques, this indicator will allow you to create (or enhance) your own powerful system. Features Can detect divergences for the following indicators/oscillators: MACD, OsMA (Moving average of Oscillator), Stochastics, RSI, CCI, RVI, Awesome (AO), ADX, ATR, OBV, MFI, Momentum and   Composi
FREE
Ti consiglio di leggere il   blog (manuale) del prodotto   dall'inizio alla fine in modo che sia chiaro fin dall'inizio cosa offre EA. Questo Expert Advisor identifica quando si verifica una divergenza tra il prezzo e un oscillatore/indicatore. Identifica sia le divergenze regolari/classiche (inversione del trend) che quelle nascoste (continuazione del trend). Dispone di zona di domanda/offerta, RSI, bollinger, stocastico, media mobile (MA regolare e MA di Hull), ADX e opzioni di filtro del vol
Questo indicatore può inviare avvisi quando si verifica un cambiamento di colore Heiken Ashi Smoothed. Combinato con le tue regole e tecniche, questo indicatore ti permetterà di creare (o migliorare) il tuo potente sistema. Caratteristiche Può inviare tutti i tipi di avvisi. Possibilità di ritardare di una barra l'avviso per confermare il cambio colore (tendenza). Parametri di input Attendi la chiusura della candela:       'vero o falso'. Impostandolo su 'true' ritarderà l'avviso all'apertura de
FREE
Questo indicatore multi-time frame e multi-simbolo identifica i modelli doppio alto/basso, testa e spalla, gagliardetto/triangolo e bandiera. È anche possibile impostare avvisi solo quando si è verificato un breakout della scollatura/triangolo/asta della bandiera (breakout della scollatura = segnale confermato per la parte superiore/inferiore e testa e spalle).       L'indicatore può essere utilizzato anche in modalità grafico singolo. Si prega di leggere di più su questa opzione nel prodotto  
Questo indicatore multi time frame e multi simbolo identifica formazioni alto/basso doppie o triple o un successivo breakout della scollatura (confermato alto/basso). Offre RSI, pin bar, engulfing, tweezer, filtri a stella del mattino/sera e opzioni di filtro di divergenza che consentono di filtrare solo le configurazioni più forti.       L'indicatore può essere utilizzato anche in modalità grafico singolo. Si prega di leggere di più su questa opzione nel prodotto   blog .   Combinato con le tue
Questo indicatore riconosce un tipo speciale di formazione Inside Bar che è formata da una grande candela Master seguita da 4 candele più piccole (vedi la spiegazione della strategia di seguito). Caratteristiche Traccia le linee di stop di acquisto/vendita sul grafico, nonché i livelli di take profit e stop loss. I livelli TP/SL si basano sull'indicatore ATR (Average True Range). I colori degli oggetti sono modificabili. Ti invia un avviso in tempo reale quando viene identificata una formazione
I recommend you to read the   product's blog  (manual) from start to end so that it is clear from the beginning what the indicactor offers. This multi time frame and multi symbol supply and demand zone dashboard indicator sends alerts when the price has reached a supply/demand zone. It is also possible to use it to be alerted about regular double tops/bottoms instead of zones. It can be used with all time frames from M1 to MN. It is possible to use RSI, divergence (MACD, OsMA, RSI or Awesome) a
I recommend you to read the  product's blog  (manual) from start to end so that it is clear from the beginning what the indicator offers. This multi time frame and multi symbol supply and demand zone dashboard indicator sends alerts when the price has reached a supply/demand zone. It is also possible to use it to be alerted about regular double tops/bottoms instead of zones. It can be used with all time frames from M1 to MN. Maximum 9 time frames can be shown in the dashboard at the same time. 
L'indicatore identifica quando si verifica una divergenza tra il prezzo e un oscillatore/indicatore. Identifica divergenze regolari e nascoste. Ha un'opzione di filtro RSI che consente di filtrare solo le configurazioni più potenti. L'indicatore offre anche opzioni per attendere una formazione Engulfing, un breakout del canale Donchian o che il prezzo superi una media mobile   (vedi screenshot n. 3)       per confermare la divergenza prima di segnalare l'opportunità commerciale. Combinato con le
Questo indicatore multi time frame e multi simbolo può identificare le seguenti 5 croci: quando una media mobile veloce attraversa una linea di media mobile lenta. quando il prezzo ha raggiunto una singola media mobile (chiusa sopra/sotto o rimbalzata). quando è apparsa una formazione a media mobile tripla (tutti e 3 i MA:s in allineamento consecutivo). quando la linea principale MACD attraversa la linea di segnale. quando la linea del segnale attraversa la linea MACD zero (0). Combinato con le
Per favore, se possibile, considera l'acquisto del       Versione MT5   che continuerò a sviluppare (non ci saranno aggiornamenti futuri per questa versione MT4). Ti consiglio anche di leggere il       blog del prodotto   (manuale) dall'inizio alla fine in modo che sia chiaro fin dall'inizio cosa offre EA. La strategia principale di questo Expert Advisor (EA) è quella di piazzare operazioni quando 3 medie mobili (MA) sono in allineamento consecutivo e ad una certa distanza l'una dall'altra (può
L'indicatore identifica quando si verifica una divergenza tra il prezzo e un oscillatore/indicatore. Identifica divergenze sia rialziste che ribassiste. Ha un'opzione di filtro RSI che consente di filtrare solo le configurazioni più forti. L'indicatore offre anche opzioni per attendere un breakout del canale Donchian o che il prezzo attraversi una media mobile (vedi screenshot n. 3) per confermare la divergenza prima di segnalare l'opportunità commerciale. Combinato con le tue regole e tecniche,
Questo indicatore multi time frame e multi simbolo esegue la scansione di barre pin, stelle del mattino/sera, engulfing, pinzette, colpi a tre linee, barre interne e gagliardetti e triangoli.   L'indicatore può essere utilizzato anche in modalità grafico singolo. Si prega di leggere di più su questa opzione nel prodotto   blog .   Combinato con le tue regole e tecniche, questo indicatore ti consentirà di creare (o migliorare) il tuo potente sistema. Caratteristiche Può monitorare contemporaneam
This multi time frame and multi symbol indicator scans for Pin bars, Morning/Evening stars, Engulfings, Tweezers, Three line strikes, Inside bars and Pennants and Triangles. The indicator can also be used in single chart mode. Please read more about this option in the product's blog . Combined with your own rules and techniques, this indicator will allow you to create (or enhance) your own powerful system. Features Can monitor all symbols visible in your Market Watch window at the same time. Ap
Questo indicatore multi time frame e multi simbolo identifica quando la linea del segnale stocastico attraversa la linea principale stocastica. Come bonus può anche eseguire la scansione delle bande di Bollinger e dei cross RSI ipercomprato/ipervenduto. Combinato con le tue regole e tecniche, questo indicatore ti permetterà di creare (o migliorare) il tuo potente sistema. Caratteristiche Può monitorare contemporaneamente tutti i simboli visibili nella finestra Market Watch. Applica l'indicatore
This multi indicator/oscillator (hereafter indicator), multi time frame and multi symbol indicator identifies when a divergence occurs between price and one, two or three indicators. It identifies both regular/classical (trend reversal) and hidden (trend continuation) divergences. It has RSI and MA trend filter options which makes it possible to filter out only the strongest setups. Combined with your own rules and techniques, this indicator will allow you to create (or enhance) your own powerfu
This multi time frame and multi symbol indicator identifies fractals patterns. As a bonus it can also scan for Parabolic SAR (pSAR) trend changes. Combined with your own rules and techniques, this indicator will allow you to create (or enhance) your own powerful system. Features Can monitor all symbols visible in your Market Watch window at the same time. Apply the indicator to just one chart and instantly monitor the entire market. Can monitor every time frame, from M1 to MN, and sends you a
Filtro:
rbowen125
72
rbowen125 2023.11.16 03:47 
 

very satisfied with this software exactly what i needed to improve my trading

ZERO9898
1786
ZERO9898 2023.04.05 17:05 
 

L'utente non ha lasciato alcun commento sulla valutazione.

Devonish
2938
Devonish 2019.03.05 13:55 
 

I really like this tool, yes there are similar products out there, I even have some; but what I like about this particular indicator is the option to have it 'stack' the trends in order of strength and also the ability to flip to RSI reversal mode. Nice job :)

Rispondi alla recensione
Versione 2.6 2023.11.16
*** IMPORTANT - Please always make a backup of the existing indicator (the .ex5 file) before you make the update ***

Change log:
- improved the accuracy when clicking in a box (rectangle) to open a chart
- clicking on the symbol name in the first column will open up a D1 chart
Versione 2.5 2023.11.15
*** IMPORTANT - Please always make a backup of the existing indicator (the .ex5 file) before you make the update ***

Change log:
- added a new input parameter for additional symbols
- added the option to set the border color
Versione 2.4 2023.04.03
*** IMPORTANT - please always make a backup of the existing indicator (the .ex5 file) before you make an update ***

Change log:
- performance and object visibility improvements
Versione 2.3 2022.03.01
*** Please always make a backup of the existing indicator (the .ex5 file) before you make an update ***

- bug fix in the HULL calculation
Versione 2.2 2021.09.07
*** Please always make a backup of the existing indicator (the .ex5 file) before you make an update ***

- added an option to scan for Traders dynamic index (TDI)
- corrected a bug where the clicking inside the rectangle in some cases did not open a new chart
Versione 2.1 2021.09.05
*** Please always make a backup of the existing indicator (the .ex5 file) before you make an update ***

- added options to scan for Stochastics crossovers, Gann Hi-Lo and Hull moving average
- added a possibilty to set the scan interval in seconds. This to allow to set a higher value for slower computers
Versione 2.0 2020.09.05
*** Please always make a backup of the existing indicator (the .ex5 file) before you make an update ***

Not a mandatory update if everything is already working as it should and you are not using Heiken Ashi smoothed or ADX

- minor bug fix
- corrected an error in the point ranking for Heiken Ashi smoothed
- changed the algorithm for the ADR point ranking. The +DI and -DI lines are now used as well in the calculation. Bullish if the main line is above the level value and at the same time the +DI line is above the -DI line. Bearish if the main line is above the level value and at the same time the -DI line is above the +DI line
- added a possibility to enable writing of of global variables when point ranking has been enabled. The global variables can be used by an Expert Advisor for automatical trading.
Versione 1.9 2020.08.17
*** Please always make a backup of the existing indicator (the .ex5 file) before you make an update ***

- added the possibility to select from all supported time frames in MT5. Max. 9 time frames can be used in the dashboard.
- added Heiken Ashi smoothed
Versione 1.8 2020.07.22
*** Please always make a backup of the existing indicator (the .ex4 file) before you make an update ***

- added an option to change the blue color in the rectangles when there is no signal
- added MACD (signal line). Bullish if above the zero line and vice versa
Versione 1.7 2020.01.22
- added support for the H12 time frame
- corrected a bug which prevented the dashboard to load if you had less than 9 symbols in the list
- added the possibility to set the rectangle bull and bear colors
Versione 1.6 2019.07.10
- added Awesome (AO)
Versione 1.5 2019.04.12
- added Parabolic SAR (PSAR)
Versione 1.4 2019.04.11
- added Composite index
Versione 1.3 2019.04.06
- added Bollinger bands and ADX
Versione 1.2 2019.03.27
- added the possibility to add a custom text to the end of the regular alert text
- added the possbility to be alerted based on a point system instead of the color count system
- added the possibility to be alerted based on xx time frames with same color
- added the possibility to use double MA logic (2 MA:s in consecutive alignment and price above/below them)